Introduction
Detection and characterization of focal liver lesions (FLLs) are common in daily clinical practice. Ultrasonography (USG) is considered a first-line radiological imaging method because it is reliable, low-cost, and easily accessible [1]. Doppler examination and contrast-enhanced USG can help identify FLLs [2]. Unfortunately, in the evaluation of smaller FLLs (< 1 cm), the sensitivity and specificity values of USG examination remain below 70% [3].
Today, the complementary use of contrast-enhanced USG and contrast-enhanced magnetic resonance imaging (MRI) methods is thought to be the best approach for detecting FLLs. However, in some cases, a definitive diagnosis may not be made [4]. Percutaneous liver biopsy, an invasive method, is still performed in patients who cannot be diagnosed with imaging methods. However, liver biopsy includes several negative aspects, such as decreased patient comfort, pain occurring in 20-30% of the procedures, and high morbidity and mortality rates [5,6].
For this reason, sonoelastography has been developed as a new imaging method, which is based on the measurement of tissue stiffness, based on the variability of tissue stiffness with pathological conditions, such as neoplasm or inflammation [7,8]. Shear wave elastography (SWE) is a new method based on the detection of shear waves that occur after sending temporary mechanical impulses to the tissue being examined, to create a quantitative tissue hardness map by the same probe using very fast imaging sequences [9].
This study aimed to investigate the efficacy of SWE in the characterization of common FLLs, especially in the differentiation of benign and malignant lesions.
Material and methods
Study population
A total of 115 patients, comprising 55 males and 60 females, who were sent to the Necmettin Erbakan University Meram Medical Faculty Radiology Department USG unit, from other medical units, for sonographic examination, between January 2014 and June 2016, were included in this prospective study. A total of 10 patients with chronic hepatic disease and lesion size less than 1 cm, comprising 7 males and 3 females, were excluded from the study. Therefore, 105 patients, comprising 48 males and 57 females, underwent SWE examination. The mean age of the patients was 53.31 ± 1.59 (age range 5-87) years. The distribution of the lesions is shown in Table 1. Metastases were from a single type of primary and were mostly colonic, gastric, and pancreatic types. Three patients with hepatocellular cancer (HCC) had cirrhosis. Imaging methods such as USG, computed tomography, and MRI were used to diagnose FLLs. Ancillary imaging methods were the gold standard for the lesions deemed benign. A USG-guided percutaneous biopsy was performed for the diagnosis of malignant lesions. The average time interval was 2-3 weeks between SWE and biopsy in the malignant lesions. Pathological specimens were evaluated by a pathologist who had at least 10 years of experience in liver diseases. Approval was obtained from the Necmettin Erbakan University Meram Medical Faculty Ethics Committee for this prospective study. All the patients included in the study were asked to sign an informed consent form.
Imaging protocols and shear wave elastography technique
B-mode USG and SWE were performed in supine and lateral decubitus positions by a single radiologist (SK) who had 11 years of conventional USG and 4 years of elastography experience. The radiologist was blinded to the suspected diagnosis and ancillary diagnostic evaluation. A Philips iU22 USG ultrasound machine (Philips Healthcare, Andover, MA, USA) and Philips C5-1 2.5 MHz convex probe transducer suitable for SWE examination were used for the procedure.
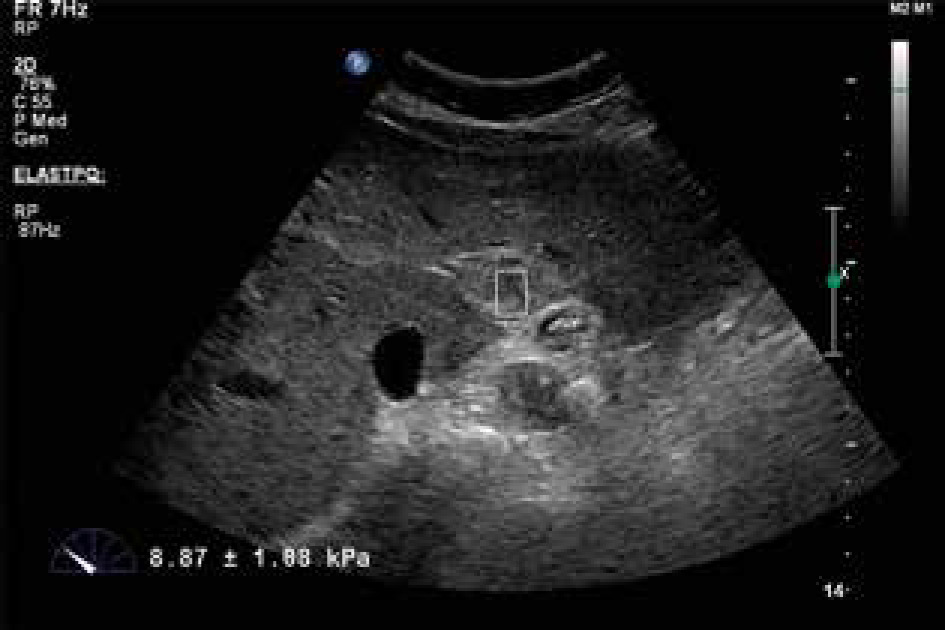
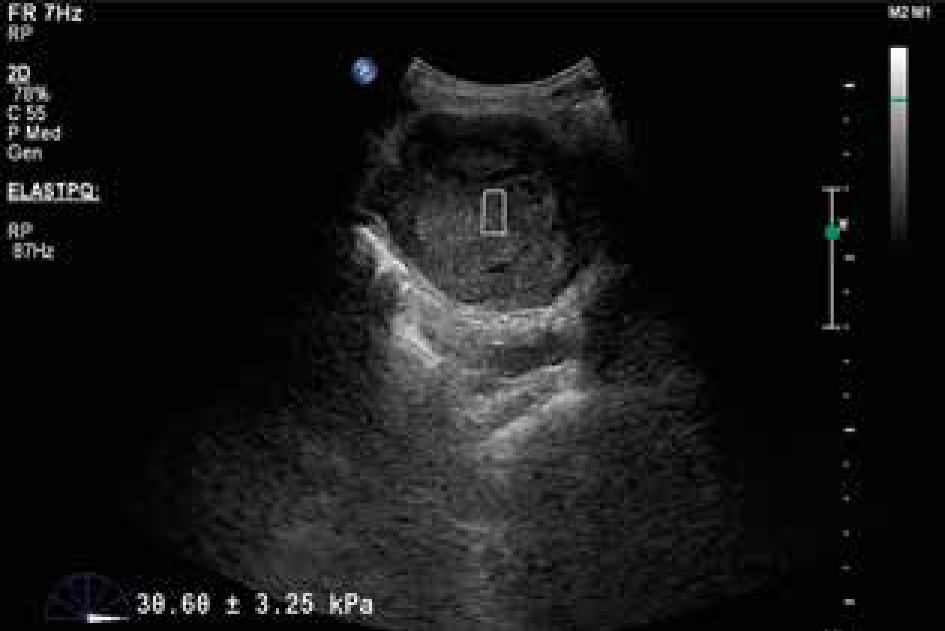
Throughout the entire examination the patients were allowed to hold their breath after it had been inspired as deeply as possible. The B-mode examination revealed the target lesion in the liver. The size and depth of the target lesion were determined. Lesions that were less than 2 cm and more than 8 cm in in depth were not included in the study. The SWE operation was performed with the same probe. In this method, called the elastoPQ technique, manual compression was not applied to the probe during the procedure. Measurements were obtained from a box that was approximately 0.5 × 1 cm wide on the screen. With this method, shear waves were sent to the tissue through a convex probe using a special pulse sequence technique, and the distribution rate of these waves in the tissue was measured. Measurements were given by the device in kPa and m/s. During the SWE, 2 measurements were taken from different points of liver masses and averaged, and 2 measurements were made from the liver parenchyma and averaged. SWE values taken from the liver parenchyma were in an area free of large vessels and more than 2 cm away from the liver lesion. The mass/parenchyma ratio was also evaluated. Moreover, according to the standard deviation value calculated automatically by the device in each measurement, those with a standard deviation value below 5 kPa were classified as homogeneous, and those above 5 kPa were classified as non-radially or radially heterogeneous. The radial character was established on the aspect of convergence towards the centre of the lesion, of the lines of maximum stiffness. An attempt was made to take the measurements from solid areas as often as possible. Cystic and calcific areas were not measured. All the measurements for each patient were obtained at the same depth. This depth was determined according to the central part of the mass, and the normal parenchymal measurement was obtained at the same depth.
Statistical analysis
Statistical analyses were performed using IBM SPSS Statistics for Windows 25.0 (IBM Corp., Armonk, NY, USA). Numerical variables were expressed as the mean ± standard deviation or number (percentage) according to the suitability status. The suitability of the normal distribution variables was examined with visual (histogram and probability graphs) and analytical methods (Kolmogorov-Smirnov and Shapiro-Wilk tests).
Descriptive analyses were given using the mean and standard deviations for normally distributed variables. Because the lesion depth and parenchymal SWE values in m/s were determined to show normal distribution, these parameters were compared between the gender, lesion character, and pathology using Student’s t-test.
Because age, lesion size, mass SWE values in kPa and m/s, and parenchymal SWE values in kPa did not show normal distribution, the Mann-Whitney U test was used between these parameters, gender, lesion character, and pathology.
The c2 test was performed to determine whether there was a statistical significance between the gender, lesion character, and pathological subtypes.
One-way ANOVA was performed to determine whether there was a significant relationship between lesion depth and mass type.
The Kruskal-Wallis test was used to determine whether there was a significant relationship between age, lesion size, mass SWE values in kPa and m/s, and parenchymal SWE values in kPa and mass type.
Binary comparisons were made using the Mann-Whitney U test and evaluated using Bonferroni correction.
Correlation coefficients and statistical significance were calculated using the Spearman test for variables where at least one was not normally distributed or ordinal. For statistical significance, the total type-1 error level was taken as 5%. P < 0.05 was considered statistically significant.
Receiver operating characteristic (ROC) curve analysis was performed to determine the diagnostic SWE values in the differentiation of cavernous haemangioma (CH), metastasis, HCC, cholangiocellular cancer (CCC), and benign and malignant lesions. The sensitivity, specificity, positive predictive, and negative predictive values of these limits were calculated in the presence of significant limit values. In evaluating the area under the ROC curve (AUC), cases with a type 1 error level below 5% were interpreted as having a statistically significant diagnostic value of the test.
Results
Descriptive information according to the SWE values in the lesion diameter, kPa, and m/s is shown in Table 2.
Table 2
Descriptive information
| n | Minimum | Maximum | Mean | Standard deviation | |
|---|---|---|---|---|---|
| Size | 105 | 18 | 159 | 60.27 | 32.179 |
| Mass kPa | 105 | 1.30 | 52.20 | 11.6695 | 8.55407 |
| Mass m/s | 105 | 0.66 | 4.16 | 1.8753 | 0.68361 |
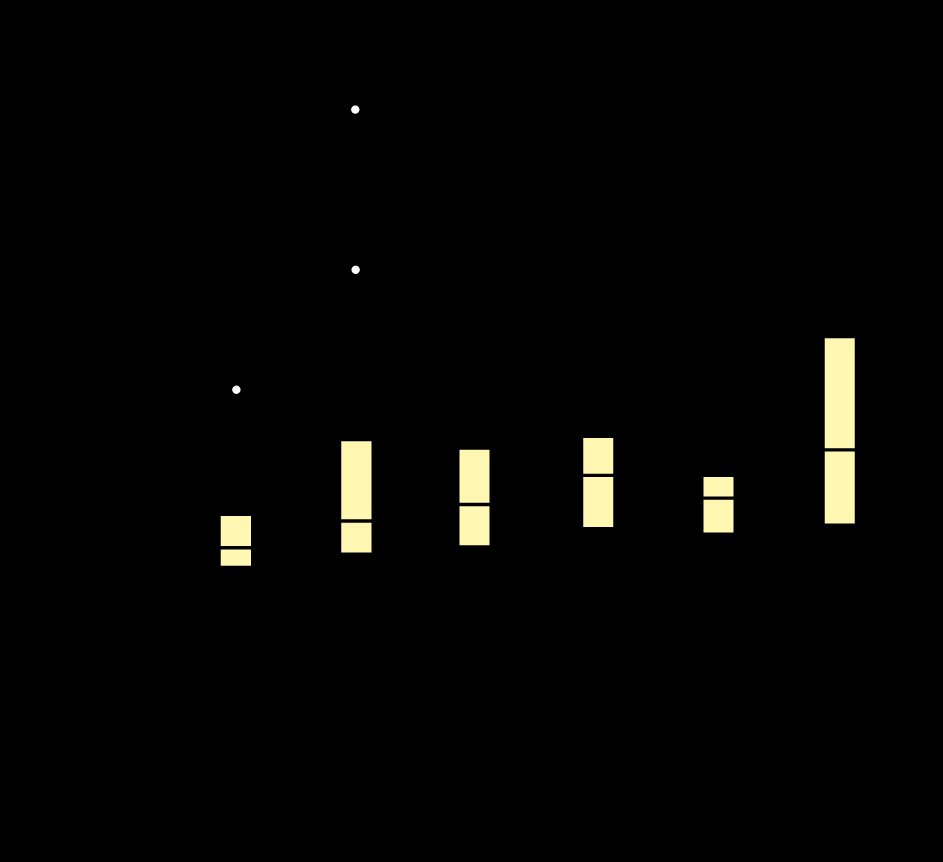
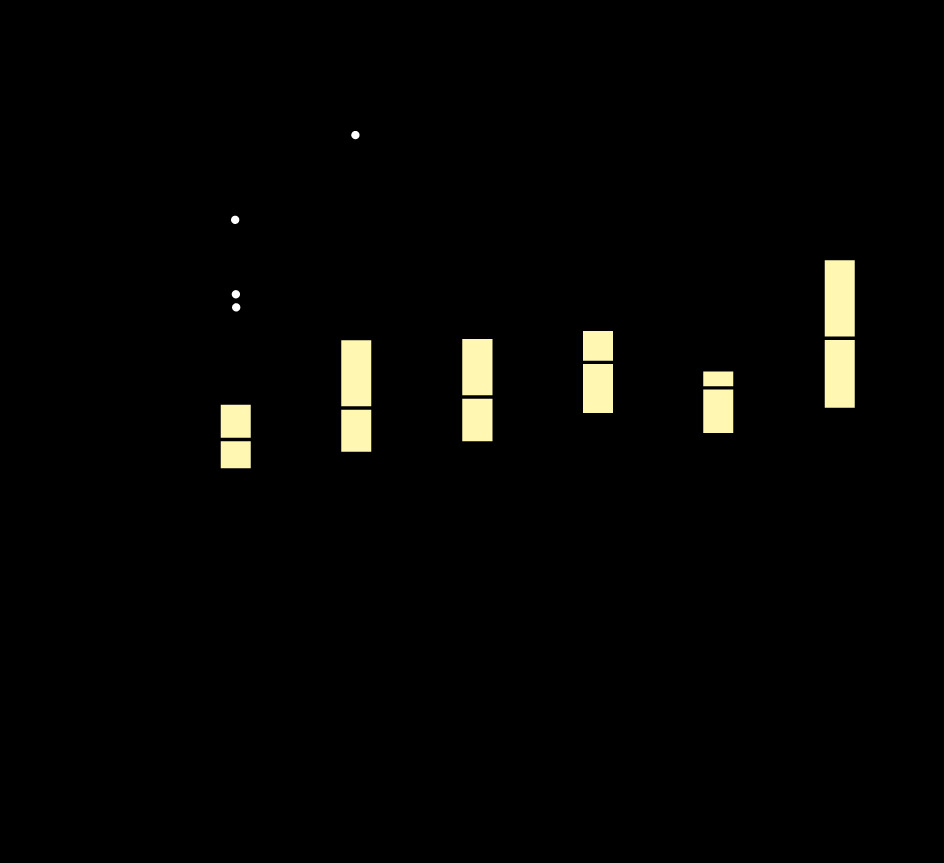
Table 3 shows the masses and mean elasticity values. It can be seen that in the normal parenchymal area measurements, the mean elasticity values were 5.92 ± 3.99 kPa and 1.36 ± 0.53 m/s. The upper, lower, and average elasticity values of the masses are shown in Figures 1 and 2.
Table 3
Mean elasticity values of the lesions in kPa
| Group | n | Mean + SD (kPa) |
|---|---|---|
| Haemangioma | 41 | 8.17 ± 5.99 |
| HCC | 13 | 13.78 ± 6.54 |
| Metastasis | 31 | 13.18 ± 10.71 |
| CCC | 10 | 17.82 ± 9.53 |
| FNH | 6 | 12.57 ± 6.53 |
| Adenoma | 4 | 11.10 ± 4.74 |
In the Mann-Whitney U test, the mass SWE values were significantly higher in heterogeneous lesions than in homogeneous lesions, in kPa (p < 0.001) and m/s (p < 0.001). The mass size was significantly higher in malignant lesions than in benign lesions (p = 0.034). SWE values in kPa and m/s in malignant lesions were significantly higher than in benign lesions (p = 0.006, p = 0.011) (Figures 3 and 4). Patient age was significantly higher in those who had malignant lesions than in those who had benign lesions (p = 0.01). For HCC, the lesion size (p = 0.006) and mass SWE values in kPa (p = 0.007) were significantly higher than those for CH. Mass SWE values in kPa for CCC (p = 0.003) were significantly higher than those for CH.
In the Kruskal-Wallis test, age (p = 0.01) was significantly higher in patients with metastases than for other mass types. The lesion size for CCC (p = 0.018) was found to be significantly higher than other mass types. Age (p = 0.002) was found to be significantly higher in patients with metastasis subtypes when compared to those with CH. SWE values in kPa (p = 0.007) and m/s (p = 0.02) for CCC were significantly higher than for other lesions.
In the Spearman correlation test, a low positive correlation (p = 0.269) was found between lesion size and lesion depth, and a perfect positive correlation (p = 0.963) was found between the SWE values in kPa and m/s.
In the ROC curve analysis, the cut-off value was calculated as 9.005 kPa in the differentiation of malignant lesions from benign lesions. The AUC was calculated as 0.656 in the range 0.551-0.761 with 95% reliability. Sensitivity was calculated as 64.2%, specificity as 61.5%, positive predictive value as 63%, and negative predictive value as 62.7% (Figure 5).

Discussion
Today, elastography techniques are widely used in noninvasive evaluation of the mechanical properties of tissues due to their ease of access and safety, and appropriate cost [10]. There are several different ultrasonographic elastography techniques that differ according to the physical characteristics used [11]. SWE is a new noninvasive quantitative method that determines tissue elasticity by measuring the SW spread to soft tissues [12].
The aim of this study was to investigate whether SWE examination, which has recently been proposed as an accessory radiological examination technique, is effective in characterizing FLLs.
There are few studies in the literature that have evaluated the elasticity of liver focal solid lesions.
In the study of Guibal et al., published in 2012, measurements were made using SWE from 161 lesions in 108 patients. The distribution of these lesions comprised 53 metastases, 26 HCC, 16 focal nodular hyperplasia (FNH), 10 adenomas, 7 clear cell adenocarcinoma (CCA), and 3 focal fatty areas. In this study, important clues were obtained in the characterization of some lesion groups. As an example, a statistically significant difference was found in detecting HCC and CCC lesions that were difficult to distinguish from each other (p = 0.0004). Moreover, a significant difference was found between the elasticity values of FNH, and haemangioma (p = 0.0002) and adenomas (p < 0.0001) [13].
In the current study, due to insufficient statistical competence in terms of lesion groups other than haemangioma, HCC, CCC, and metastasis, the evaluation was performed mostly on the elasticity differences between HCC-metastasishaemangioma-CCC lesions.
In the study conducted by Guibal et al., the mean elasticity values of HCC and metastasis were 14.86 ± 10 and 28.8 ± 16 kPa, respectively. In the present study, the mean elasticity values of HCC and metastasis were 13.78 ± 6.54 and 13.18 ± 10.71 kPa, respectively, and they were partially close [13]. In the study conducted by Choong et al., the mean elasticity values of HCC and metastasis were 51.45 ± 14.96 and 49.89 ± 13.82 kPa, respectively, and they stood out as significantly high values, unlike the current study [14].
Guibal et al. reported 13.8 ± 5.5 kPa as the mean elasticity values of haemangiomas and showed a slight increase when compared to normal parenchymal values [13]. Cho et al. [15], Heide et al. [16], and Davies and Koenen [17] revealed similar findings in their studies. In the current study, this value was found to be 8.64 ± 1.13 and 1.67 ± 0.1 in m/s, and it was found to be correlated with other mentioned studies. Unlike the study of Davies and Koenen [17], patient age was found to be significantly higher in those with metastasis subtypes when compared to those with haemangiomas (p = 0.002) [17]. Similarly to the study of Cho et al., in the present study, the mass SWE values for HCC and CCA in kPa were found to be significantly higher than those for haemangiomas (p = 0.007). Unlike the study of Cho et al., the lesion size of HCC was found to be significantly higher than that of haemangiomas (p = 0.006) [15].
Choong et al. compared the values of HCC and meta-stases in kPa in their study and stated that there was no significant difference between them. Similar results were reported in the study of Guibal et al. and in the current study [13,14].
Guibal et al. found that 38% (10) of the HCC lesions and 86.8% (46) of the metastasis lesions were heterogeneous [13]. Choong et al. determined these rates as 27.8% (13) and 40% (4), respectively [14]. In the current study, it was observed that 15% (2) of the HCC lesions and 35% (11) of the metastasis lesions were heterogeneous. Hence, the number of heterogeneous cases was less than that in the 2 studies mentioned above. This suggests that the current study results were more reliable than those in the study of Guibal and Choong [13,14]. The differences between all 3 studies are thought to be due to the fact that the primers of the metastatic lesions did not distribute homogeneously, and that they may have been at different stages of their treatment, in addition to their numerical differences.
Due to the frequent development of HCC based on cirrhosis, in the current study, in some of the lesions (3 of 13 HCC, approximately 23%), contrary to expectations, the measured kPa value was lower than the parenchyma values. In this respect, Fahey et al. [18] and Gallotti et al. [19] stated that the kPa values of the majority of the HCC lesions that they measured were lower than the parenchyma values. In the study of Cho et al., the kPa values were found to be lower than the parenchymal values in only 24% of the HCC lesions [15]. The reason for this was thought to be that the amount of cirrhosis that the HCC lesions develop on the basis and the spatial heterogeneity of the lesions within themselves were different.
In the ROC curve analysis, the cut-off value was taken as 9.005 kPa in the differentiation of malignant lesions from benign lesions, while it was taken as 20.7 kPa in the study of Gerber et al. The specificity, sensitivity, and positive predictive and negative predictive values were similar. Unlike in the study of Gerber et al., the mass SWE values for HCC and CCC in kPa were significantly higher than those for haemangiomas (p = 0.007). Similarly to the study herein, Gerber et al. found significantly higher SWE values for CCC in kPa than for other lesions (p = 0.033-0.0079) [20]. Guibal et al. found a significant difference in the differentiation of benign and malignant lesions in terms of mean elasticity values [13]. This situation was similar in our study. However, according to ROC curve analysis with the cut-off value calculated as 6 kPa, the sensitivity, specificity, and positive and negative predictive values were calculated as 70.9%, 30.0%, 58.2%, and 42.9%, respectively, in the differentiation of malignant and benign lesions. This reinforced the opinion that the use of SWE is appropriate to provide important auxiliary clues during the diagnosis of lesions by cross-sectional methods rather than primary diagnosis.
In the study of Grgurevic et al., similarly to the study herein, the SWE values in kPa were significantly higher for malignant lesions than for benign lesions (p < 0.001). Differently and significantly higher than the current study, the cut-off value in the differentiation of malignant lesions from benign lesions in the ROC curve analysis was calculated as 23.2 kPa [21]. In a study by Park et al., similarly to the current study, the SWE values in kPa were significantly higher for malignant lesions than for benign lesions (p < 0.0001). Unlike in the present study, Park et al. found a significantly higher cut-off value of 30.8 kPa in the ROC curve analysis in the differentiation of malignant lesions from benign lesions [22].
In a study by Hasab-Allah et al., similarly to the study herein, patient age was found to be significantly higher in those with malignant lesions than in those with benign lesions (p < 0.001). Similarly to the current study, the lesion size was significantly larger for HCC than for haemangiomas (p = 0.02). Unlike in the present study, there was no significant difference in the SWE values in kPA between the lesion types (p > 0.05) [23].
Unlike the current study, Ronot et al. found no significant difference between the SWE values in kPa for malignant and benign lesions (p = 0.64) [24].
In a study by Tian et al., similarly to the study herein, the SWE values in kPa were significantly higher for malignant lesions than for benign lesions (p < 0.001). Similarly to the current study, the mean SWE values for haemangiomas were lower than for other lesions [25]. In a study by Zhang et al., similarly to the study herein, the SWE values in kPa were significantly higher for malignant lesions than for benign lesions (p < 0.01) [26].
In the present study, unlike other studies, the m/s values were measured together with the kPa values as a feature of the USG device used, and it was seen that there was a perfect positive correlation between them according to the Spearman correlation test.
There were some limitations to this study. First, an inadequate number of mass types, such as FNH, adenoma, non-cirrhotic HCC, and CCC can be considered the main limitation of the study. This reduced the likelihood of creating a reliable cut-off value in the differentiation between benign and malignant lesions and making a healthy distinction between other types of masses. Studies with a sufficient number of homogeneously distributed patient groups will give more significant results about the reliability of the technique. The second limitation of the study was that the diagnosis of benign FLLs was not confirmed by USG-guided percutaneous biopsy. Apart from this, one of the main limitations of our study is the difficulty in reaching a sufficient level of AUC value in the ROC analysis for the differentiation of benign and malignant liver lesions. This reveals that the SWE procedure can only be an accessory radiological modality in the differentiation of benign and malignant liver lesions.
Conclusions
With the increasing use of the SWE elastography in recent years, it stands out as an accessory radiological method that can help distinguish benign and malignant lesions from each other and, especially, HCC and CCC from other lesions. The findings of both the studies in the literature and the study herein showed that the SWE method can contribute to the primary diagnosis of lesions at this stage as an accessory radiological examination. However, in addition to providing little contribution in the differentiation of some benign and malignant lesions, it is thought to contribute, to a certain extent, during the diagnosis with cross-sectional methods, especially in suspected cases. In this way, it can be hoped that the diagnosis of FLLs with invasive methods may be reduced to a certain extent.