Introduction
Multiple sclerosis (MS) is a chronic disease of the central nervous system (CNS), manifested by multiple foci of demyelination, leading to abnormalities in nerve conduction, and resulting in neurological impairment. MS is the most common non-traumatic cause of motor disability in young adults. Hence, it is important to search for effective neuroprotective strategies that could support conventional drug therapy, aiming at inhibition of the inflammatory process and thereby slowing the progression of the disease.
Exercise rehabilitation, including aerobic training, is a form of therapy that positively impacts neurobiological processes of the brain, especially on motor and cognitive abilities. There are numerous scientific reports of beneficial effects of aerobic training on improving muscle strength and functional capacity in patients with various diseases, including MS [1-6]. Dynamic development of diagnostic imaging methods, with functional magnetic resonance imaging (fMRI), allows not only for structural assessment of the CNS, but also facilitates insight into the functioning of cortical areas.
Thus, it became possible to investigate whether the performed rehabilitation procedures affect the processes of plasticity of the CNS and to what extent. Such knowledge has great clinical potential because it would indicate the most effective methods and rehabilitation programmes, which is particularly important for MS patients with an extremely wide variety of disease stages and courses. Unfortunately, there is a deep lack of research in this field; reports in the literature are few, and as far as we know, reports on joining different fMRI techniques are not present at all [7,8]. Hence, the aim of this study was to evaluate the effects of aerobic training on motor cortical areas in MS patients, based on findings of a task-based fMRI (t-fMRI) as well as resting-state fMRI (rs-fMRI).
Material and methods
Patients
Twenty-nine MS patients (MS diagnosis on the base of the 2010 modified McDonald criteria) were enrolled in the study. The patients were randomly included into one of 2 groups:
the MS study group, which consisted of 15 MS patients who were subjected to a 4-week physical rehabilitation programme; the mean age of the patients was 43 years (the age range was 29-55 years); one patient resigned from the study during the study period due to personal reasons; therefore, the final analysis included 14 patients (6 men, 8 women);
the MS control group, which consisted of 14 MS patients who had not received any physical rehabilitation; the mean age of the patients at the time of the study was 38 years (the patient age range was 32-52 years); all the patients (5 men, 9 women) completed the planned study protocol.
Multiple sclerosis patients enrolled in the study were treated with immunomodulatory drugs (Avonex, Betaferon, Copaxone, Rebif, Extavia), and there were no MS relapses within 30 days prior to inclusion in the study or during the study period. Also, they did not show cognitive impairment that could have prevented command comprehension.
Methods
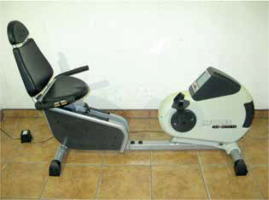
The aerobic training to which the patients in the MS study group were subjected involved exercising on a Kettler SX1 horizontal cycle ergometer (Figure 1) for 15 min twice a day for a total period of 4 weeks (6 days a week). The patients were instructed to exercise at a pace that would allow them to freely utter short sentences, thus keeping their heart rate at around 55-80% of their maximum heart rate.
In all MS patients, the degree of motor disability was assessed by a neurologist using the Expanded Disability Status Scale (EDSS) scale. All MS patients were clinically evaluated and underwent MRI examinations twice. The MS study group patients were evaluated at the time of inclusion in the study and after completion of a 4-week motor rehabilitation programme, whereas the MS control group patients were evaluated at the time of inclusion in the study and after a period of 4 weeks without physical activity.
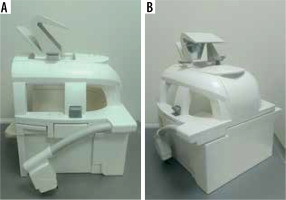
Brain MRI examinations were performed using a 1.5T Siemens Avanto Tim scanner. A head-neck coil was used to perform the examinations, to which a set of mirrors was attached to allow the displayed images to be observed on the monitor (Figure 2). To minimise motion artefacts that increased during the course of the examination, image acquisition was first performed using the T1-weighted sequence (TR = 1160 ms, TE = 2.54 ms, slice thickness 0.9 mm, 192 slices, FOV 241). Subsequently, t-fMRI (TR = 3000 ms, TE = 50 ms, slice thickness 3 mm, 38 slices, FOV 192 ) and rs-fMRI (TR = 2500 ms, TE = 50 ms, slice thickness 3.5 mm, 32 slices, FOV 192) sequences were performed to assess the activity of the CNS.
All patients and participants were right-handed. In order to assess the activation of motor cortical areas, a t-fMRI sequence was performed, thereby evaluating primary motor cortex (M1), premotor area (PMA), and supplementary motor area (SMA). The applied SynchroBox tool allowed synchronisation of the t-fMRI scheme with the MRI scanner and displaying of images on the monitor screen in real time. The study was conducted using a block-design, consisting of consecutive 30-second task and control stages (Figure 3).
During the task stage, a picture of the hand was displayed on the monitor screen. Throughout the display of the image, MS patients were asked to perform alternately flexion and extension movement of the fingers of the hand. Due to different degrees of clinical disability, the patients were not asked to perform a particular number of movements within a designated period of time. Prior to the commencement of the t-fMRI study, the patients were instructed to try to make smooth movements as frequently as possible. However, the movements should not cause any discomfort. Another important element was elimination of mirror movements, i.e. involuntary movements performed by the opposite hand, which could have distorted the obtained results. In order to avoid such movements, all subjects were asked, throughout the t-fMRI sequence, to hold an “alarm device” in the resting hand. Pressing the device would mean the presence of mirror movements; however, this did not occur in any of the tested patients. During the control phase, no images were displayed on the monitor screen and the subjects were asked to remain motionless with their arms along their torso. An rs-fMRI sequence was then performed to assess the brain activity at rest. During this sequence, the monitor screen was turned off and the subjects had their eyes closed, which made them fully isolated from external stimuli. They were all instructed to remain awake (conscious) and not to focus on any task during this sequence.
The t-fMRI data were analysed using SPM12 software. Three regions of interest (ROI) within the motor cortex: M1, PMA, and SMA were taken into the BOLD signal analysis. Each region of interest was analysed by defining a sphere with a radius of 8 mm within it, the central part of which was the point with the highest excitation, the so-called local maximum. Within these spheres, the mean values of the intensity of activity, defined as peak levels, were determined. Besides, the number of excited voxels within the clusters, referred to as the cluster level, was determined.
For rs-fMRI data, the following analysis was used: non-parametric statistics (cluster – level inferences, threshold free cluster enhancement), connection threshold p < 0.05, p-FWE corrected (TFCE) as well as the software: CONN toolbox (version 19b) and SPM12. The studies were exposed to 4 complex stages of analysis: defining the parameters of the whole project; “data noise reduction”, which in practice meant a qualitative analysis of the images received; individual analysis consisting of seed-to-voxel analysis, i.e. correlation analysis between the signal averaged from the selected region – seed – and all voxels from grey matter; and ROI-to-ROI. The fourth step involved a group analysis.
For quantitative data (cluster level, peak level, EDSS scale) the Shapiro-Wilk test was used to determine the normality of the distribution. Depending on whether the data were of a normal distribution, appropriate parametric or non-parametric tests were used. The hypotheses were verified using Kruskal-Wallis, post hoc Dunn’s, Mann-Whitney, Wilcoxon, or t-test, and qualitative variables were verified using the Fisher test. In all analyses, the test value p < 0.05 was considered significant.
Results
Clinical assessment
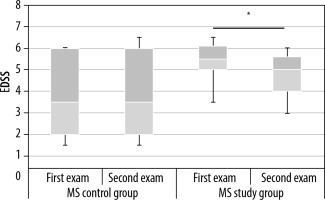
The aerobic training contributed to clinical improvement in the MS study group. The mean EDSS value in examination 1 was 5.4, and it was 4.75 in examination 2. Patients in the MS control group did not demonstrate statistically significant differences in disability between the measurements (Figure 4).
t-fMRI studies
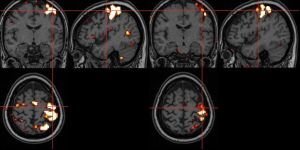
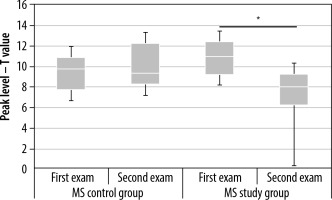
In the MS study group, the applied aerobic training significantly decreased the cluster level and the peak level in the contralateral primary cortex (Tables 1 and 2, Figure 5). Statistically significant results are marked with an asterisk in the graphs (Figures 6 and 7). In the MS control group, no statistically significant differences were observed between examinations 1 and 2.
Table 1
Selected values of descriptive statistics for the cluster level obtained for the contralateral primary cortex in the multiple sclerosis (MS) control and MS study groups in examinations 1 and 2
| MS control group | MS study group | |||
|---|---|---|---|---|
| First exam | Second exam | First exam | Second exam | |
| Mean | 71.07 | 59.07 | 72.42 | 38.35 |
| Median | 79.50 | 5.00 | 77.50 | 32.50 |
| Maximal value | 108.00 | 118.00 | 123.00 | 94.00 |
| Minimal value | 4.00 | 5.00 | 13.00 | 0.00 |
Table 2
Selected values of descriptive statistics for peak level values obtained for the contralateral primary cortex in the multiple sclerosis (MS) control and MS study groups in examinations 1 and 2
| MS control group | MS study group | |||
|---|---|---|---|---|
| First exam | Second exam | First exam | Second exam | |
| Mean | 9.02 | 10.14 | 10.89 | 7.64 |
| Median | 9.77 | 9.32 | 10.99 | 8.08 |
| Maximal value | 15.56 | 15.26 | 14.93 | 11.34 |
| Minimal value | 6.33 | 5.57 | 6.35 | 0.00 |
Figure 5
Task-based functional magnetic resonance imaging (t-fMRI) image of a patient in the multiple sclerosis (MS) study group – before and after aerobic rehabilitation
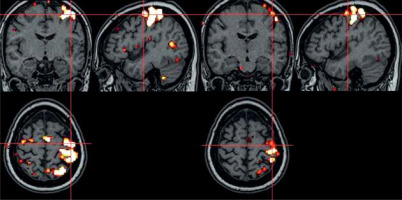
Figure 6
Changes in cluster level values in the contralateral primary cortex in the multiple sclerosis (MS) control and MS study groups between examinations 1 and 2. Statistically significant results are marked with an asterisk (p < 0.05)
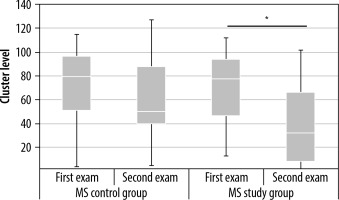
Figure 7
Changes in peak level values in the contralateral primary cortex in the multiple sclerosis (MS) control and MS study groups between examinations 1 and 2. Statistically significant results are marked with an asterisk (p < 0.05)
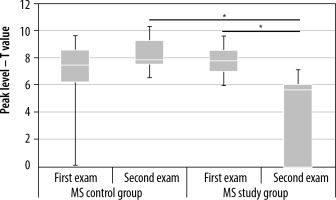
In the MS study group, a similar decrease in cluster level values and peak level values was observed in the contralateral premotor cortex (Figures 8 and 9, Tables 3 and 4). In the MS control group, there were no significant differences in cluster level and peak level values between examinations 1 and 2.
Table 3
Selected values of descriptive statistics for cluster level values in the contralateral premotor cortex in examinations 1 and 2 in the multiple sclerosis (MS) control and MS study groups
| MS control group | MS study group | |||
|---|---|---|---|---|
| First exam | Second exam | First exam | Second exam | |
| Mean | 28.36 | 31.93 | 41.64 | 9.50 |
| Median | 26.50 | 27.50 | 34.00 | 7.00 |
| Maximal value | 82.00 | 94.00 | 101.00 | 36.00 |
| Minimal value | 0.00 | 17.00 | 17.00 | 0.00 |
Table 4
Selected values of descriptive statistics for peak level values in the contralateral premotor cortex in both examinations 1 and 2 in the multiple sclerosis (MS) control and MS study groups
| MS control group | MS study group | |||
|---|---|---|---|---|
| First exam | Second exam | First exam | Second exam | |
| Mean | 6.83 | 7.93 | 7.70 | 4.00 |
| Median | 74.50 | 7.83 | 7.77 | 5.62 |
| Maximal value | 11.97 | 14.59 | 9.28 | 7.40 |
| Minimal value | 0.00 | 0.00 | 6.03 | 0.00 |
Figure 8
Changes in cluster level values in the contralateral premotor cortex between examinations 1 and 2 in the multiple sclerosis (MS) control and MS study groups. Statistically significant results are marked with an asterisk (p < 0.05)
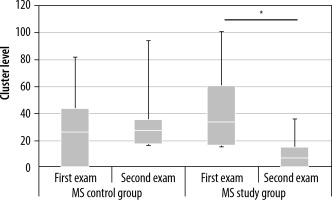
Figure 9
Changes in peak level values in the contralateral premotor cortex in the multiple sclerosis (MS) control and MS study groups between examinations 1 and 2. Statistically significant results are marked with an asterisk (p < 0.05)
In the MS study group, in examination 1, activations in the contralateral SMA cortex were observed in half of the patients (7 out of 14 subjects), whereas in examination 2, activation in the contralateral supplementary area was detected in only one patient (representing 7% of the study group), which implies that the applied aerobic training reduced the frequency of activations in the contralateral SMA in examination 2 in this group of patients.
Due to activations observed in just a portion of study subjects, only a qualitative analysis was performed. Values of peak and cluster parameters were not analysed.
rs-fMRI studies
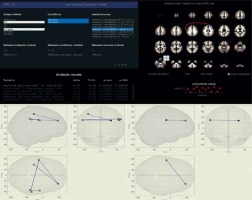
In examination 2 (after rehabilitation), a significant decrease in the functional correlation was observed in the MS study group for lateral sensorimotor network (SensoriMotor.Lateral l) and salience network in rostral prefrontal cortex (Salience.RPFC r) as well as supramarginal gyrus (Salience.SMG r). Similar changes between examinations 1 and 2 were not observed in the MS control group.
A detailed description of the values and a graphical representation of correlations observed in the MS study group is presented below (Table 5, Figure 10).
Table 5
Change in the functional correlation within the resting state network in the MS study group between examinations 1 and 2. Negative t-values indicate reverse contrast, i.e. pre > post, whereas positive values indicate post > pre
Discussion
Clinical assessment
Motor rehabilitation in MS patients aims to increase muscle strength and maintain a normal range of joint mobility. Aerobic training, i.e. physical exercise characterised by constant but low-impact muscular involvement, is a specific form of motor rehabilitation. Literature reports confirm that aerobic training not only teaches alternative strategies for motor behaviour but also increases production of brain-derived neurotrophic factor, playing a vital role in the regeneration and formation of new synaptic connections and neurons themselves [9-11]. Such a form of exercise rehabilitation improves muscle strength, overall fitness, and functional performance.
Our study proved positive clinical effects, which were observed in the MS study group. After a 4-week period of aerobic training, the EDSS scale score revealed that the patients’ motor disability decreased (the mean value in examination 1 = 5.4 vs. 4.75 in examination 2). This is very interesting considering the relatively short duration of performed exercises, as well as the degree of disability of patients in the intermediate degree. It is widely known that the abbilities for motor improvement are greater when there is lower degree of organic CNS damage, resulting in the absence or reduction of neurological deficits.
fMRI studies
It was particularly interesting to find out whether the observed positive changes in the clinical status of patients are also related to the functional reorganisation of the cortical centers. An analysis of data of the t-fMRI study revealed changes in the activation of cortical areas for movement induced by aerobic training. The training decreased activation within the contralateral primary and premotor cortex and reduced the frequency of activations within the contralateral supplementary area. However, some articles report spontaneous changes in the activity of motor cortical areas during the course of the disease, and not ones induced by any therapeutic intervention. A study conducted by Pantano et al. [12] provided such an observation. The authors revealed that a group of MS patients demonstrated a spontaneous decrease in activation of the ipsilateral sensorimotor cortex over a 20-month period. It is noteworthy that the observed decrease negatively correlated with the age of the patients and the number of acute relapses that occurred in the observation period. This means that patients with a more benign disease course can demonstrate a relative normalisation of the cortical activity in time. The 4-week observation time used in our study was too short to affect the results obtained; therefore, we can definitely exclude the effect of time on our findings.
Conclusions from literature reports, evaluating the effects of various forms of therapy – including exercise rehabilitation – on the activity of cortical areas in MS patients and healthy individuals, are often ambiguous. Wexler et al. [13] in their study revealed that short-term motor rehabilitation, aiming at improvement of thumb flexion movement, reduced activation in the contralateral primary and secondary motor cortex only in the group of healthy volunteers. The authors did not note similar effects in patients with MS. Tomassini et al. [14] made a different observation. The researchers confirmed that a 15-day visual-motor training significantly reduced cortical activation in MS patients in comparison to healthy volunteers.
The reduced activation and lower frequency of activations in the contralateral motor cortex observed in patients from the MS group in our study could be considered as a beneficial effect of the applied motor rehabilitation, and it might imply that fewer areas need to be engaged in order to properly perform the same motor task. However, further analyses are required to check whether the changes that were generated by aerobic training will stay longer and whether spontaneous reorganisation within the motor areas will be observed in the long term.
To the best of our knowledge, this is the first study in which 2 functional MRI techniques were used together to assess the effect of rehabilitation in MS patients [7,8]. We decided to use both methods to increase the reliability of observations in a relatively small and heterogeneous group of MS patients. Also, an analysis of rs-fMRI data revealed changes in functional connectivity within RSN. Patients from the MS study group demonstrated decreased functional correlation between the sensorimotor network and the salience network in examination 2 when compared to examination 1. Such differences were not observed in the MS control group.
The sensorimotor network was the first resting state network identified and analysed by Biswal. It includes primary and secondary sensorimotor cortex areas, located in both cerebral hemispheres, which are characterised by a high degree of functional connectivity [15-17]. These areas are involved, among other things, in motor automatism and intentional response to a stimulus. The salience network includes areas of the dorsal anterior cingulate cortex, the anterior insula, rostral prefrontal cortex, and supramarginal gyrus. The network is responsible for functioning of other networks. Among other things, it is involved in drawing attention to the relevant issue by reinforcing or suppressing incoming stimuli and modulating responses to them. Furthermore, the salience network participates in initiating an adequate motor response to signals received from the inside and the outside of the body [18].
The reduced functional connectivity between SN and SMN presented in this study may result from improved motor automatism and the need to engage fewer neuronal connections to elicit a specific motor response. There are single studies showing the effect of an intervention on RSN, but none dealing with aerobic rehabilitation in MS patients, which prevents the possibility of comparing the results of this study with those of other researchers.
Limitations
The most important limitations of the study are its small sample size and data heterogeneity, although the use of 2 fMRI techniques allows greater reliability. In addition, no association of functional changes with structural alterations in the brain was performed.
Conclusions
Aerobic training improves physical performance, reduces activation in the contralateral motor cortex, and contributes to reorganisation within the resting-state networks in MS patients. This proves the significant potential for plasticity of the CNS - not only at the initial stage of development of the disease, but even at the more advanced level with the occurrence of organic brain damage. The wider use of fMRI would allow the development of optimal, more effective methods of both motor and cognitive rehabilitation, and even the introduction of individually selected programmes. This is possible taking into account the frequent follow-up MRI examinations in the MS group and the completely different data acquisition methods for t-fMRI and rs-fMRI, which could be used depending on the clinical status of the patients.


