Introduction
Gangrenous cholecystitis (GCh) is a complicated variant of acute cholecystitis due to progressive and profound vascular insufficiency, which results in necrosis and perforation of the gallbladder wall [1]. The mortality rate in GCh is higher, ranging between 15% and 50%. Due to this increased risk of mortality, these patients often require emergency cholecystectomy [2]. Thus, it is important for a radiologist to diagnose this entity and differentiate it from uncomplicated acute or chronic cholecystitis. Among the various imaging modalities available, ultrasound is the first modality of choice because it is a non-invasive, cost‐effective technique that does not involve radiation exposure or iodinated contrast administration [3]. However, computed tomography (CT) may be required in certain cases when the clinical presentation is atypical and suspicious of complication or diagnostic dilemma.
Various CT findings and signs of acute gangrenous cholecystitis have been described in previously published literature. Hyperdense gallbladder wall sign was described in acute gangrenous cholecystitis by Cheng et al. in 2004, who found this sign in 51% of their cases [4]. However, in a recently published series by Chang et al. [5] they did not find hyperdense wall sign to be a reliable predictor of gallbladder wall ischaemia. There is an overlap between various CT findings to differentiate gangrenous and non-gangrenous cholecystitis. To our knowledge, no prior study has been conducted to look both into CT Hounsfield units (HU) of gallbladder wall and intraluminal bile to predict gangrenous change in acute cholecystitis.
The purpose of the study was to review unenhanced CT scans of cases with histopathologically confirmed acute gangrenous cholecystitis and acute non-gangrenous cholecystitis. Our hypothesis was that the density (CT HU) of both gallbladder wall and bile increased in cases of acute gangrenous cholecystitis due to early ischaemia, mucosal necrosis, and haemorrhage within the wall and anaerobic bacteria proliferation, suppurative infection, and purulent material filling the gallbladder lumen [6]. To test our hypothesis, we reviewed the density of the gallbladder wall and intraluminal bile in cases of acute gangrenous and non-gangrenous cholecystitis.
Material and methods
Study population
We retrospectively reviewed the unenhanced CT scans of surgically proven cases of acute gangrenous and non-gangrenous cholecystitis that underwent imaging at our Institute between January 2017 to September 2019. Institutional review board approval was obtained as per our institution’s policy. The study population was divided into two groups – acute gangrenous and non-gangrenous cholecystitis. CT scans of 23 patients with acute cholecystitis, with pathologically proven acute gangrenous cholecystitis in 11 patients and surgically proven acute non-gangrenous cholecystitis in 12, were included in the study.
Computed tomography technique
CT abdomen was performed on a Siemens Somatom Definition Flash 2 × 128 Dual-source CT scanner (Siemens, Erlangen, Germany). Unenhanced CT examination of the patients was acquired using the following parameters (0.5 s rotation time, pitch value of 0.6, 0.75 mm section thickness, 3 mm reconstruction interval, 100-120 kVp with Care Dose reference mAs 290). Additional images were reconstructed with 0.5 mm reconstruction intervals for detailed interpretation.
Image interpretation
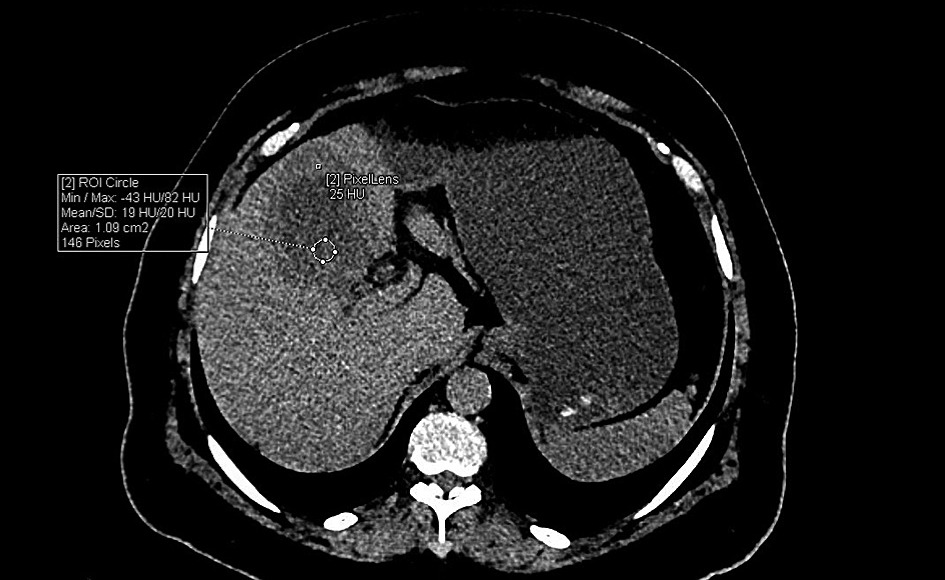
Unenhanced CT scans were reviewed by two radiologists with nine years (B.S.) and four years (S.J.) of experience in abdominal imaging. The HU value of the gallbladder wall and intraluminal bile was measured. Three readings were taken each for gallbladder wall (pixel-based) and intraluminal bile (based on surface area), and an average value was recorded (Figure 1). ROIs were kept away from the gallbladder stone after confirming on ultrasound.
Statistical analysis
Statistical analyses were performed with SPSS for Windows (version 22.0, SPSS, IBM Corp., Armonk, NY), and differences were considered significant when p < 0.05. Results were expressed as the median value for continuous variables, absolute frequencies, and percentage for categoric variables. If a variable was not normally distributed, we used the Mann-Whitney U test (Wilcoxon rank-sum test) to obtain the p-value. With histologic diagnosis as the reference standard, we calculated sensitivity, specificity for wall, lumen, and combined wall-lumen in the prediction of gangrenous cholecystitis.
Results
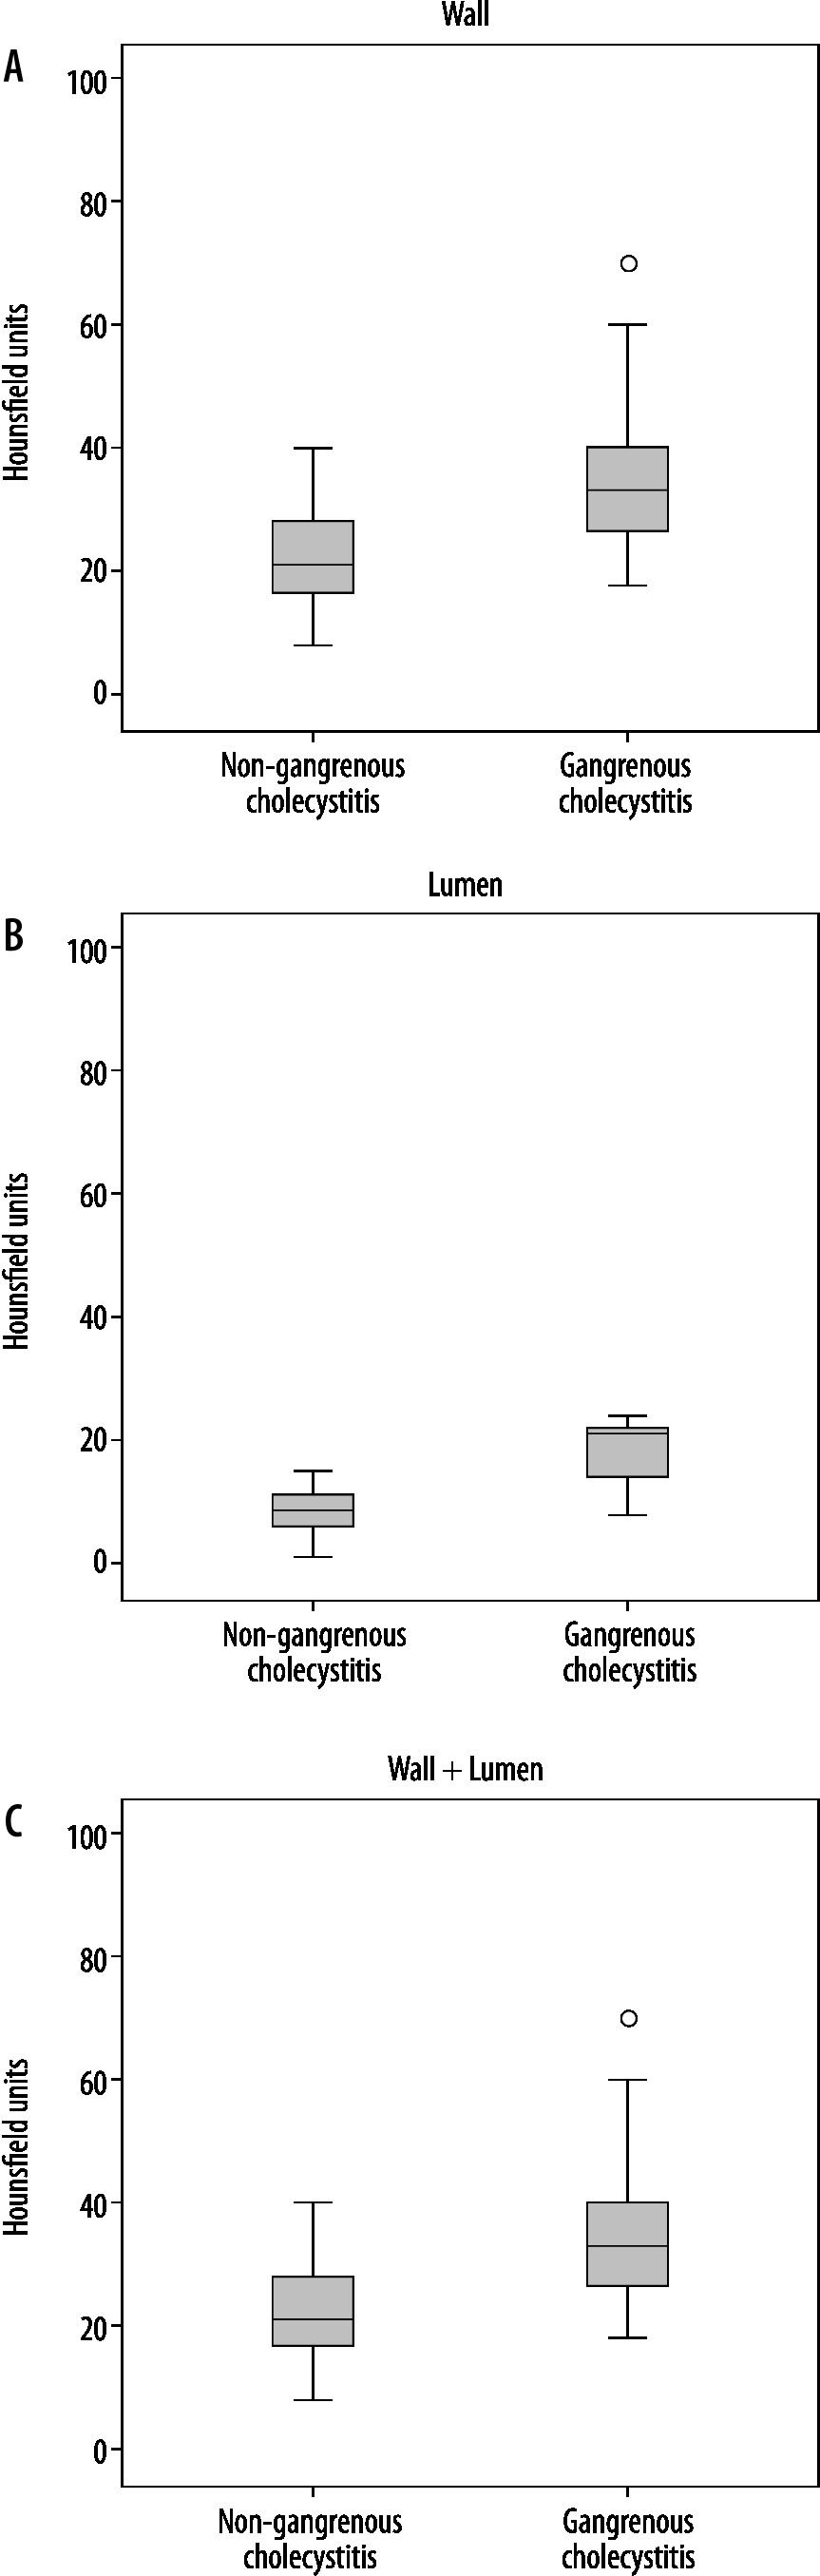
Table 1 shows the baseline demographics and CT values among the two groups. No significant age and gender preference was seen in the two groups. A total of 7/11 patients had diabetes in the gangrenous cholecystitis group. The median time interval between CT and surgery was six days in the group with gangrenous cholecystitis and 14 days in the non-gangrenous acute cholecystitis group. The unenhanced CT findings in the gallbladder for the two groups are also shown in Table 1. The HU value of the wall was higher in the gangrenous cholecystitis group (median value of 33 HU vs. median value of 21 HU in the non-gangrenous group; p = 0.013). The HU value of lumen was higher in the gangrenous cholecystitis group (median value of 21 HU vs. median value of 8 HU in the non-gangrenous group; p < 0.001) (Figures 2 and 3). The gangrenous cholecystitis group had significantly higher HU values of wall and bile than the non-gangrenous group.
Table 1
Patient demographics and computed tomography values in two groups
| Attributes | Non-gangrenous cholecystitis (nonGCh) | Gangrenous cholecystitis (GCh) | P-value | |
|---|---|---|---|---|
| Age, median (IQR) | 65.0 (22.5) | 67.0 (14.0) | 0.608a | |
| Gender, n (%) | ||||
| Female | 8 (47.1) | 9 (52.9) | 0.640b | |
| Male | 4 (66.7) | 2 (33.3) | ||
| CT HU wall, median (range) | 21.0 (8-40) | 33.0 (18-70) | 0.013a | |
| CT HU lumen, median (range) | 8.5 (1-15) | 21.0 (8-24) | < 0.001a | |
Figure 2
A) Axial non-contrast computed tomography scan of 63-year-old woman with pathologically proven gangrenous cholecystitis. Gallbladder is distended and shows high density striated wall (small arrows) and high attenuation intraluminal bile (large arrow). B) Axial non-contrast computed tomography scan of a 45-year-old woman with pathologically proven gangrenous cholecystitis. Gallbladder is distended and shows high-density thickened wall (small arrows), high-attenuation intraluminal bile (large arrow), and intraluminal membranes (arrowheads). C) Axial non-contrast computed tomography scan of a 66-year-old man with pathologically proven acute non-gangrenous cholecystitis. Gallbladder is partially distended and shows high-density thickened wall (small arrows) and high-attenuation intraluminal bile (large arrow). Note is also made of interstitial oedematous pancreatitis (arrowheads)
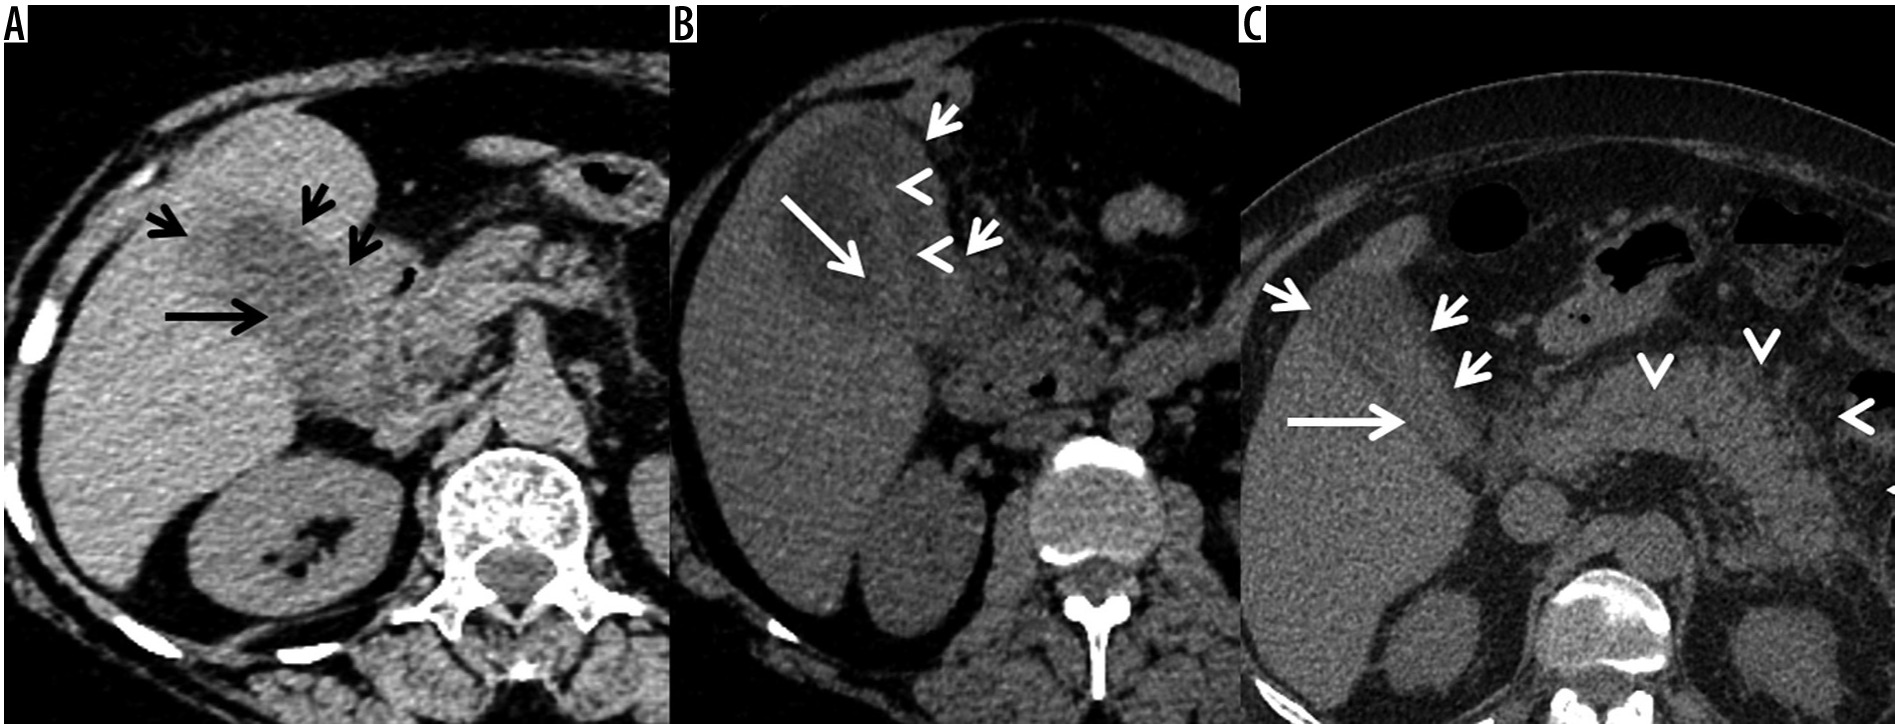
Figure 3
A) Box-and-whisker plots for the HU wall, B) HU lumen, and C) wall plus lumen of gangrenous and non-gangrenous cholecystitis. Centre horizontal line – median, bottom and top edges of box – 25th and 75th percentiles, vertical line – range of data
Diagnostic accuracy of unenhanced computed tomography
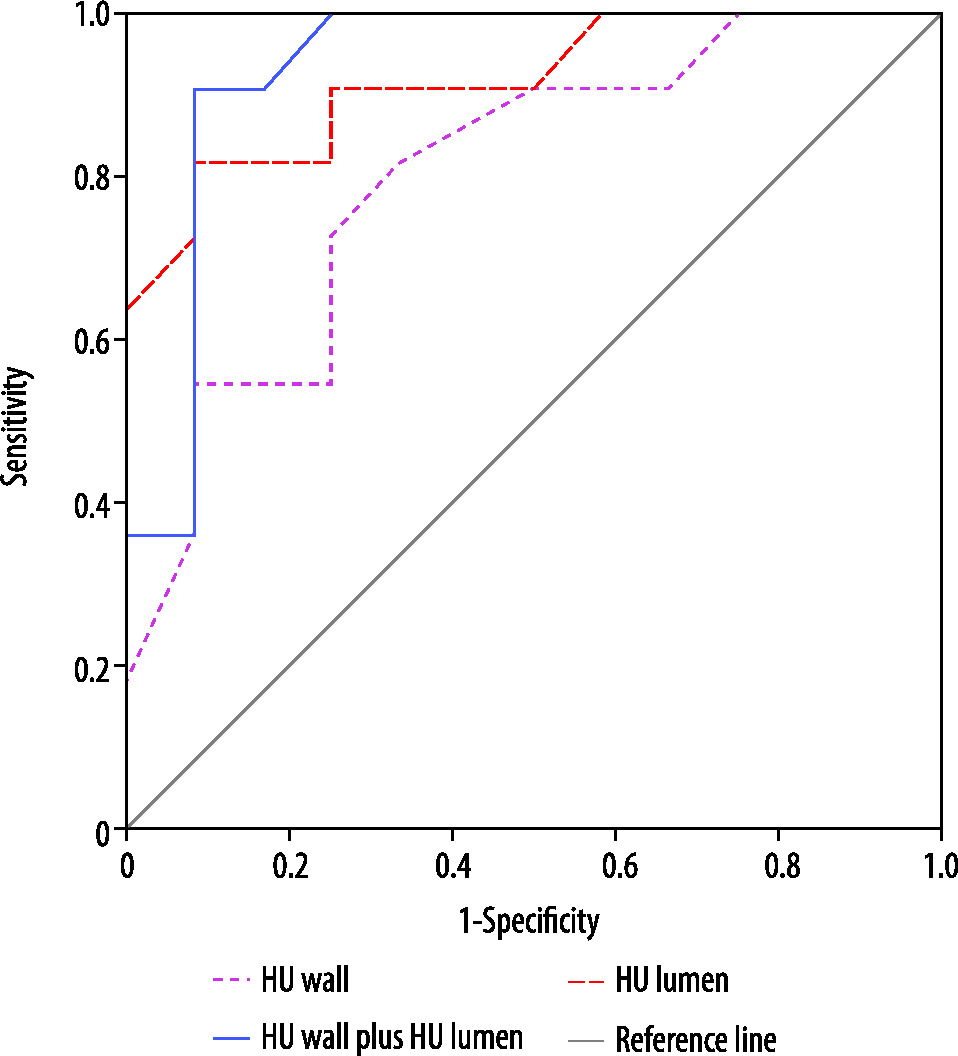
The area under the receiver operator characteristic curve for HU lumen was 0.80 (95% CI: 0.62-0.98, p = 0.014) with an ideal cut-off as 31.5 HU, where the sensitivity was 54.5% and specificity was 91.7%. HU lumen has an even better assessment for gangrenous cholecystitis with AUC of its ROC as 0.92 (95% CI: 0.80-1.00, p = 0.001) with ideal cut-off at 12.5 HU, where the sensitivity was 81.8% and specificity was 91.7% (Figure 4). The combined wall-lumen cut-off is 35 HU with sensitivity of 100% and specificity of 75% and with AUC of the ROC curve as 0.936 (95% CI: 0.827-1.000).
Discussion
Acute cholecystitis is an acute inflammatory disease of the gallbladder, which primarily results from an obstructive calculus impacted in the neck or cystic duct [7]. Gangrenous cholecystitis is one of the complications of acute cholecystitis, which is associated with higher morbidity and mortality rates compared to non-gangrenous cholecystitis [8,9]. Previous studies have described various CT findings that can predict gangrenous cholecystitis, but no single finding is specific for diagnosing this entity [4,5,10-13].
Geffroy et al. [14] and Frager et al. [15] have studied the role of unenhanced CT in diagnosing ischaemic bowel disease. Increased density in the bowel wall on unenhanced CT suggests haemorrhage and necrosis due to blockage of arterial and venous microcirculation [16]. Likewise, bacterial overgrowth with release of toxins, sepsis, suppuration, and pus is seen within the lumen of gangrenous bowel segment, which can result in a mild increase in attenuation of the intraluminal fluid contents compared to non-gangrenous bowel segment [17,18]. This increase in attenuation in the bowel wall and within the lumen can be expected in gangrenous cholecystitis due to its similar pathophysiology.
Our results show that the combination of unenhanced CT density value of gallbladder wall greater than 31.5 HU and intraluminal bile more than 12.5 HU in a case of acute cholecystitis can predict gangrenous change with high sensitivity and accuracy. Interestingly, Cheng et al. [4] described hyperdense gallbladder wall sign in 2004 and noted gallbladder wall hyperattenuation (mean 40.89 HU) on unenhanced CT scans in 51% (n = 27) of the patients in their study. However, the hyperdense wall sign was only seen in 25% (n = 7) of the patients in the study done by Chang et al. [5]. Sureka et al., in their study of 31 cases on contrast-enhanced CT, concluded that the presence of more than one of these findings: gallbladder distension (short axis diameter of ≥ 4 cm), intraluminal membranes, mural striation, absent or decreased enhancement of gallbladder wall suggest high probability of gangrenous change in acute cholecystitis [13]. To our knowledge, the importance of considering both gallbladder wall and intraluminal bile attenuation values on unenhanced CT scan or combined hyperdense gallbladder wall-lumen sign for diagnosing gangrenous cholecystitis has not been described before.
Our study had a few limitations, which should be highlighted and can be an area of future research. The sample size of cases of gangrenous cholecystitis was small which might have led to decrease in specificity, although there was almost 20% increase in sensitivity. Another limitation of our study was the time lag between CT and surgical resection, which may have led to slight changes or improvement of some cases by the time of histological examination. The measured CT numbers exhibit manufacturer and kVp dependence, which should be taken into account when defining tolerances and cut-offs. The inter-reader agreement was not calculated. However, we have tried to shed light on this new CT sign ‘combined hyperdense gallbladder wall-lumen sign’ for diagnosing gangrenous cholecystitis.
Conclusions
In summary, our study highlights the importance of using combined hyperdense gallbladder wall-lumen sign in unenhanced CT for the diagnosis of gangrenous change in acute cholecystitis. Although the combined hyperdense gallbladder wall-lumen sign may also be present in non-gangrenous cholecystitis, the cut-off CT density value of gallbladder wall greater than 31.5 HU, intraluminal bile more than 12.5 HU, and combined wall-lumen of more than 35 HU in a known clinical setting can predict gangrenous cholecystitis with reasonable sensitivity and accuracy.