Introduction
Traditional 2D mammography (full-field digital mammography – FFDM) is the only diagnostic method with a proven impact on the reduction of breast cancer mortality [1-4]. Since the introduction of screening with FFDM, a significant level of cancer detection in asymptomatic women has been observed; nevertheless, there is still a group of women who remain underdiagnosed. It pertains mainly to the patients with dense glandular breast composition (ACR type D), where FFDM sensitivity is much lower than in other groups, interval cancer detection is unsatisfactory, and, moreover, detected cancers are diagnosed at higher stage [5,6], and considering the fact that breast D type is an independent risk factor in the development of breast cancer, researchers carry out numerous tests that could be a complementary tool for screening within this group of patients.
Contrast-enhanced mammography (CEM) is a diagnostic method with contrast agent application, allowing for low-energy image acquisition (which are FFDM equivalent) and subtraction images with fat tissue attenuation and visible post-contrast pathological enhancement foci [7-9].
This examination uses neoangiogenesis phenomenon occurring in focal, mainly malignant lesions [10-13]. Contrast enhancement is visible in subtraction images and shows the true extent of malignant lesions, enabling visualisation of the lesion’s components and additional foci, which might be overlapped by fat tissue on FFDM [14,15].
According to conducted research, CEM shows significantly higher sensitivity and accuracy than FFDM and facilitates detection of more focal lesions [16-18]. Studies performed so far have shown that CEM has comparable and frequently higher diagnostic efficiency as breast magnetic resonance imaging (BMRI), which is considered to be the most accurate method [19-22].
Consequently, the indications for CEM performance are similar to those for BMRI, i.e. inconclusive results of basic imaging examinations (FFDM or hand-held ultrasound – HHUS), staging before treatment implementation, treatment response monitoring in the course of neoadjuvant chemotherapy, and patient check-up after breast cancer surgery [23].
CEM poses an alternative for patients suffering from claustrophobia or with contraindications to BMRI. The examination is quicker than BMRI and is usually well tolerated by patients. Its drawbacks are the necessity of ionising radiation application in a small dose, administration of intravenous iodine contrast agent, which may cause potential allergic reactions and renal damage, and breast compression, being a source of discomfort for patients and a generator of movement artefacts. Biopsies under CEM guidance are not widely available.
Automatic breast ultrasound (ABUS) is a new diagnostic method based on ultrasound. Contrary to HHUS this examination is performed by electro-radiologists. The patient is positioned supine and the ultrasound head is placed in 4 basic localisations moving along the breast. A typical examination consists of 3 automated scans of each breast in the anterior-posterior, lateral, and medial views. The acquired images are sent to workstations where they may be repeatedly reviewed, or multiplanar reconstructions may be created [24-27]. The examination does not require any special preparation and is well tolerated by patients. Studies conducted so far confirmed that using ABUS as an additional tool to FFDM allows the detection of more focal lesions, mainly in the case of glandular breasts [28-31]. The main indication to perform ABUS is complementary screening among asymptomatic patients, especially those with dense breast composition. The advantages of ABUS include decreased operator dependence, image storage on a dedicated station, which allows multiplanar reconstructions, high reproducibility, and the possibility of multiple reading. On the other hand, the disadvantages include inability to assess the axilla and the artifacts related to poor positioning or lack of contact or motion.
Both the above methods – CEM and ABUS – have the potential to be used as a complementary method to FFDM in screening, which has already been a subject of research [32-34]. The aim of our study is to compare diagnostic efficiency of ABUS and CEM.
Material and methods
This retrospective analysis including 81 women was performed within our study. The women presented at the Breast Imaging Diagnostics Unit of the University Hospital in Cracow between 2020 and 2022 to undergo further, deepened diagnosis of breast focal lesions. In all cases FFDM, CEM, and ABUS were performed, and all lesions detected on the above examinations were evaluated according to Breast Imaging Reporting and Data System (BI-RADS) classification. All examinations were conducted in concordance with a standard protocol.
ABUS examinations were performed by adequately trained electro-radiology technicians. Each breast was examined in 3 standard projections: anteroposterior, lateral, and medial, and if necessary, additional projections covering the upper inner and lower outer quadrants were performed. The following features were assessed on ABUS: number of focal lesions, their localisation, size, and margin: well-defined circumscribed, indistinct (ill-defined, spiculated), echo pattern, retraction, or acoustic shadow presence. FFDM was performed in craniocaudal (CC) and mediolateral oblique (MLO) projections, and the features evaluated included localisation, and margin: well-defined circumscribed, indistinct (ill-defined, spiculated), and microcalcifications presence. CEM was performed according to the indications and protocol described in the literature, after previously administering contrast medium at a dose of 1.5 ml/kg [35-37].
The examination was started 2 minutes after contrast medium administration with the breast suspicious of focal lesion presence in the CC projection, then the second breast was examined in the CC projection; subsequently, MLO projections were performed in the same order as for CC projections. The apparatus automatically acquired low-(equivalent to FFDM) and high-energy images. In high-energy images the presence and number of visible focal lesions were assessed, as well as their localisation (quadrant), contrast enhancement type within the lesion, qualitative level of enhancement (weak, medium, moderate, strong), and quantitative enhancement values and sigma in 2 projections using the ROI (region of interest) of ellipsoid shape within the focal lesion in CC and MLO projections. Mean values were designated for every lesion, enhancement shape (well circumscribed, poorly circumscribed, oval, microlobulated, irregular, segmental, spiculated, rim), enhancement type (homogenous, heterogenous), focal lesion margin (circumscribed, not circumscribed), and parenchymal enhancement type BPE – qualitatively (minimal, mild, moderate, marked) and quantitatively using an ROI of 2 cm2 area, of ellipsoid shape, in 2 projections, designating mean values for each breast. Each lesion received an appropriate code according to the BI-RADS classification.
An analysis of the number of focal lesions visible on every examination, including their characteristics, size, and localisation was performed. Focal lesions classified as BI-RADS 4 and 5 in any method were subjected to histopathology verification using core needle biopsy (CNB) and vacuum assisted biopsy (VAAB). Lesion assessment and their verification were performed by radiologists specialising in breast diagnostics, having experience ranging from 5 to 30 years. Figures 1, 2 and 3 show CEM and ABUS images of sme patient.
Figure 1
Full-field digital mammography of both breasts in craniocaudal view; no abnormalities are to be seen
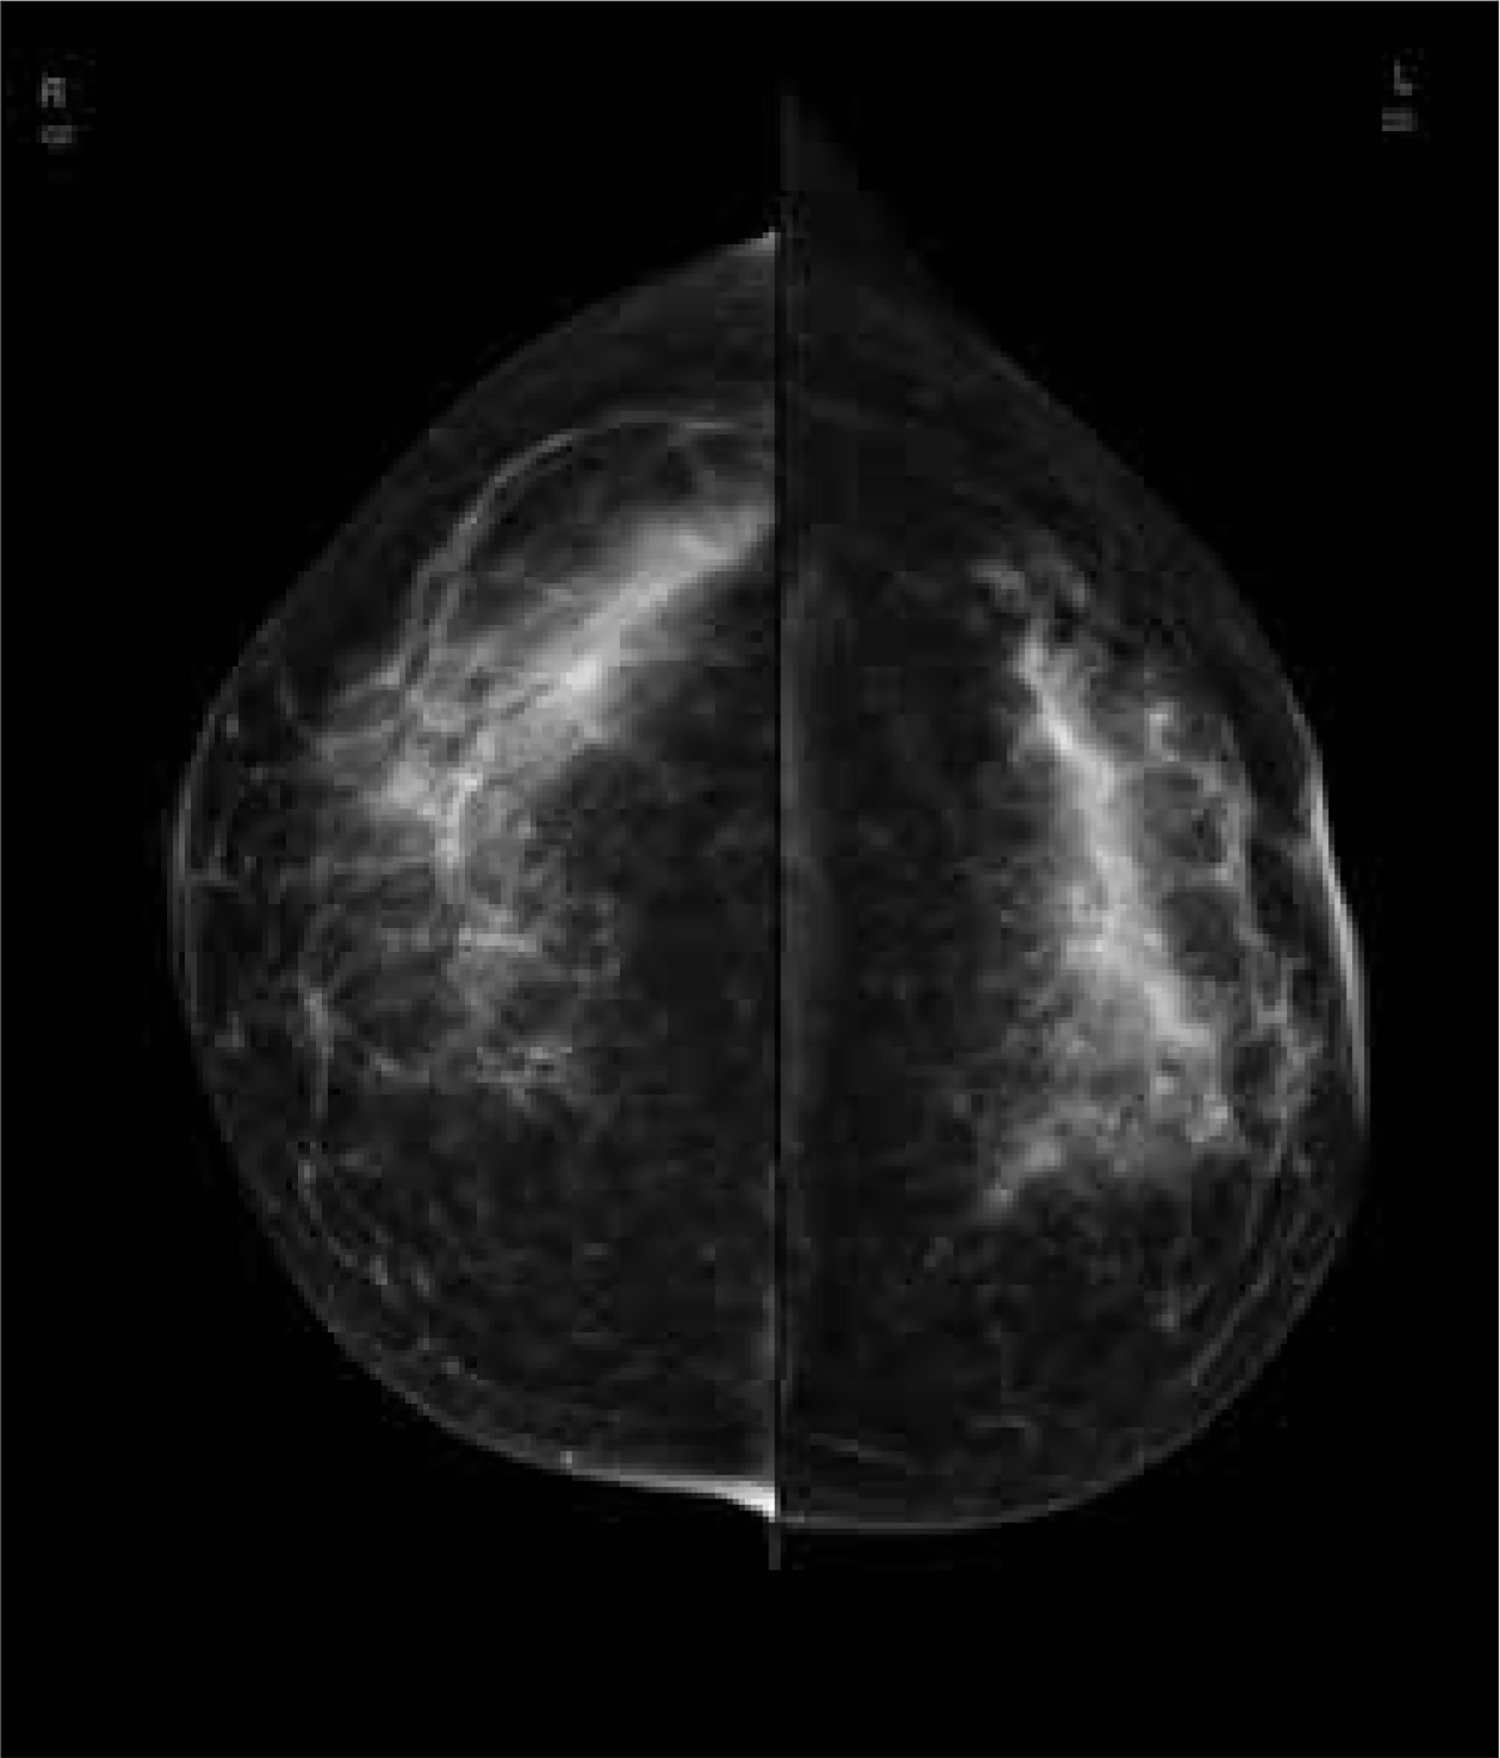
Figure 2
Contrast-enhanced mammography of both breasts in craniocaudal view of the patient from Figure 1. A strong and amorphic non mass enhancement is seen in the outer quadrant
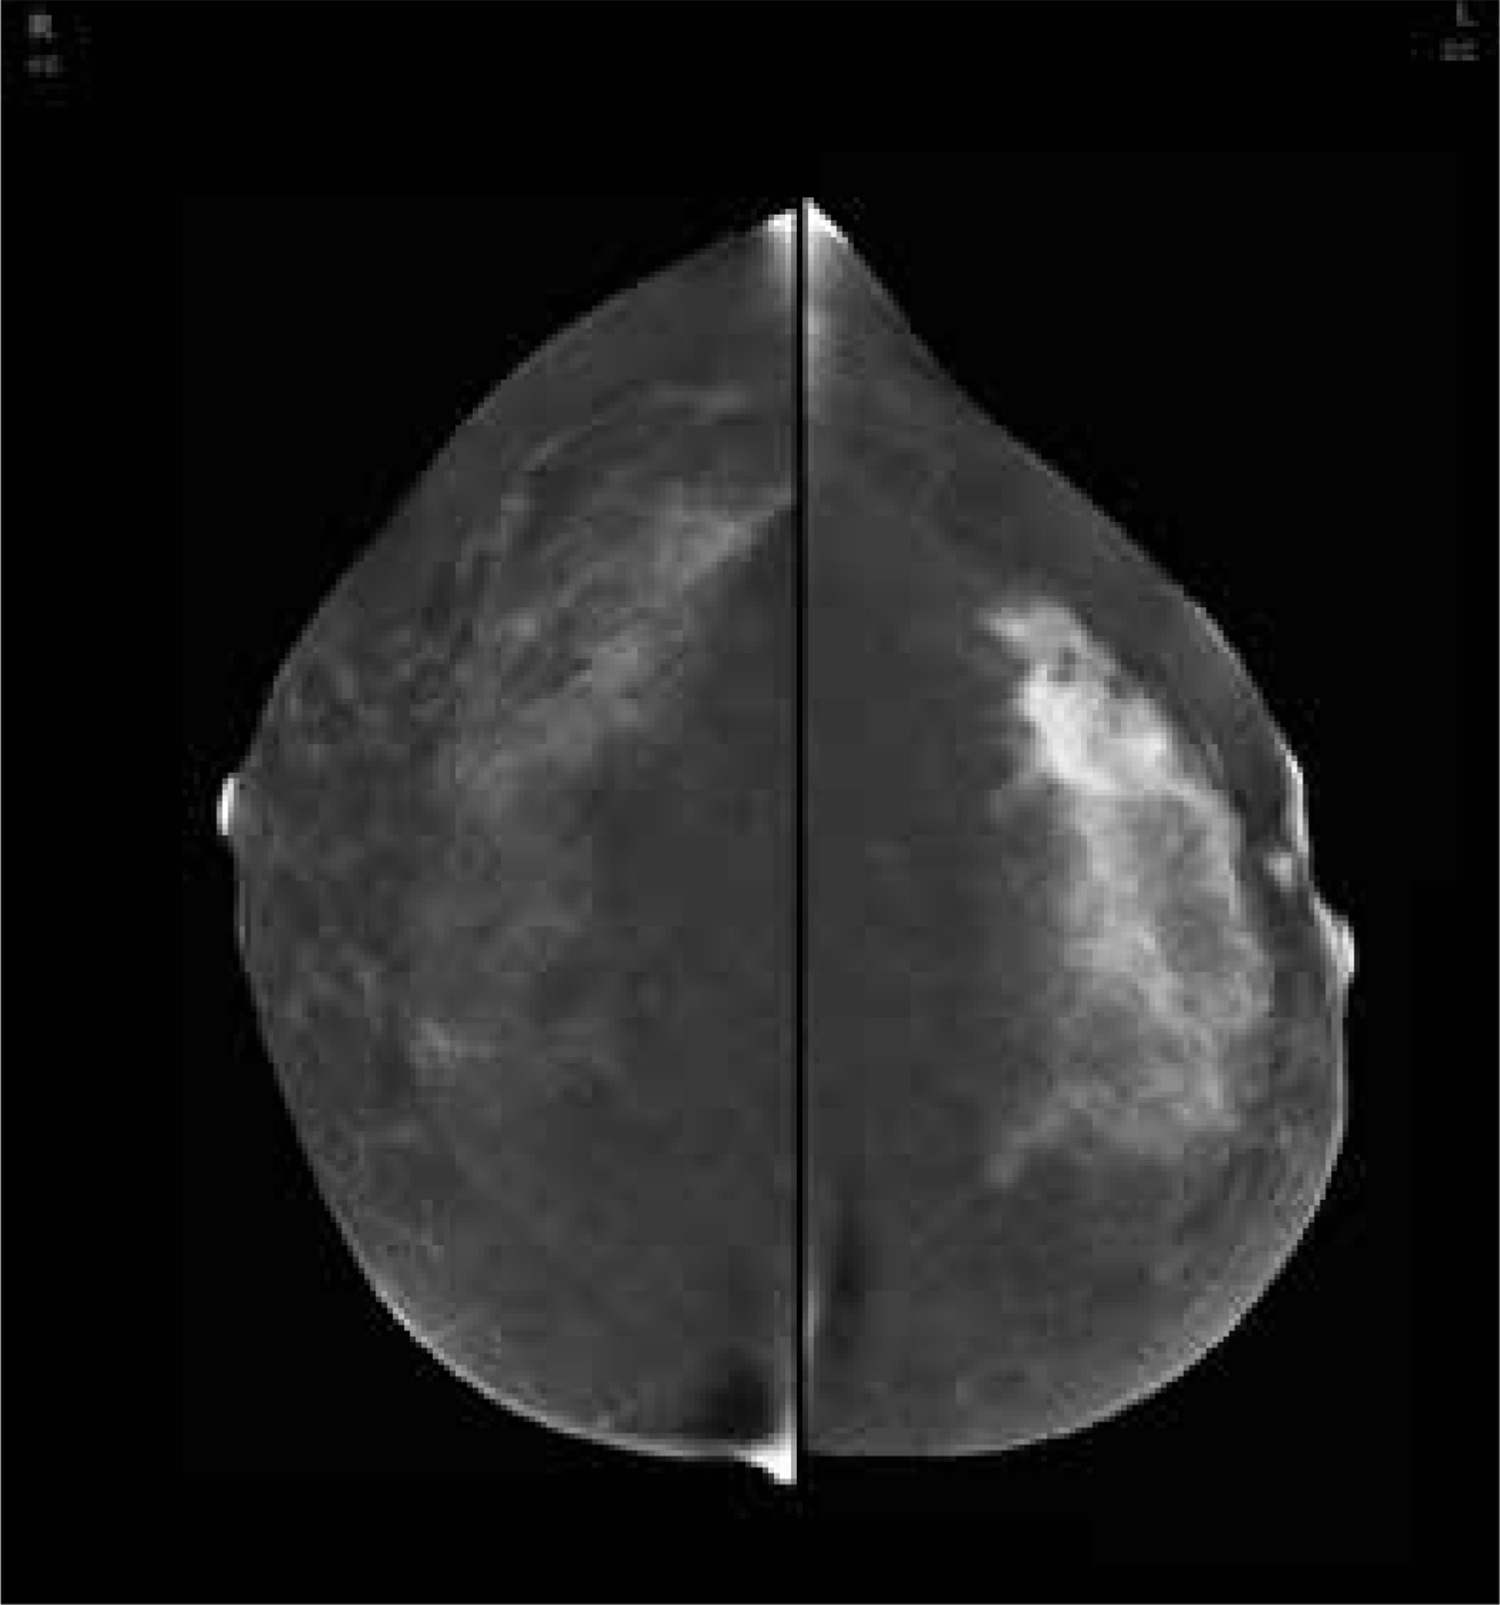
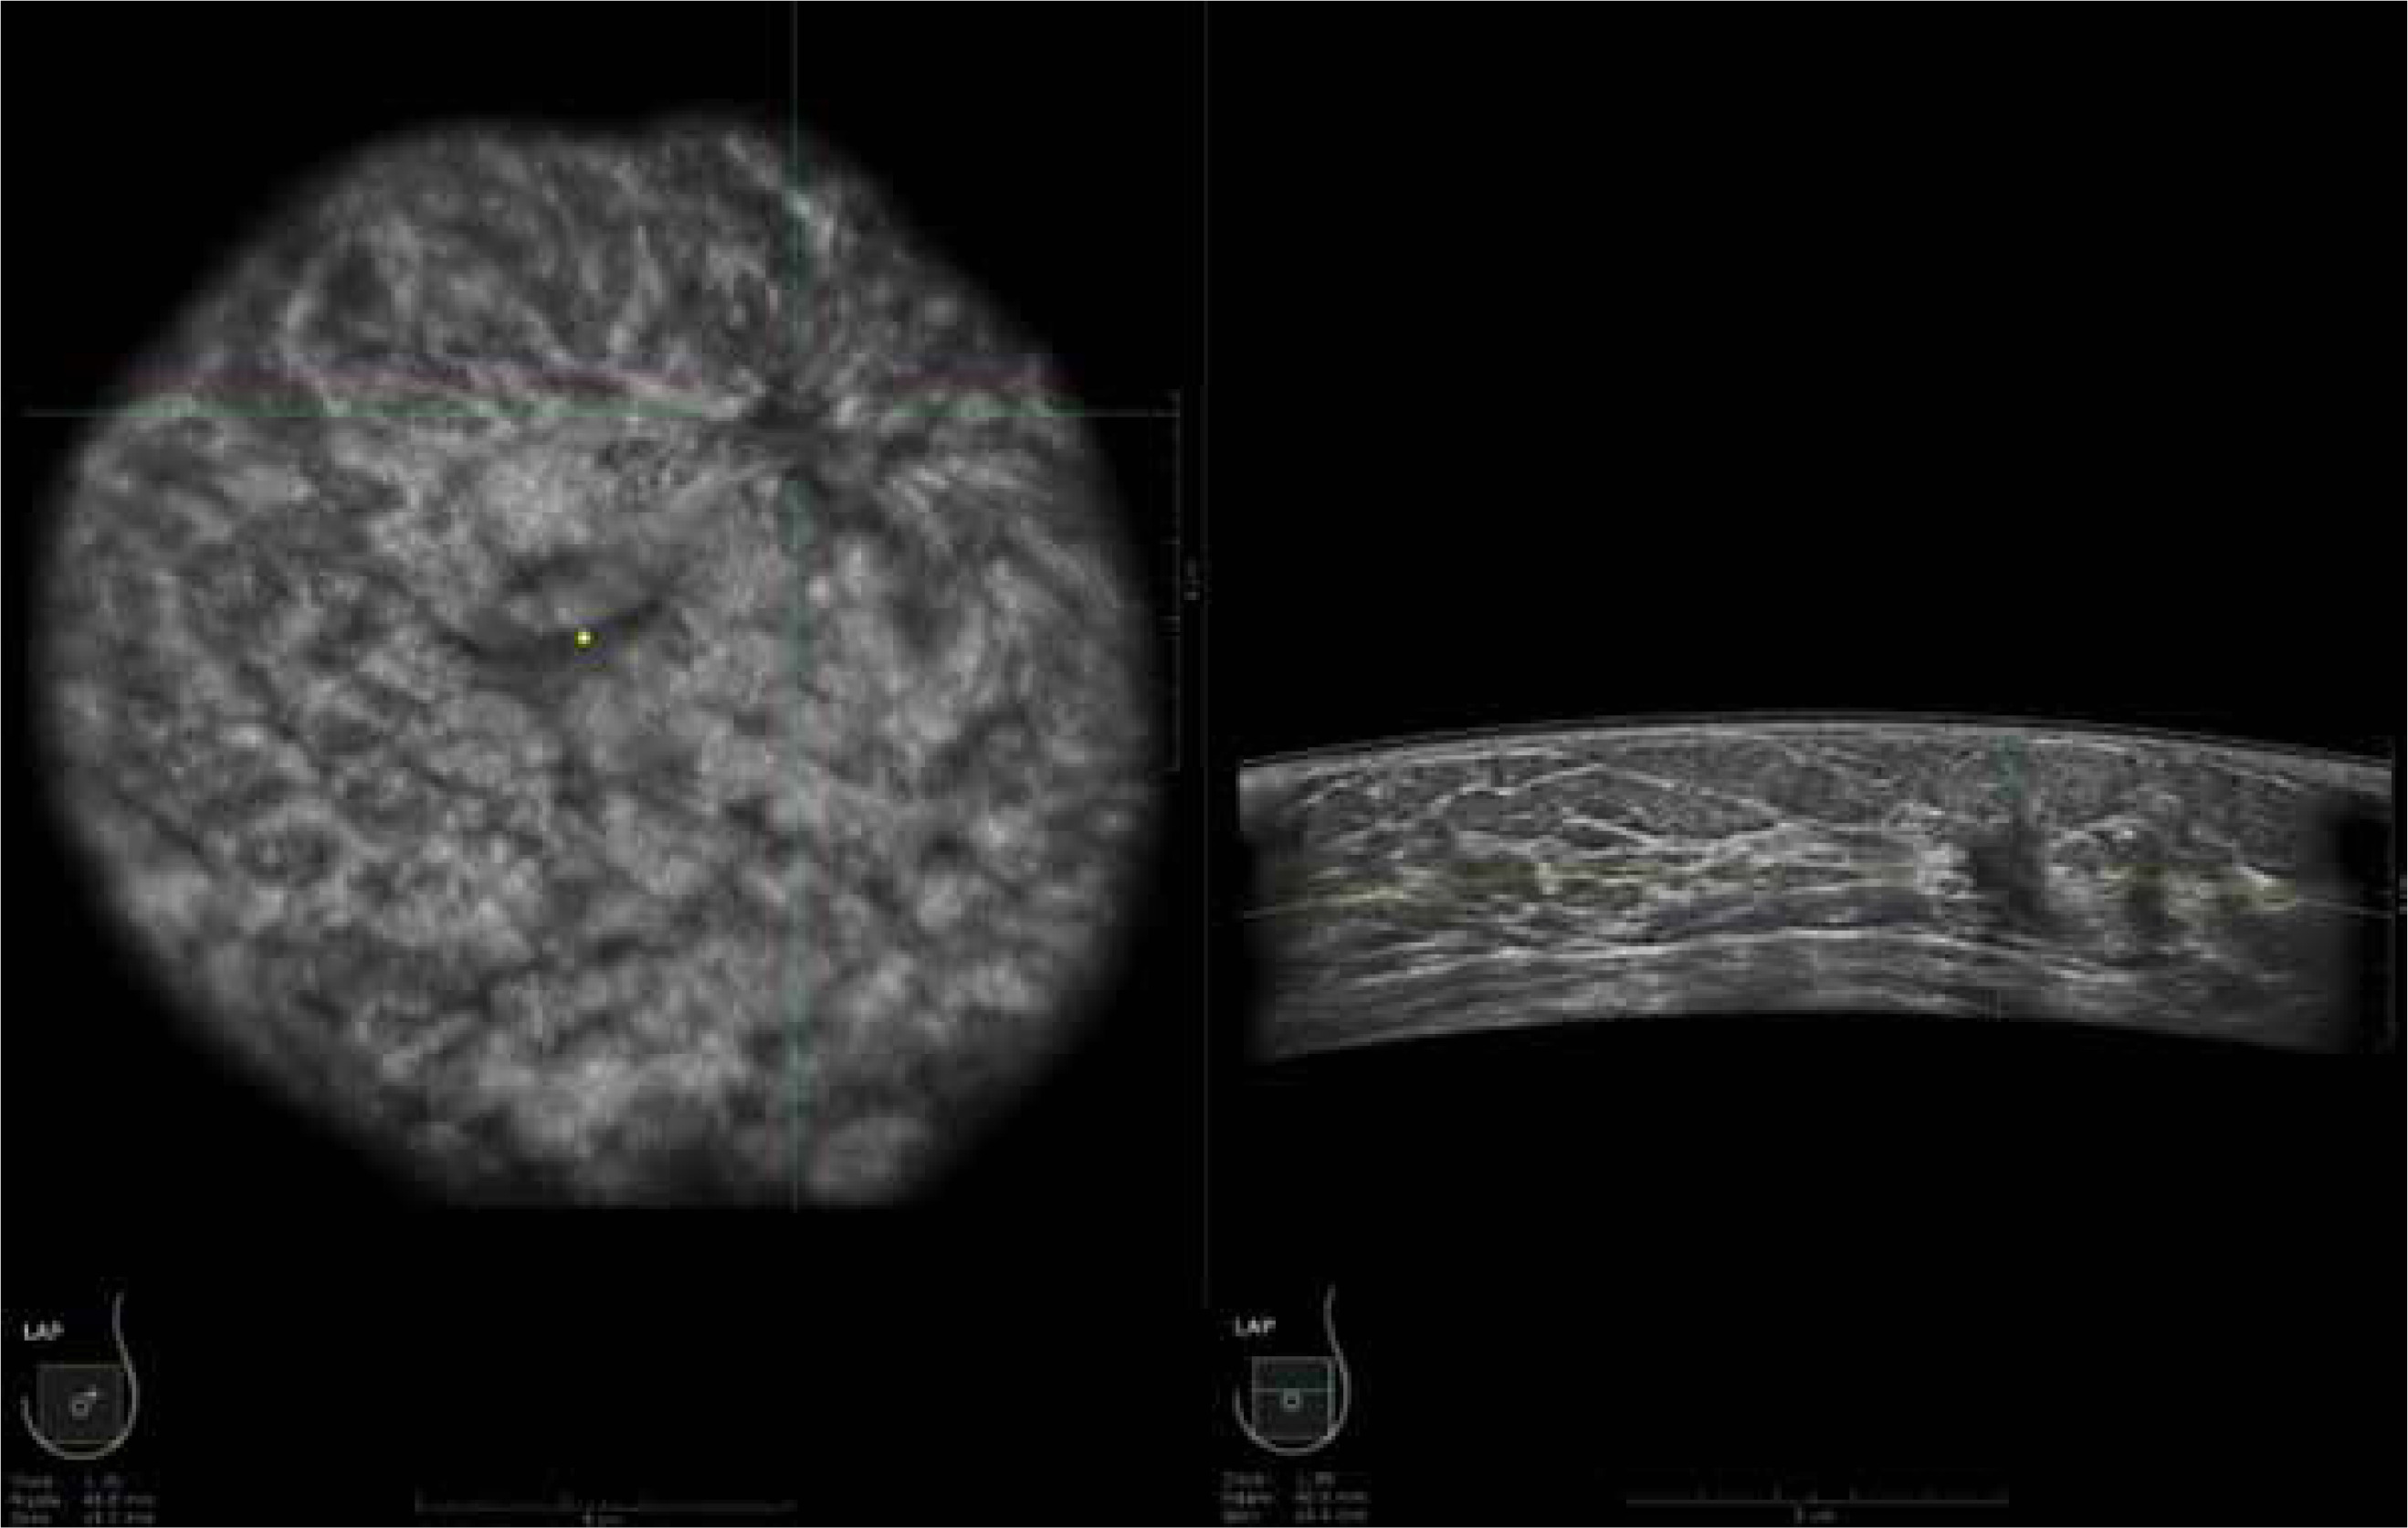
Figure 3
Automatic breast ultrasound of the left breast of the same patient as in Figure 1 and Figure 2, coronal and axial view. An irregular mass with architectural distortion around is seen in the upper outer quadrant
The diagnostics and treatment of the patients involved in the study was conducted entirely in the University Hospital in Cracow.
Histopathology examination
After obtaining tissue samples at Pathomorphology Unit of the University Hospital in Cracow pathomorphologists specialising in breast cancer diagnostics performed histopathology examinations. The sections were fixed in 10% buffered formalin and subjected to routine paraffin embedding and staining with haematoxylin and eosin, followed by microscopic image analysis. The lesions were further classified as benign or malignant using B scale 1-5. If a malignant lesion was determined, ER, PgR, HER2 receptors and Ki67 indexas well as stage, and histological type were evaluated.
Statistical methods
The obtained data were statistically analysed. To compare the results of the diagnostic tests the McNemar’s test was applied for independent samples, and the Z-test for 2 independent proportions. Kappa coefficients were used to determine BI-RADS codes compliance. The non-parametric Mann-Whitney U test was employed to compare the size of focal lesions. To describe focal lesion morphology the χ2 test of independence was applied, and to analyse margins compliance the kappa coefficient was used. Moreover, receiver operating characteristics (ROC) analysis was used and the curves drawn.
Results
A total of 169 lesions were detected in 81 examined patients. Among the lesions 110 were histologically verified, including 92 lesions that appeared to be malignant (B5), 5 were B3 lesions, and 13 were benign. The youngest examined patient was 29 years old and the oldest 77, and the mean age was 49 years old. The largest group among the histologically verified was invasive cancer with a ductal carcinoma in situ (DCIS) component (42 lesions, 38% of the lesions).
Among the detected lesions, 85 were found on FFDM, including 70 that were histologically verified; 108 lesions were visible as enhancement in the subtraction images on CEM, including 95 that were histologically verified; 129 were found on ABUS, including 93 that were histologically verified. Among the lesions detected on FFDM 60% were confirmed with CNB, 10% with VABB, and 32% were not subjected to verification. On CEM 57% were confirmed with CNB, 10% with VABB, and 32% were not subjected to verification. On ABUS 47% of lesions were confirmed in CNB, 12% in VABB, and 40% were not subjected to verification.
Among lesions detected on FFDM (85), only 5 (5.9%) were not visible on any other diagnostic methods. Among 108 lesions found on CEM 19 (17.6%) were not visible by any other method, and there were 54 lesions detected on ABUS that were not found on FFDM. However, ABUS detected as many as 36 additional lesions that were not visible on CEM nor on FFDM (including 10 lesions verified as malignant in histopathology). Thirty-seven lesions visible on CEM were not shown on FFDM.
In the next step the number of lesions detected on different modalities in patients with multiple foci was compared. The analysis comprised the patients with more than one lesion detected on any imaging method used in the study, comparing their efficiency in the detection of small lesions.
The results are presented in Table 1.
Table 1
The number of focal lesions in patients with multiple lesions found on full-field digital mammography (FFDM) , automatic breast ultrasound (ABUS), and contrast-enhanced mammography (CEM)
The aim of the next stage was to assess the relationship between focal lesion margin and malignancy grade and histopathological type of the lesion. It has been shown that the margin type in every examination method depends on the benign or malignant character of the lesion (p < 0.05 χ2 test of independence). A well-defined circumscribed margin was more common in benign lesions, whereas a spiculated margin was associated with malignant lesions. On FFDM a well-defined circumscribed margin was present in 33% of benign lesions but was not found in any malignant lesion; an indistinct margin was present in 67% of benign lesions and 78% of malignant lesions; and a spiculated margin was present in 22% of malignant lesions (p < 0.00). Dividing the lesion margin types more precisely, the following distribution of lesion margins was determined on ABUS: benign lesions – well-defined circumscribed: 27%, indistinct: 53%, speculated: 7%, microlobulated: 13%; malignant lesions – well-defined circumscribed: 8%, indistinct: 37%, speculated: 21%, microlobulated: 10%, blurred: 24% (p = 0.038). On CEM circumscribed margin was present in 25% of benign lesions and 6% of malignant lesions, not circumscribed in 75% of benign lesions and 78% of malignant lesions, and spiculated in 16% of malignant lesions (p = 0.043).
Further analysis pertained to the relation between margin type in all used imaging methods and histopathological types of lesion. Histopathological findings were divided into invasive cancers (NST) with possible DCIS component, lobular carcinomas and lobular carcinoma in situ (LCIS), and DCIS. We found it impossible to determine the correlation between the margin type described on FFDM and CEM and the lesion type (lobular + LCIS, NST + DCIS, DCIS) (p > 0.05 χ2 test of independence). However, there is a correlation between lesion margin described on ABUS examination and lesion type (p = 0.014 χ2 test of independence).
It was also shown that the lesion’s margin type on ABUS depends on the lesion’s grade – benign lesions, DCIS, invasive lesions (p < 0.05 χ2 test of independence). On ABUS, the higher the malignancy grade of the lesion, the lower the incidence of well-defined circumscribed lesion. On ABUS a well-defined circumscribed margin was present in 28% of benign lesions, in 17% of DCIS, and in 6% of invasive lesions, while an indistinct (ill-defined) margin was seen in 94% of malignant lesions, 83% of DCIS, and 72% of benign lesions (p = 0.029). This correlation was not determined for FFDM or CEM examinations.
The study aimed to establish whether the lesion’s margin described using each method depends on the histopathological type – NST and other cancers. Such a correlation was not encountered in the case of FFDM or CEM, but only in ABUS (p < 0.00 χ2 test of independence). Among NST lesions an indistinct margin was present in 98% and well-defined circumscribed in 2%, whereas in other malignant cancers an indistinct margin was present in 82% and well-defined circumscribed in 18% of the lesions (p = 0.036).
The compliance of focal lesions’ margin assessment on FFDM, ABUS, and CEM was also compared and was found to be 80% for FFDM and CEM, with a k conformity coefficient of 52% [32%, 72%]. Margin assessments obtained on ABUS and CEM were identical in 59% of cases.The κ conformity coefficient for them was only 4% [–12%, 20%], and it is not possible to state if it significantly differs from 0 (p = 0.67) – we concluded that the margins described using ABUS and CEM are not consistent. Margin assessment consistency on ABUS and FFDM was 73%. The κ conformity coefficient for them was 48% [31%, 65%], showing that margin assessments on these examinations were consistent (p < 0.00).
No correlations were found between focal lesion margins and receptor status – the presence and expression level of oestrogen, progesterone, HER, or Ki67.
By analysing the lesions’ margins (being part of the BI-RADS classification assessment), the compliance of their categories allocated on FFDM, ABUS, and CEM according to the BI-RADS lexicon was confirmed. The highest compliance was found for the categories allocated on FFDM and CEM – 93%, for ABUS and CEM – 65%, and the lowest for ABUS and FFDM – 63%.
Among lesions detected on FFDM, 84% (71 lesions) showed contrast enhancement on CEM, among lesions detected on ABUS this figure was 50% (84 lesions).
The numeral values of contrast enhancement on CEM were subjected to analysis and referred to the lesion’s margin described on ABUS. The correlation is shown in Table 2.
Table 2
The correlation between the focal lesions’ margins on automatic breast ultrasound (ABUS) and numeric parameters of their contrast enhancement on contrast-enhanced mammography (CEM)
The contrast enhancement on CEM was characterised. All focal lesions visible both on ABUS and CEM were divided into malignant and benign, and their enhancement pattern was determined. In the group of malignant lesions the most frequent was non-circumscribed enhancement – 51%, microlobulated – 22%, spiculated – 18%, oval and irregular – 3% separately, circumscribed and rim – 1% separately. In the group of benign lesions 58% were characterised by non-circumscribed enhancement and 42% by microlobulated enhancement.
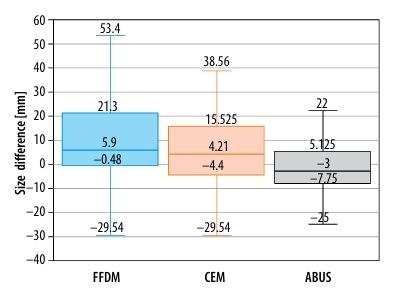
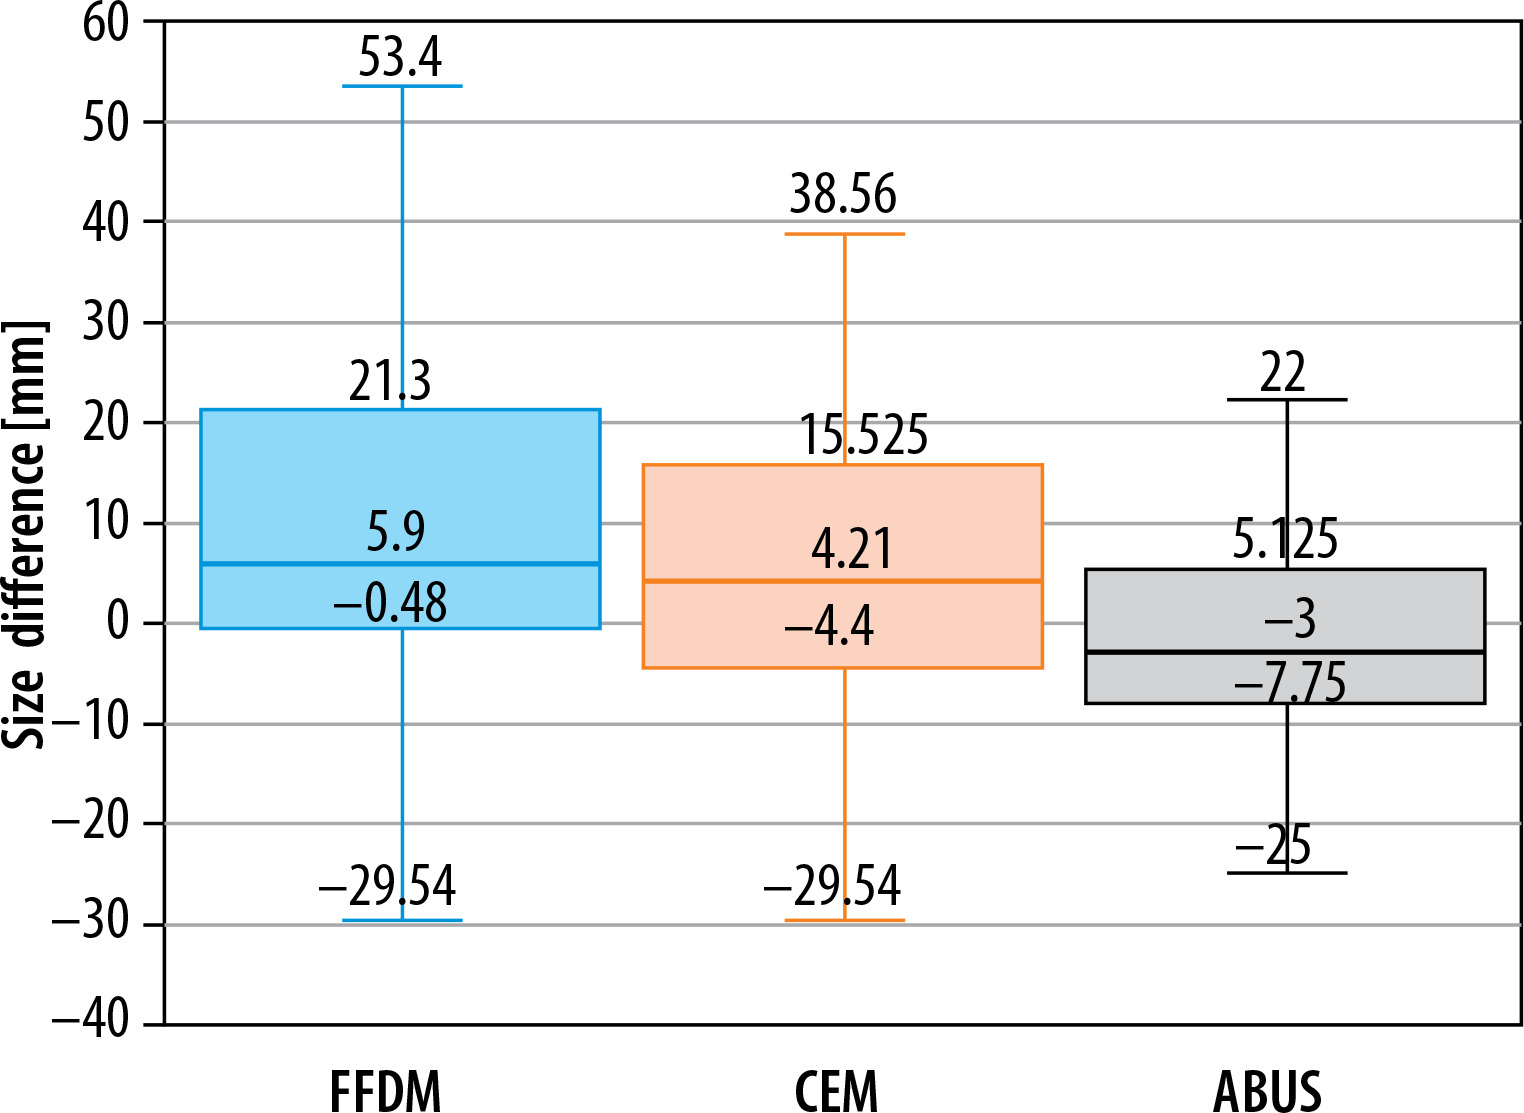
Further studies compared focal lesions’ size measured on each examination with post-operative histopathological examinations, as a gold standard. The sizes of pairs of lesions were analysed by evaluating the difference between the size obtained in a certain diagnostic examination and the result of histopathological examination (lesion sizes on FFDM and CEM had been corrected with compression coefficient – 0.94). The best result was obtained for ABUS because a statistic test did not confirm significance of the difference between lesions’ sizes – not different from 0 (p = 0.258). Lower compliance was found for CEM (p = 0.012). For lesion sizes measured on FFDM the values were statistically significantly greater than those obtained in histopathological examination. This relationship is shown in Figure 4.
Figure 4
Focal lesion sizes on full-field digital mammography (FFDM), automatic breast ultrasound (ABUS), and contrast-enhanced mammography (CEM)
Sensitivity, specificity, positive predictive value (PPV), negative predictive value (NPV), accuracy for ABUS, CEM, FFDM, as well as combinations of methods: FFDM with ABUS and FFDM with CEM, were compared – the results are presented in Table 3.
Table 3
Values of sensitivity, specificity, positive predictive value (PPV), negative predictive value (NPV), accuracy for automatic breast ultrasound (ABUS), full-field digital mammography (FFDM), contrast-enhanced mammography (CEM), ABUS + FFDM and FFDM + CEM
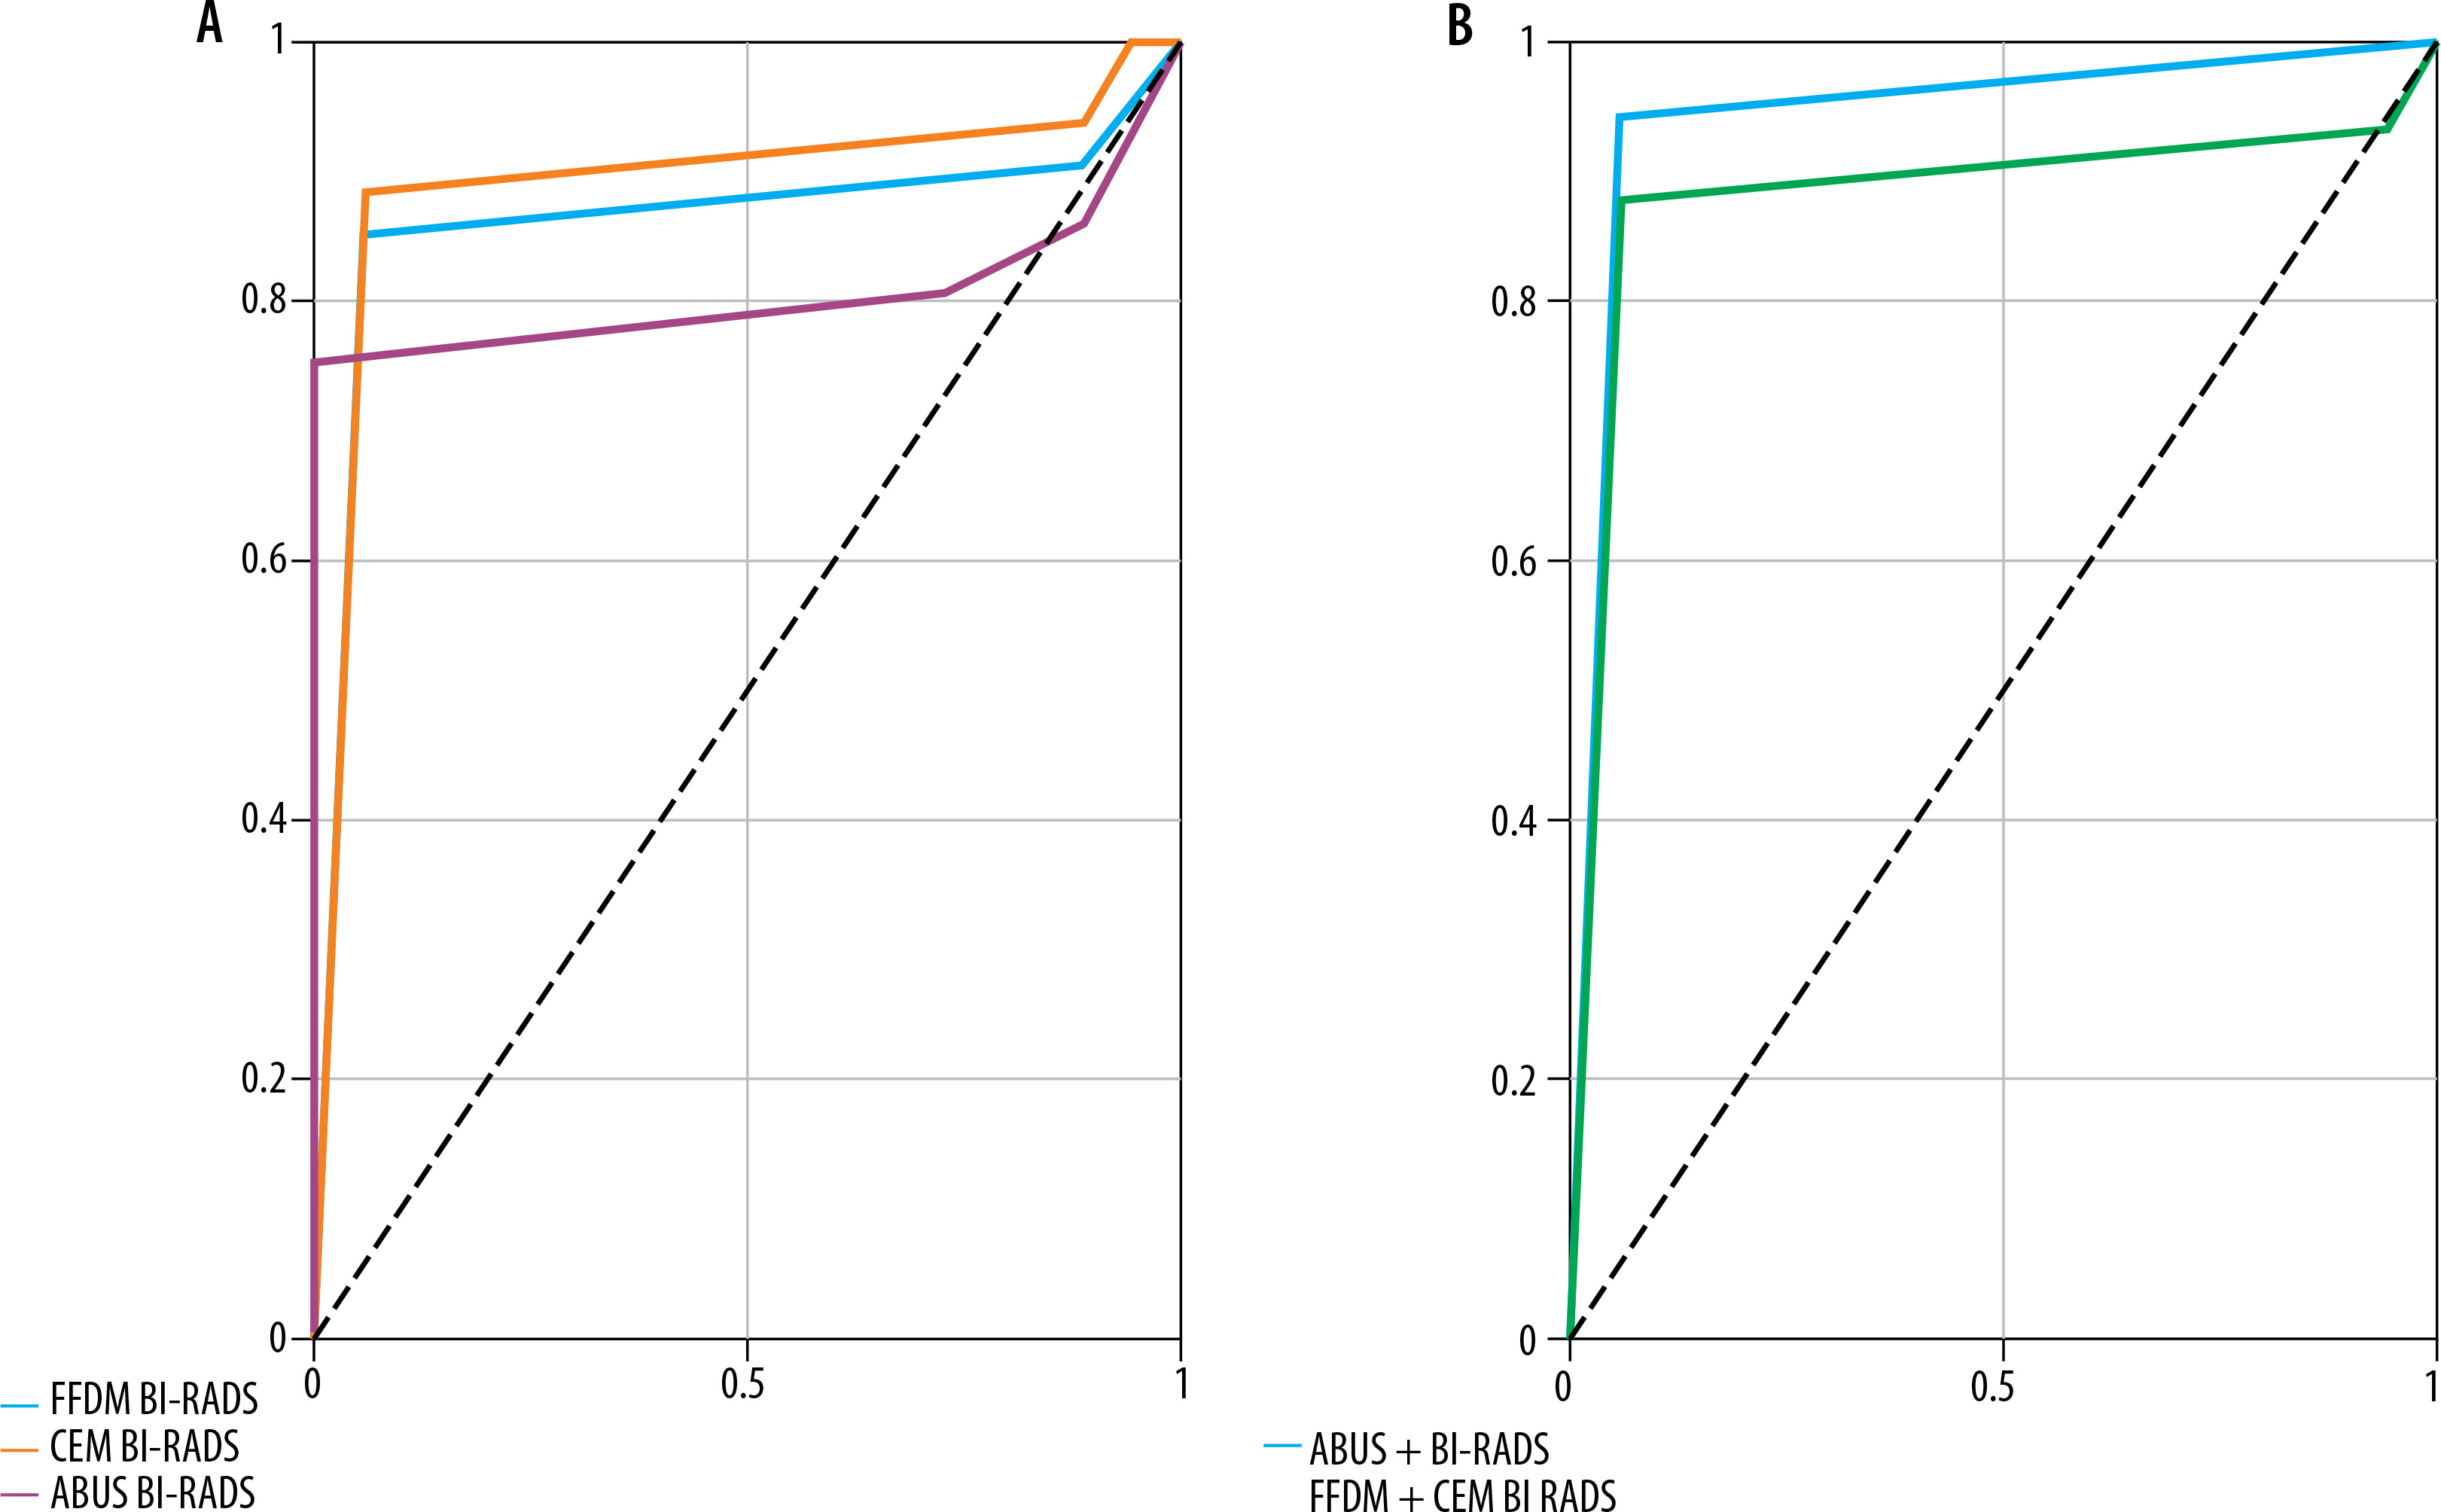
ROC analysis and curve delineation as well as area under the curve (AUC) were performed and are presented in Figures 5A and 5B. AUC values are shown in Table 4.
Table 4
Area under the curve (AUC) values for automatic breast ultrasound (ABUS), full-field digital mammography (FFDM), contrast-enhanced mammography (CEM), ABUS + FFDM, and FFDM + CEM
| Method | AUC | p-value | Optimal cut-off point |
|---|---|---|---|
| ABUS | 0.803 | 0.000 | 4 |
| FFDM | 0.858 | 0.000 | 4 |
| CEM | 0.890 | 0.000 | 4 |
| ABUS+FFDG | 0.947 | 0.000 | 5 |
| FFDM+CEM | 0.855 | 0.000 | 5 |
Discussion
Due to the low efficiency of FFDM, particularly in patients with mostly glandular breast composition, scientific research has been conducted for many years to choose the most effective imaging method, improving cancer detection rates and having the potential to be used as a complementary screening method [38]. Despite the introduction and common application of screening with FFDM, which has brought a significant decrease in breast cancer-induced mortality, the problem of low detection rate of new cancers and interval cancers, especially among women with glandular breast composition, still exists [39]. The denser the breast, the lower the sensitivity of mammography [40]. Sensitivity of FFDM is low both in patients with dense breast compositions and in patients with genetic predispositions to developing breast cancer [41-45]. Because summation images are created on FFDM, its efficiency is significantly decreased in the case of the glandular breast composition, due to comparable radiation attenuation coefficient for glandular tissue and tumours [46]. ABUS and CEM potentially improve cancer detection within this diagnostically problematic group of patients.
Although the greatest number of lesions among the examined patients was detected on ABUS, the smallest percentage of them (72%) was verified in histopathological examination in comparison to the other analysed methods. On the other hand, 82% of lesions detected on FFDM and 88% on CEM were subjected to verification. On CEM 19 additional lesions not visible on other imaging examinations were found, and as many as 36 new lesions were detected on ABUS. Moreover, in the case of the patients with more than one focal lesion in the breast ABUS enabled detection of the largest number of focal lesions (106) in comparison to other methods – 88 lesions on CEM and only 65 on FFDM; lesions were detected in more patients – on ABUS in 44%, CEM – 43%, and FFDM – 38%.
The above data are suggestive of the statement that ABUS allows the detection of the greatest number of focal lesions, although to a large extent they do not require histopathological verification. CEM also shows a greater number of focal lesions, but their verification is often necessary. These lesions are clinically more significant, and they more frequently change the patient’s treatment path. The smallest number of focal lesions was detected on FFDM, and 82% of them required verification. ABUS, similarly to CEM, enables visualisation of much more additional focal lesions in patients with multiple lesions (usually small lesions), which may be invaluable in the evaluation of the primary process extent and qualification for treatment.
According to the studies performed so far, CEM significantly improves breast cancer detection in women with dense breasts and patients with moderate risk of breast cancer development; Sorin et al. [47] in their study including 611 women showed CEM sensitivity to be approximately 38.1% higher than FFDM; however, the specificity of CEM was about 14.4% lower than FFDM. Sung et al. [48] in their study comprising 904 patients with elevated risk of breast cancer development stated that the sensitivity of subtraction images on CEM was about 37.5% higher in comparison with low-energy images. Recent studies also proved ABUS to be able to detect more breast cancers as a complementary method used in screening. In a study on a group of 112 women, Brem et al. [30] showed that complementing FFDM with ABUS enabled the detection of 1.9 more cancers per 1000 patients. Another study on a group of 1668 patients with dense breasts performed by Wilczek et al. [31] confirmed that ABUS allowed the detection of 2.4 more cancers per 1000 patients in comparison to FFDM.
Our study confirmed the correlation between the lesion’s margin and its histopathological character in all analysed methods. The highest correlation was found in FFDM (p < 0.00), then ABUS (p = 0.038), and the lowest in CEM (p = 0.043). In all the analysed methods, well-defined circumscribed margins were more frequently present in benign lesions, while indistinct (ill-defined) were more frequently present in the case of malignant lesions. However, most benign lesions found on all modalities were characterised with indistinct margins, and the minority with well-defined circumscribed, with such a margin present in 33% of lesions visible on FFDM, 27% on ABUS, and 25% on CEM.
ABUS analysis showed a correlation between the lesion’s margin type and the histopathological type of malignant lesion, which was an advantage of ABUS over other methods. Summation may be the reason for the distortion of the focal lesion margin in CEM and FFDM, resulting from overlapping the peripheral parts of the lesion with glandular tissue, which has a similar ability of radiation attenuation as the lesion itself. What is more, the possibility to perform multi-dimensional reconstructions on ABUS facilitates margin analysis in all projections, contrary to FFDM and CEM, where it is limited to only 2 projections. In CEM and FFDM short irregularities in lesion margins would only be visible if their localisation was tangential to the radiation. Focal lesions’ margins on ABUS depend also on their malignancy grade. It was shown that a well-defined circumscribed margin was most frequently present in the case of benign lesions, less frequently in the case of DCIS, and the least in the case of NST – such a correlation featuring gradation of lesion margins proportion was not found in other analysed methods.
The highest compliance of lesion margins was achieved for FFDM and CEM – 80%, because they are summation methods using roentgen radiation. The second-best compliance was shown between ABUS and FFDM – 73%, while the lowest was between ABUS and CEM.
Subsequently, the study compared compliance between BI-RADS categories allocated in different examinations. The highest compliance was determined between CEM and FFDM – 93%, slightly lower between ABUS and CEM, and the lowest between ABUS and FFDM – 63%.
On CEM as much as 84% of lesions detected on FFDM showed post-contrast enhancement, but only 50% of lesions detected on ABUS. According to previously conducted studies, focal lesions showing post-contrast enhancement; particularly, lesions of mass-like type on subtraction images on CEM (mainly when accompanied by a focal lesion on low-energy images) are much more frequently malignant in comparison to lesions not showing such enhancement [49].
Due to the above statement, we may conclude that focal lesions detected on FFDM may be malignant with a higher frequency. A great percentage of lesions detected on ABUS did not require verification – in our study 40% did not require verification (32% on CEM and 24% on FFDM). As a result, these lesions were classified as BI-RADS 2 – mostly cysts, less frequently lipomas.
Contrast enhancement value measurement on CEM is the only quantitative form of evaluation of a focal lesion’s potential malignancy. According to previous studies, malignant lesions demonstrate significantly higher contrast enhancement values in comparison to benign lesions. What is more, a correlation between histopathological types of cancers and enhancement values on CEM was established [50-54]. In our study, the focal lesion margin on ABUS was compared to mean numeric values of focal lesion contrast enhancement on CEM, which may be also used as a tool for determining the probability of the lesion’s malignancy.
Mean values of focal lesion contrast enhancement were combined with the lesion margin determined on ABUS to find compliance between these 2 important characteristics of focal lesions using these 2 diagnostic methods. It appeared that lesions having well-defined circumscribed margins on ABUS showed lower mean post-contrast enhancement on CEM than lesions having other types of margins. The highest enhancement values were found in lesions with microlobulated margin type on ABUS, slightly lower values were found in the case of blurred margins, then spiculated and ill-defined. For all the described groups. post-contrast enhancement values on CEM were higher in MLO than in CC projections. Sigma values also appeared to be the lowest for lesions that were well-defined circumscribed on ABUS and the highest for those with microlobulated margins.
ABUS allows us to determine the size of a focal lesion with the greatest accuracy in comparison to the gold standard – post-operative histopathological examination. This indicates an invaluable role of ABUS in determining the extent of primary disease. CEM shows lower compliance, although still higher than for FFDM, which may result from the fact that the extent of post-contrast enhancement on subtraction images on CEM is much greater than the mass visible on FFDM, which shows the process spread beyond the macroscopically visible mass of the tumour on FFDM in a functional way. Both CEM and ABUS have an advantage over FFDM in the evaluation of the local stage of cancer.
Among all separately analysed methods CEM showed the highest sensitivity – 93.48, and the lowest was for ABUS – 80.43; the specificity was the highest for ABUS, and similarly lower for FFDM and CEM (11.11). The highest accuracy was shown for CEM – 80, the lowest ABUS – 71.82. The sensitivity of CEM was significantly statistically higher than for ABUS (p < 0.02).
Because our study focuses on finding a complementary method to FFDM as the only method with proven reduction in mortality due to breast cancer development, combinations of methods (FFDM and ABUS, FFDM and CEM) were also analysed. Better results were obtained for the first combination, where sensitivity increased to 100% and accuracy to 84.55%; for the second combination the values were as follows: 93.48% and 79.09%. Moreover, sensitivity of FFDM + CEM is significantly higher than ABUS sensitivity (p = 0.03). ABUS values indicate that the ability to recognise malignant lesions is varied – the most effective appeared to be the combination of ABUS and FFDM (AUC = 0.947), while the combination of ABUS and CEM showed a lower AUC value of 0.855. CEM showed the highest AUC value for a single method.
Our study showed that both ABUS and CEM may serve as a valuable complementary method for FFDM – both methods combined with FFDM cause accuracy improvement; moreover, ABUS increases sensitivity. However, it comes at the expense of decreased specificity. ABUS as an ultrasound method does not pose a burden for the patient; it may be performed fast by an experienced electro-radiologist and interpreted by a radiologist at the workstation. To achieve subtraction images on CEM an intravenous iodine contrast agent must be administered, which may be a contraindication for the examination in the case of patients with a history of allergic reactions, renal failure, or hyperthyroidism or it may be, in rare cases, life threatening due to the possibility of allergy to contrast agent. CEM applying intravenous contrast agent injection requires the patient’s preparation including restraining from food, and measuring TSH values and renal parameters before the procedure. These requirements might generate further contraindications. ABUS, however, does not require any patient preparation, and there are practically no contraindications to its performance – ABUS detects more lesions than CEM, but their clinical importance is lower than for CEM. ABUS more precisely describes focal lesions’ margins. which are dependent on the malignancy grade. ABUS is a multidimensional ultrasound method that enables focal lesion assessment on different planes by creating reconstructions at the workstations. Additionally, performance of CEM is connected with patient discomfort due to the necessary intravenous administration and potential negative sensations after contrast administration. However, ABUS is not a functional imaging in comparison to CEM, with post-contrast enhancement and its quantitative and qualitative assessment. ABUS allows us to assess a lesion’s size more accurately than CEM. The above study shows that both ABUS and CEM may pose a valuable additive tool for FFDM in screening. Concluding from the performed analysis, ABUS may be more suitable for introduction in screening than CEM due to its better accuracy parameters for the combinations ABUS + FFDM than ABUS + CEM, and due to the possibility of detecting more lesions, their characteristics, simplicity of performance, less burden for the patient, and no need for patient preparation.