Introduction
After the commencement of the COVID-19 pandemic in December 2019, numerous studies were conducted to explore its complications, specially focusing on cardiovascular involvement. However, the ability to conduct long-term follow-up was constrained by existing limitations. Among individuals who survived COVID-19, a substantial percentage encountered cardiovascular symptoms over a 60-day follow-up period: 21% expressed chest pain, 43% reported dyspnoea, and 53% described excessive fatigue [1-3], and throughout a 6-month follow-up, patients complained of continuous symptoms, of whom 63%, 26%, 9%, 6%, and 5% reported severe fatigue, dyspnoea, palpitations (including malignant arrhythmias), dizziness, and chest pain, respectively [3-5]. Also, in one-year follow-up, about 30% continued to report dyspnoea and approximately 7% complained of chest pain [6].
Studies on cardiac magnetic resonance (CMR) in recovered COVID-19 patients revealed various pathological findings. Among patients tested at a COVID centre, over 60% exhibited persistent myocardial inflammation on CMR more than 2 months after diagnosis [3,7]. For instance, in the study by Shi et al. [8] on 416 hospitalised patients with COVID-19, approximately 20% of individuals, with an average age of 64 years, exhibited evidence of myocardial injury, which was correlated with an increased risk of mortality. Also, in research by Rajpal et al. [9] on young athletes with mild COVID without hospitalisation, myocarditis was diagnosed in 15% of them through CMR.
Several pathophysiological mechanisms have been suggested to clarify myocardial injury in the context of COVID-19. These include direct viral invasion and damage from widespread systemic inflammation induced by immune system response (cytokine storm), resulting in a prothrombotic state involving coagulopathy, endotheliopathy, and vasculitis [10-12].
Myocarditis is recognised as a significant cause of myocardial injury. In a study comprising approximately 57,000 hospitalised COVID-19 patients, the prevalence of acute myocarditis, based on criteria for definite/probable/possible diagnosis, averaged 0.41%, with a range of 0.12% to 0.57% [13].
According to diverse studies, myocardial injury in COVID-19 patients is markedly correlated with mortality, autonomic dysfunctions, malignant arrhythmias, the need for mechanical ventilation, and administration of high-dose glucocorticoids during the treatment course of COVID-19 [14-17]. Conversely, very low concentrations of high-sensitivity cardiac troponin T (hs-cTnT < 6 ng/l) during admission have been associated with a reduced mortality risk [18].
Hence, acute myocarditis and myocardial injury in COVID-19 have become pivotal topics of discussion in numerous studies pertaining to the virus. Endomyocardial biopsy (EMB) is still regarded as the diagnostic gold standard for myocarditis. However, its application is restricted to cases with a high clinical suspicion, rapid disease progression, or when pathology results are essential for treatment decisions, given the procedure’s complications and the condition’s low prevalence [19,20].
CMR serves as a non-invasive and effective alternative to EMB for diagnosing myocarditis in individuals not undergoing biopsy [19,21]. MRI findings can determine the prognosis and outcomes in myocarditis, with biventricular dysfunction in CMR being notably associated with mortality and the requirement for heart transplantation [22]. The late gadolinium enhancement (LGE) patterns in CMR images and the percentage of LGE in myocardium are both significant factors in determining the prognosis, outcomes, and aetiology of myocarditis [23-25].
The objective of our study is to examine myocardial injury patterns in COVID-19-related myocarditis and contrast them with non-COVID-19 myocarditis, investigating disparities in outcomes and echocardiographic changes during one-year follow-up.
Material and methods
Study subjects and profiles
The current study, conducted as a historical cohort, involved 124 patients aged 12 to 80 years diagnosed with myocarditis (COVID-19 or non-COVID-19) who underwent CMR between 2018 and 2021 at 3 imaging centres (Rajaie Cardiovascular, Medical and Research Institute, Tehran, Iran; Emdadgaran Imaging Centre, Tehran, Iran; Abu-Ali Sina Charity Hospital, Shiraz, Iran). The exposure group consisted of 70 individuals with a definite history of COVID-19 infection within 4 weeks before the CMR date, as confirmed by positive COVID-19 RT-PCR and/or anti-SARS-CoV2-IGM/IgG titres, henceforth referred to as the “COVID group”. The control group, designated as the “non-COVID group” in this study comprised 54 individuals who had no prior exposure to the SARS-CoV-2 virus. These individuals were selected from those who underwent CMR between 2018 and 2019, before the onset of the COVID-19 pandemic in Iran.
Demographic data, CMR images details, and primary and follow-up echocardiographic information for the study population were systemically gathered. Telephone follow-ups were conducted to assess the incidence of major adverse cardiovascular events (MACE) (including cardiovascular [CV] mortality, CV re-hospitalisation, acute decompensated heart failure [ADHF], and arrhythmia requiring hospitalisation or pacemaker implantation) within a one-year period post-CMR, with documented events meticulously reviewed.
Exclusion criteria
Patients with prior history of myocarditis, myocardial infarction, significant flow-limiting coronary artery disease (CAD) (defined as more than 50% stenosis in coronary angiography or evidence of ischaemia in myocardial perfusion imaging), and those who were unattainable for follow-up were excluded from study. Patients in the COVID group were also excluded if the duration between COVID-19 infection and CMR exceeded 4 weeks, or if a definite confirmation of COVID-19 infection was lacking. Patients who expired during hospitalisation or within 4 weeks of symptom onset were excluded from the study.
Cardiac MRI
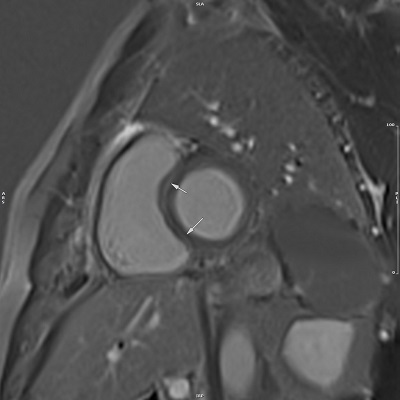
The imaging process was conducted using a 1.5 Tesla (Avanto Siemens Healthineers AG, Erlangen, Germany) MRI machine, obtaining images from short-axis, 2- and 4-chamber views. Intravenous injection of Gadovist (Gadobutrol 0.1 mmol/kg) was utilised to enhance imaging. By utilising T2-weighted STIR images from different views, myocardial oedema was diagnosed, while the identification of LGE was achieved through post-contrast T1-weighted images. Quantitative analysis of the images was performed by proficient radiologists (M.K. and H.P.) with expertise in cardiac MRI, and the diagnosis of myocarditis was based on the 2018 Lake Louise Criteria (LLC), which are noted for their higher sensitivity compared to the 2009 criteria [26].
The American Heart Association (AHA) 17 myocardial segments model [27] was utilised to depict the location of myocardial involvement in CMR images and to minimise interobserver variability; individuals were categorised into 5 groups based on the number of segments involved in the CMR images.
To minimise intraobserver and interobserver variability, qualitative data on ventricular dysfunction and enlargement severity were categorised into 2 groups: significant (moderate or more dysfunction/enlargement) and non-significant.
Statistical analysis
The analysis of the study data was conducted using SPSS 26 statistical software. The normal distribution of quantitative data was evaluated through the Kolmogorov-Smirnov test, reported as mean and standard deviation (SD) or median and interquartile range (IQR) based on the distribution. Qualitative data were presented in percentages.
To explore relationships between qualitative variables, the χ2 test was utilized. Additionally, for investigating differences in quantitative data between groups, we employed independent samples t-test for normally distributed data and Mann-Whitney U test for non-normally distributed data. To investigate ejection fraction (EF) changes between primary and follow-up echocardiography, the Wilcoxon signed-rank test was used.
Finally, survival data between the 2 groups were analysed and compared using Kaplan-Meier curve and Log Rank (Mantel-Cox) test, with a significance level of 0.05 maintained across all statistical tests and comparisons.
Ethical consideration
The study received approval from the Ethics Committee of Iran University of Medical Sciences, with the ID IR.IUMS.REC.1400.253.
During a follow-up phone call, patients were briefed on the research project goals, requested to cooperate, and asked for oral consent to use their medical information in the project. Only with their full consent is their information included.
In the republishing of research results, integrity and trustworthiness are maintained. The characteristics and information of the statistical population are treated with confidentiality and utilised exclusively for the research at hand.
Results
Descriptive analysis
A total of 372 patients were screened for the study, with 208 in the COVID group and 164 in the non-COVID group. Among them, 156 patients, 96 from the COVID group and 60 from the non-COVID group, met the diagnostic criteria (2018 LLC) for myocarditis in their CMR images. Thirty-two patients were excluded based on study criteria – 26 from the COVID group and 6 from the non-COVID group. This resulted in a final population of 124 patients, with 70 in the COVID group and 54 in the non-COVID group. All patients received treatment as per the established guidelines.
Within the COVID-19 group, the average time interval from infection to CMR date was 13.6 days, with a SD of 7.6 days. Demographic data, CMR findings of patients, as well as baseline and follow-up echocardiographic findings are summarised in Tables 1-3.
Table 1
Baseline demographic, clinical, electrocardiographic, and laboratory data
| COVID (n = 70) | Non-COVID (n = 54) | p-value | |
|---|---|---|---|
| Baseline demographic data | |||
| Gender, n (%) | |||
| Male | 33 (47.1) | 26 (48.1) | 0.944 |
| Female | 37 (52.8) | 28 (51.8) | |
| Age (years), mean (SD) | 38.9 (12.4) | 36.8 (13.2) | 0.164 |
| Possible aetiology, n (%) | |||
| COVID-19 | 70 (100) | – | |
| Idiopathic | – | 50 (92.6) | |
| Collagen vascular disease | – | 3 (5.6) | |
| Drug-induced | – | 1 (1.9) | |
| Clinical manifestations | |||
| Dyspnoea, n (%) | |||
| No | 15 (21.4) | 29 (53.7) | < 0.001 |
| NYHA class I-II | 38 (54.3) | 12 (22.2) | |
| NYHA class III-IV | 17 (24.3) | 13 (24.1) | |
| Chest pain, n (%) | 48 (68.6) | 41 (75.9) | 0.367 |
| Palpitation, n (%) | 47 (67.1) | 10 (18.5) | < 0.001 |
| Syncope/Presyncope, n (%) | 7 (10.0) | 2 (3.7) | 0.18 |
| Baseline ECG findings | |||
| Rhythm, n (%) | |||
| Normal sinus | 58 (87.9) | 48 (90.6) | 0.769 |
| Atrial | 1 (1.5) | – | |
| Atrial fibrillation | 1 (1.5) | 2 (3.8) | |
| Junctional | 2 (3) | 1 (1.9) | |
| Ventricular | 4 (6.1) | 2 (3.8) | |
| Tachycardia | 15 (22.7) | 4 (7.5) | 0.032 |
| Premature beats | 11 (16.4) | 5 (9.8) | 0.219 |
| AV block, n (%) | |||
| No AVB | 62 (93.2) | 52 (98.1) | 0.302 |
| First degree AVB | 1 (1.5) | 1 (1.9) | |
| Second degree AVB | – | – | |
| Complete AVB | 3 (4.5) | – | |
| Baseline laboratory findings | |||
| White blood cell count, median (IQR) | 7500 (6400-9000) | 8500 (6800-9900) | 0.264 |
| Lymphocyte count, mean (SD) | 2892 (1134) | 2132 (753) | 0.001 |
| Neutrophil count, mean (SD) | 4456 (2611) | 5812 (2210) | 0.037 |
| Erythrocyte sedimentation rate (ESR), mean (SD) | 21 (17) | 16 (15) | 0.359 |
| C-reactive protein (CRP), mean (SD) | 27.2 (30.9) | 26.3 (26) | 0.936 |
| High-sensitivity troponin I, median (IQR)* | 3200 (30-13,000) | 1460 (108-11,662) | 0.961 |
Table 2
Cardiac magnetic resonance findings
| COVID group (n = 70) | Non-COVID group (n = 54) | RR (95% CI) | p-value | |
|---|---|---|---|---|
| LVEF, median (IQR) | 52 (46-59) | 44.5 (33-52) | – | < 0.001 |
| LVSV (ml) | 79.1 (19.7) | 64.1 (21.6) | – | < 0.001 |
| LV mass index (g/m2) | 44.1 (38.6-50.7) | 53 (43-64) | – | 0.009 |
| Significant LV enlargement | 2 (2.9%) | 9 (16.7%) | 0.48 (0.34-0.69) | 0.007 |
| Significant LV systolic dysfunction | 14 (20%) | 23 (42.6%) | 0.57 (0.39-0.63) | 0.006 |
| RVEF, mean (SD) | 58.2 (7.5) | 44.7 (10.8) | – | < 0.001 |
| RVSV, mean (SD) | 77 (21.1) | 59.2 (21.5) | – | < 0.001 |
| Significant RV systolic dysfunction | 1 (1.4%) | 11 (20.4%) | 0.41 (0.31-0.56) | < 0.001 |
| LGE presence | 66 (94.3%) | 50 (92.6%) | 1.16 (0.56-2.39) | 0.704 |
| Number of segments with LGE | ||||
| No segment | 4 (5.7%) | 4 (7.4%) | – | 0.002 |
| 1-2 segments | 10 (14.3%) | 19 (35.8%) | ||
| 3-4 segments | 19 (27.1%) | 20 (37.7%) | ||
| 5-6 segments | 17 (24.3%) | 6 (11.3%) | ||
| > 6 segments | 20 (28.6%) | 4 (7.5%) | ||
| LGE location (based on AHA 17-segment model) | ||||
| Segment 1 | 2 (2.9%) | 8 (15.1%) | 0.49 (0.33-0.73) | 0.014 |
| Segment 2 and/or 3 | 46 (65.7%) | 18 (34%) | 2.1 (1.35-3.29) | < 0.001 |
| Segment 4 | 44 (62.9%) | 12 (22.6%) | 2.85 (1.67-4.88) | < 0.001 |
| Segments 5 and/or 6 | 51 (72.9%) | 28 (52.8%) | 1.6 (1.08-2.37) | 0.022 |
| Segment 7 | 2 (2.9%) | 8 (15.1%) | 0.49 (0.33-0.73) | 0.014 |
| Segment 8 and/or 9 | 46 (65.7%) | 17 (32.1%) | 2.22 (1.41-3.5) | < 0.001 |
| Segment 10 | 22 (31.4%) | 7 (13.2%) | 2.02 (1.03-3.99) | 0.018 |
| Segment 11 and/or 12 | 28 (40%) | 25 (47.2%) | 0.84 (0.56-1.27) | 0.427 |
| Segment 13 | 3 (4.3%) | 5 (9.4%) | 0.66 (0.37-1.19) | 0.252 |
| Segment 14 | 0 | 2 (3.8%) | 0.42 (0.34-0.51) | 0.101 |
| Segment 15 | 4 (5.7%) | 5 (9.4%) | 0.75 (0.4-1.41) | 0.433 |
| Segment 16 | 8 (11.4%) | 4 (7.5%) | 1.32 (0.57-3.02) | 0.473 |
| Segment 17 | 0 | 0 | – | – |
| LGE pattern | ||||
| Subepicardial | 50 (71.4%) | 41 (75.9%) | 0.87 (0.54-1.41) | 0.574 |
| Mid wall | 53 (75.7%) | 33 (61.1%) | 1.44 (0.97-2.13) | 0.08 |
| Subendocardial | 0 | 1 (1.9%) | – | 0.253 |
| Transmural | 0 | 0 | – | – |
| Patchy | 14 (20%) | 0 | – | < 0.001 |
| Linear | 34 (48.6%) | 7 (13%) | 3.31 (1.64-6.68) | < 0.001 |
| Diffuse | 4 (5.7%) | 2 (3.7%) | 1.31 (0.41-4.17) | 0.605 |
| T2 signal intensity ratio, mean (SD) | 1.3 (0.3)* | 0.7 (0.3) | – | < 0.001* |
| Abnormal STIR/T2-weighted image | 43 (78.2%)* | 42 (77.8%) | – | 0.959 * |
Table 3
Baseline and follow-up echocardiographic findings
The study groups displayed no significant differences in gender and mean age, while no statistically significant distinction was observed in terms of cardiovascular risk factors either. Clinical signs and symptoms, as well as abnormal ECG findings, dyspnoea, palpitation, fatigue, and tachycardia (heart rate > 100) were significantly higher in the COVID group (Table 1) (Supplementary Table 1).
CMR findings analysis
In CMR, the COVID group showed significantly better ventricular functional and volumetric indicators compared to the non-COVID group, with higher values for left ventricle ejection fraction (LVEF) (median [IQR]: 52% [46-59] vs. 44.5% [33-52], respectively; p < 0.001), LV stroke volume (mean [SD]: 79.1 ml [19.7] vs. 64.1 ml [21.6], respectively; p < 0.001), right ventricle ejection fraction (RVEF) (mean [SD]: 58.2% [7.5] vs. 44.7% [10.8], respectively; p < 0.001), and RV stroke volume (mean [SD]: 77 ml [21.1] vs. 59.2 ml [21.5], respectively; p < 0.001).
According to the study results, the COVID group exhibited significantly lower incidence of significant LV systolic dysfunction (14 individuals [20%] vs. 23 [42.6%]; RR [95% CI]: 0.48 [0.34-0.6]; p = 0.007) and significant RV dysfunction (1 patient [1.4%] vs. 11 [20.4%]; RR [95% CI]: 0.41 [0.31-0.56]; p < 0.001) following myocarditis compared to the non-COVID group. While the COVID-group had a lower incidence of significant LV enlargement (2 patients [2.9%] vs. 9 [16.9%]; RR [95% CI]: 0.48 [0.34-0.69]; p = 0.007), there was no significant difference in significant RV enlargement indices between the 2 groups.
In the study on LGE incidence, extent, location, and pattern, while the incidence was similar in both groups, the extent of myocardial involvement varied significantly based on the number of affected segments. The location of LGE within myocardial segments differed significantly between the 2 groups. In the COVID group, there was a higher involvement in septal, inferior, and lateral segments, while the non-COVID group showed increased incidence in anterior segments (Figure 1). The incidence of patchy and linear LGE patterns differed between the 2 groups, with significantly higher prevalence in the COVID group (Table 2) (Supplementary Table 2).

Baseline and follow-up echocardiographic findings analysis
Among the patients in the final study population, initial echocardiographic data were obtainable for 110 individuals (69 in the COVID group and 41 in the non-COVID group), while follow-up echocardiographic data was accessible for 63 patients (30 in the COVID group and 33 in the non-COVID group). The average interval between initial and follow-up echocardiography for patients with available data was 10 months for the COVID group, while in the non-COVID group it was 9 months (p = 0.308). Baseline and follow-up LVEF were significantly lower in non-COVID group (p = 0.014). While the difference in wall motion abnormality (WMA) between the two groups was not significant in baseline echocardiography, a significant disparity was observed in F/U echocardiography (p = 0.03). No significant differences were seen in other parameters (Table 3) (Supplementary Table 3).
Survival analysis
After one year of follow-up, there was no significant difference in the risk of MACE between the 2 groups. Table 4 summarises the incidence rate, relative risk, mean, and 95% confidence interval (CI) of event-free survival for each MACE component in both study groups.
Table 4
Incidence, relative risk, mean event-free survival, separated by major adverse cardiovascular events (MACE) components
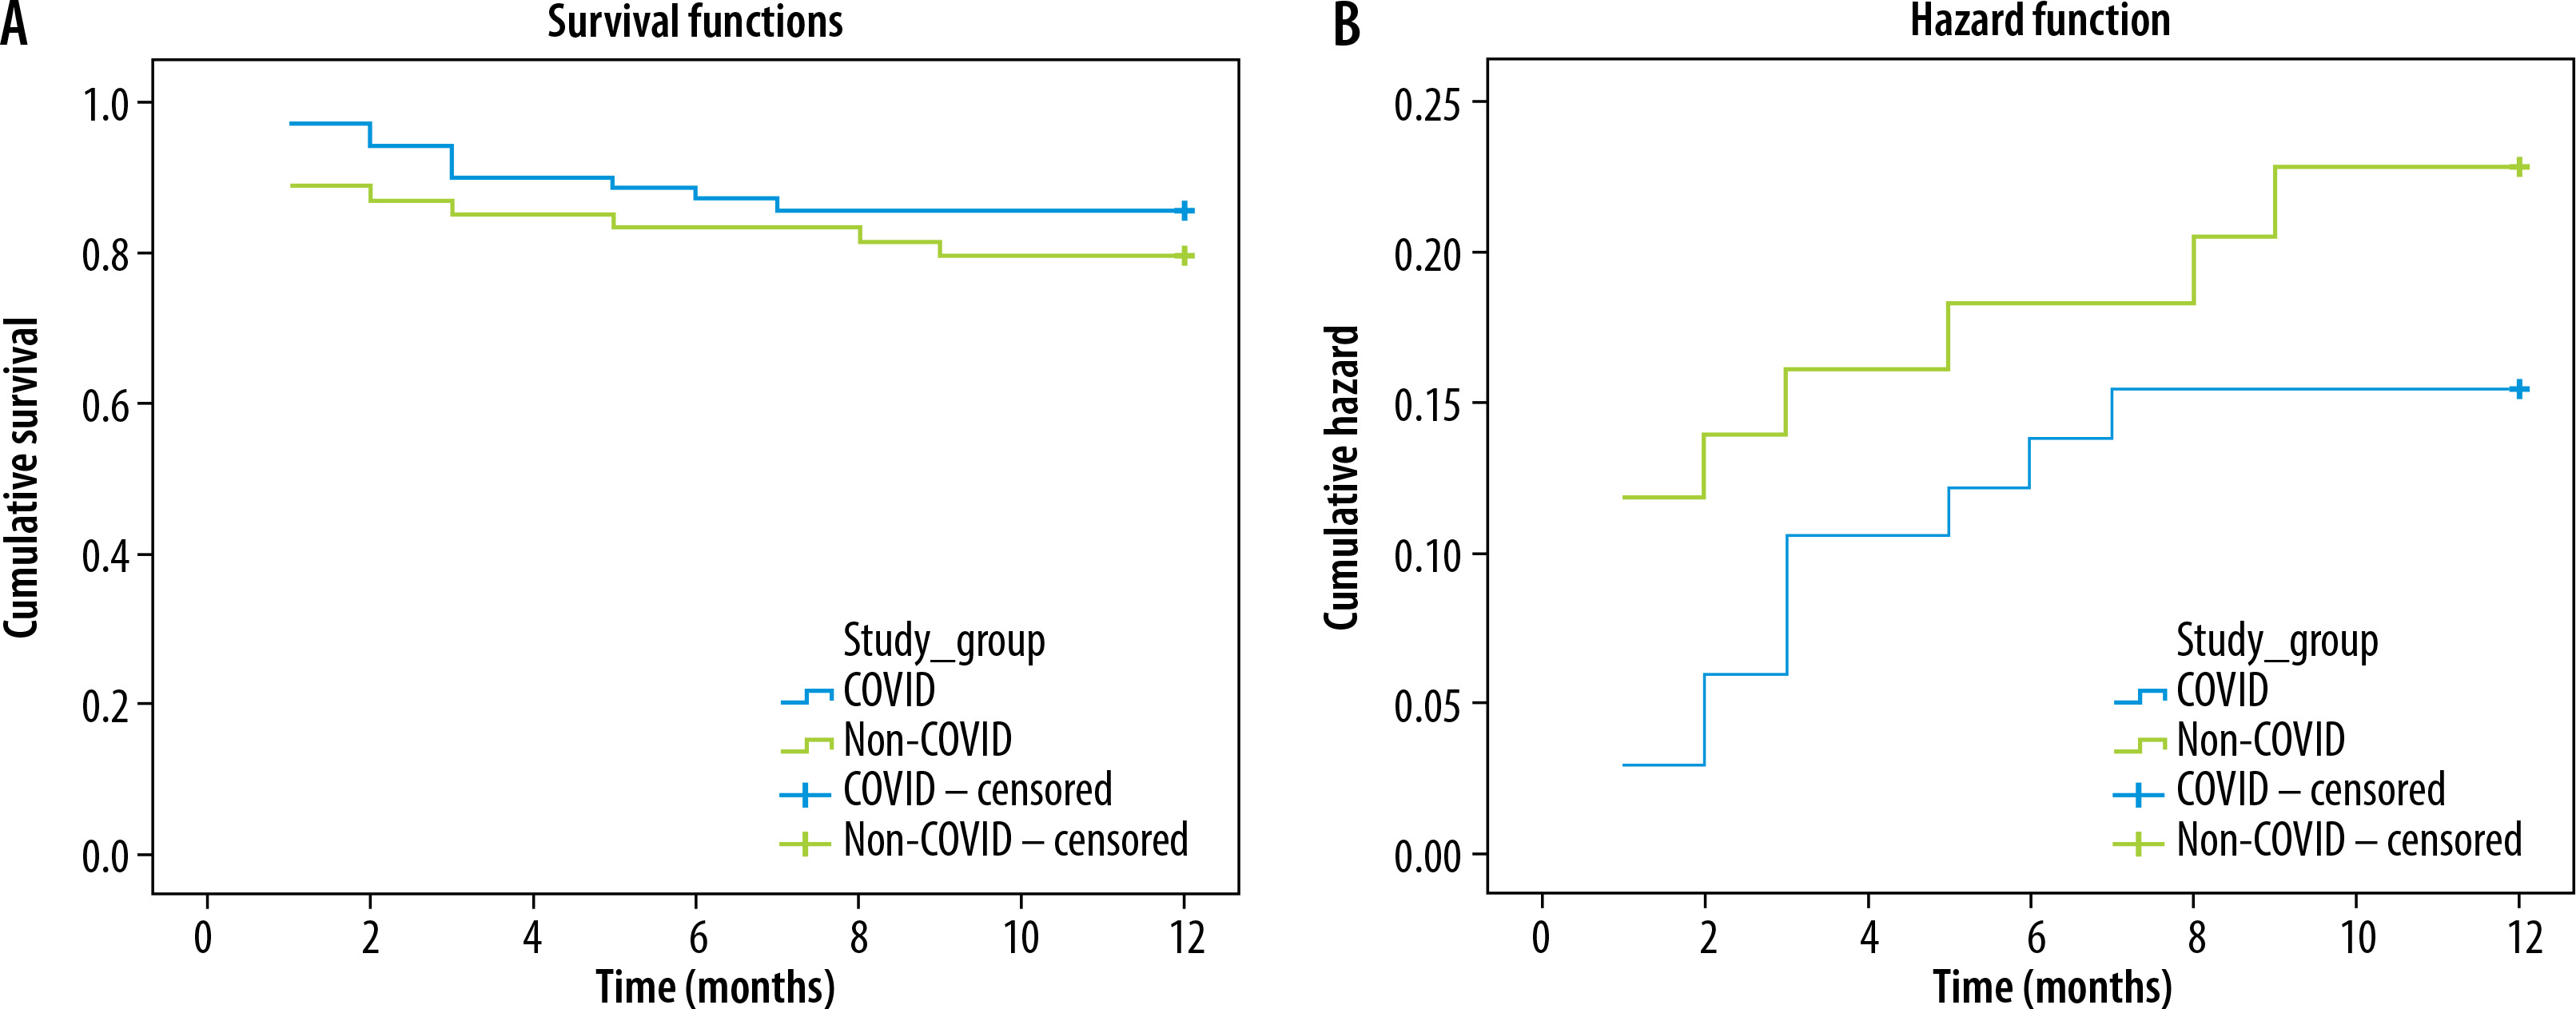
The mean event-free survival in the COVID group over one-year of follow-up was 10.7 (95% CI: 10.0-11.4), while in the non-COVID group it was 10.1 (95% CI: 9.1-11.1), showing no statistical significance (p = 0.353) (Figure 2).
Figure 2
Risk and Kaplan-Meier survival curves for major adverse cardiovascular events incidence, separated by study groups
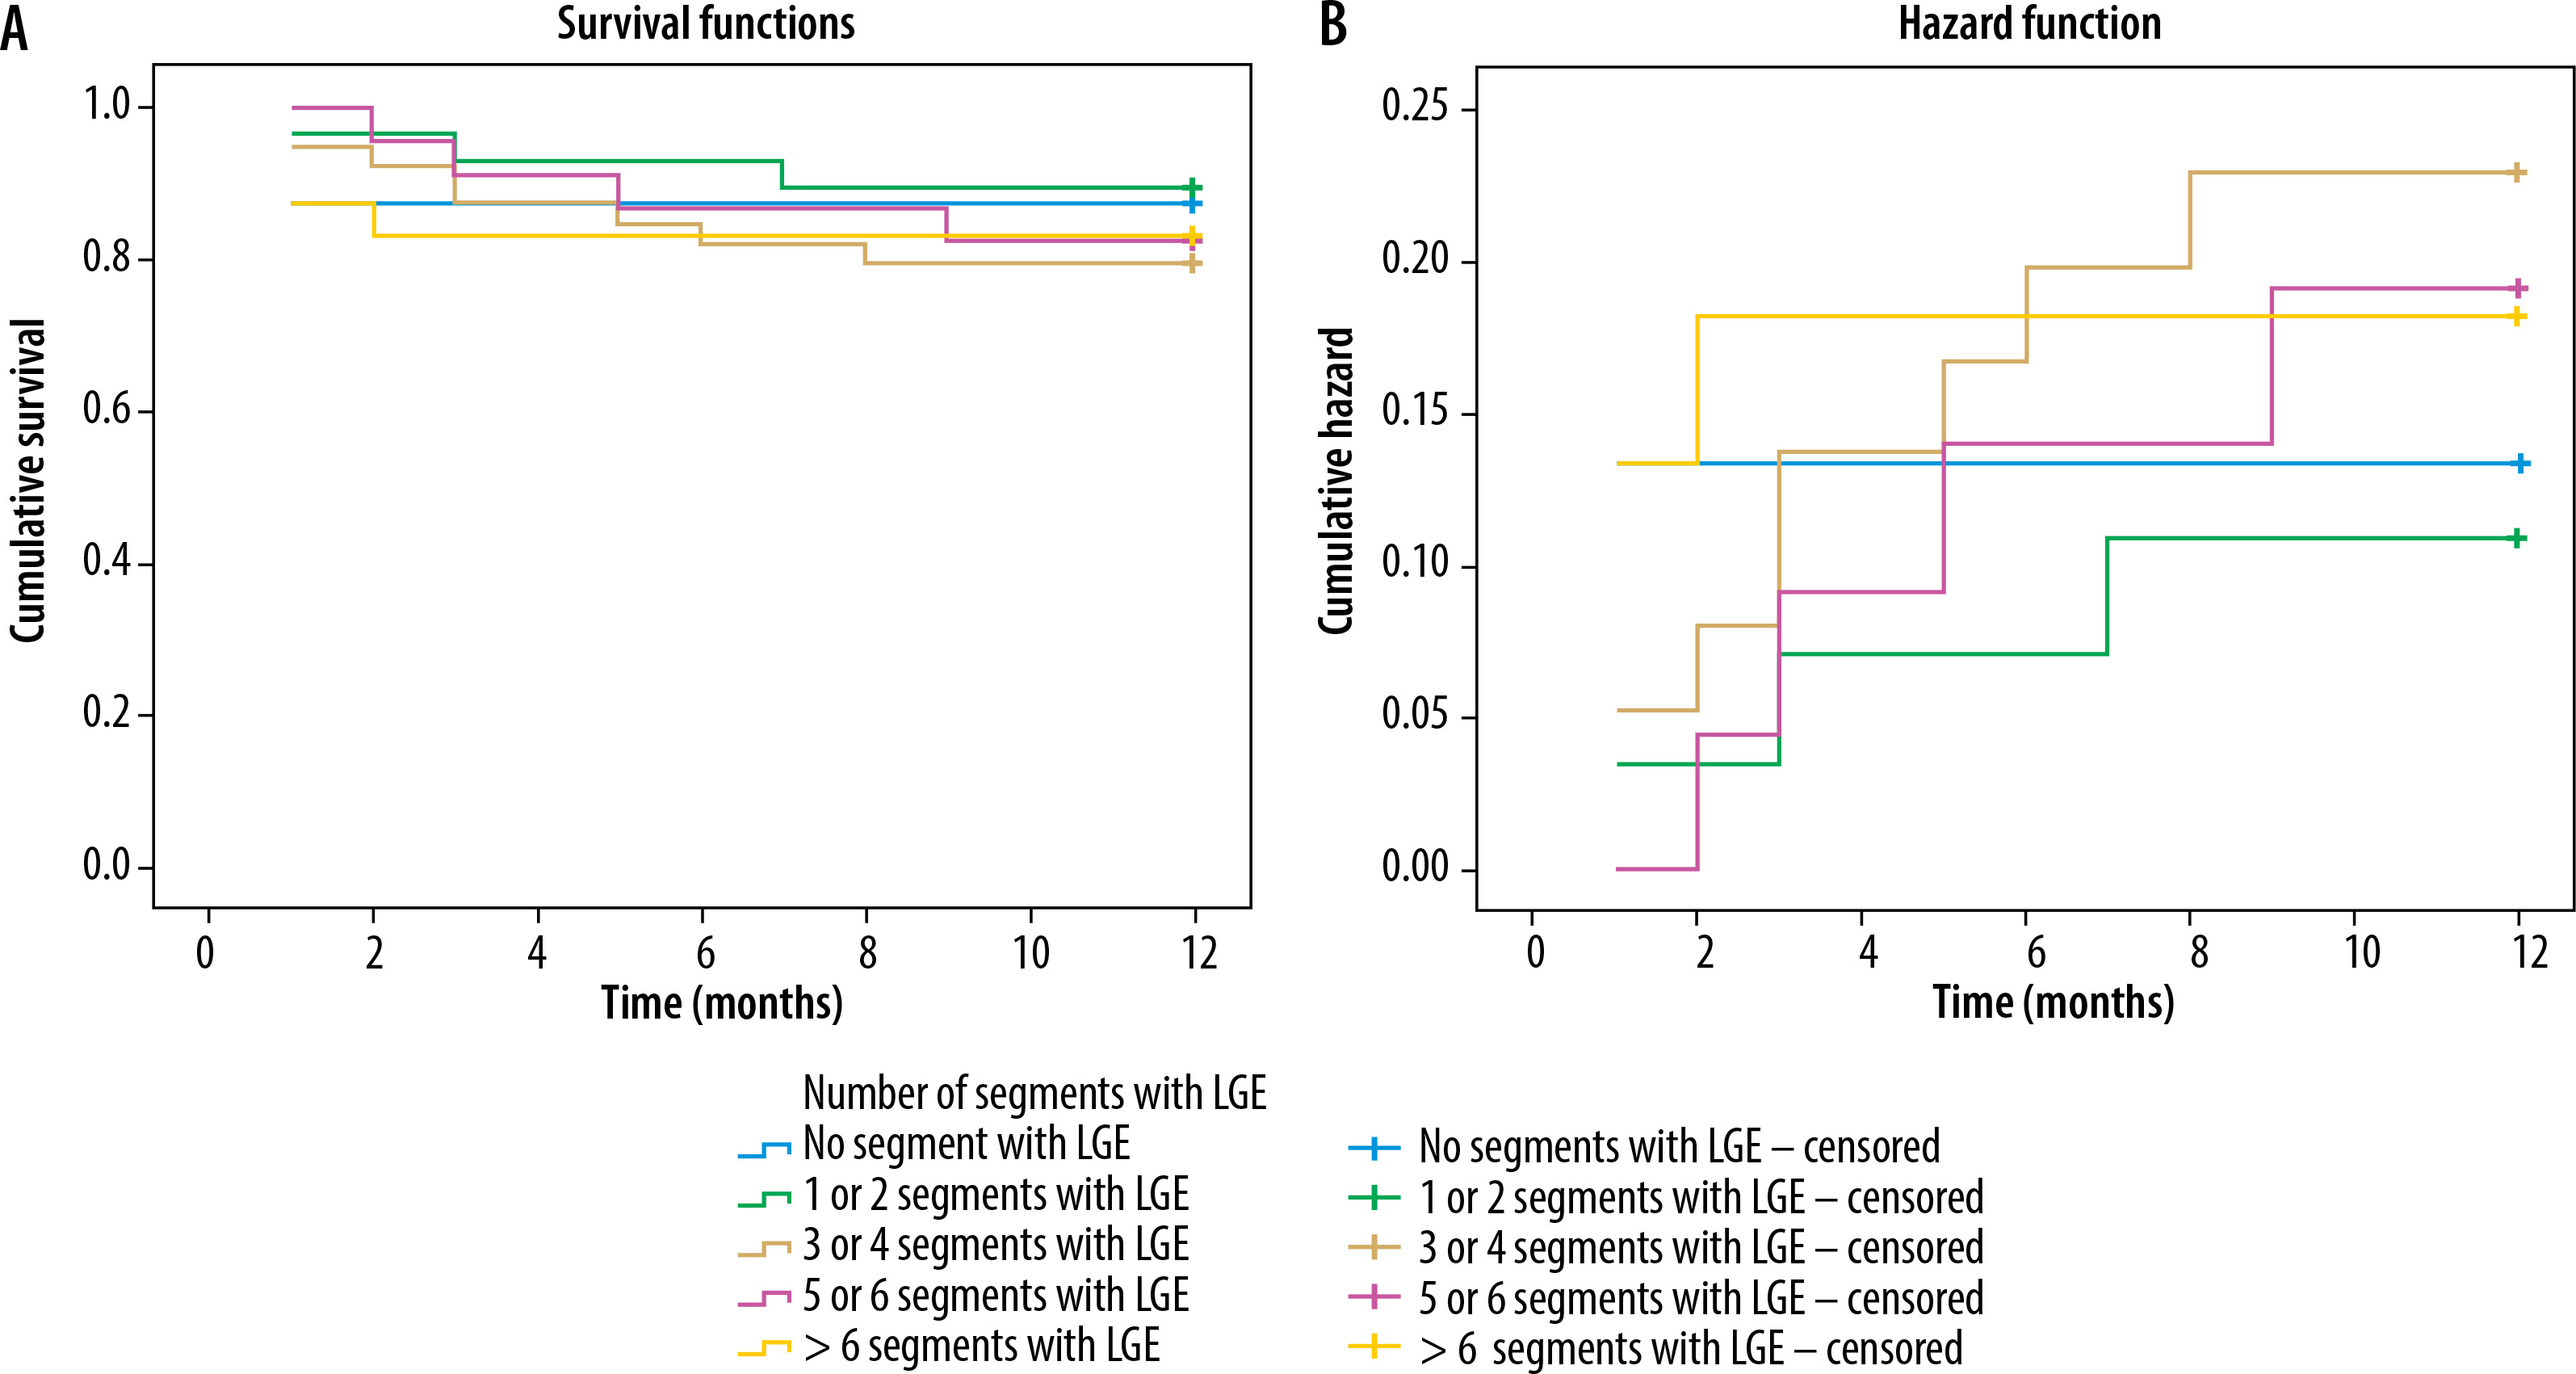
In the investigation of LGE extension in the myocardium, according to the number of involved segments in CMR, the mean MACE-free duration was 10.6 months for patients without LGE in any myocardial segments. This duration for individuals with LGE in varying numbers of segments in their CMR images (1-2, 3-4, 5-6, and > 6 segments) was 11.1, 10.2, 10.7, and 10.2 months, respectively, with no statistically significant differences observed (Figure 3).
Discussion
The current study, structured as a historical cohort, is one of the few longitudinal follow-ups where the entire patients were investigated for one year. The study focuses on exploring the relationship between myocarditis outcomes during this period and the extent of myocardial involvement. It also stands out in the COVID-related myocarditis field, as it includes an independent control group with non-COVID myocarditis for a comparative analysis of CMR findings.
Despite low incidence of myocarditis in the context of SARS-CoV-2 infection, its influence on disease prognosis and mortality was considered significant [13,28]. However, in the current study, no discrepancies were observed in the incidence of MACE or its individual components between the COVID and non-COVID myocarditis groups. Notably, given the disease’s complexity and varied complications, larger sample sizes and longer follow-ups are worth exploring [29].
In the study conducted by Haberka et al. [30], it was observed that LGE below 25% was more prevalent in the COVID group. Conversely, when LGE extended beyond 25% of the LV myocardium, the non-COVID group exhibited higher levels of LGE, but our study revealed that more than half of the COVID group had LGE in over 4 myocardial segments, a notably higher proportion compared to the non-COVID group. This finding suggests a broader extent of myocardial involvement due to myocarditis in the COVID group. However, in another study analysing the CMR data of 148 patients who had recently recovered from COVID, it was observed that among 40 patients with evidence of post-myocarditis injury, only 13% exhibited involvement of 4 segments or more with LGE [31]. In contrast to the study mentioned, our investigation within the COVID group indicated that the majority of patients (approximately 78%) had myocardial inflammation and active myocarditis, while a smaller proportion (around 22%) exhibited improving myocarditis and post-myocarditis injury without progressive inflammation. Given that the extent of LGE in COVID-19 patients can diminish over time [32,33], the disparity in LGE levels between our study and the mentioned study may be due to the notable difference in distribution of patients with active myocarditis and those in the recovery phase (post-myocarditis injury).
Previous studies demonstrated significantly higher septal involvement in COVID groups, a finding that is corroborated by our results. However, these studies also indicated greater lateral wall involvement in non-COVID groups [34]. In our findings, we observed that lateral wall involvement was higher in the COVID group, while anterior wall involvement was more pronounced in the non-COVID group. The similarities and differences observed in these findings should be evaluated in larger studies for a more comprehensive understanding.
The present study endeavoured to investigate the utility of CMR in predicting myocarditis outcomes and identifying high-risk manifestations. In contrast to prior studies [18,29], CMR findings in this study did not show any association with disease outcomes, including MACE and mean event-free survival. In a meta-analysis [24], the presence of LGE in anteroseptal segments, and LGE affecting more than 10% of cardiac muscle were associated with an increased risk of disease consequences. However, these factors did not impact prognosis in the present study.
Based on our study’s findings, which occasionally diverge from existing literature, and considering the exceptional circumstances surrounding article publication during the COVID-19 pandemic, a comprehensive review and further research in this area appear warranted.
Conclusions
Despite the disparity in CMR findings between the COVID and non-COVID groups – with the non-COVID group displaying more anterior segment involvement and biventricular failure, and the COVID group exhibiting greater myocardial involvement – there was no significant divergence in terms of MACE and event-free survival post-diagnosis.