Introduction
Renal cell carcinoma (RCC) constitutes the most common primary malignancy of the kidney and has an 80-90% incidence rate among all renal neoplasms [1]. In recent years, there has been a steady increase in the prevalence of RCCs due to improved tumour detection, and this can be partly explained by the greater availability and widespread use of high-resolution cross-sectional imaging modalities. The tumour has a peak incidence between the 6th and 7th decades of life and shows a 1.5 : 1 predominance in men over women [2].
The 2004 World Health Organization (WHO) Classification of adult renal tumours categorizes RCCs into 3 main histological subtypes of which clear cell, papillary, and chromophobe tumours account for 70%, 10-15%, and 5%, respectively [3]. Although many new histological subtypes were added in the new 2016 WHO renal tumour classification, these 3 main types still constitute the largest proportion of renal tumours [4]. Histological subtype differentiation of RCC is of crucial importance because each tumour subtype shows a different prognosis and has variable tumour behaviour. Clear cell RCC (ccRCC) has been proven to be the most aggressive subtype of RCC compared to papillary RCC (pRCC) and chromophobe RCC (cRCC), which is considered as the least aggressive subtype [5]. ccRCC shows increased vascularization and has a predilection for early metastasis and vascular invasion; hence, it has a poorer prognosis than the other subtypes [6]. On the other hand, pRCCs manifest themselves as the most common multifocal and bilateral renal tumours [7].
Recent studies have postulated that the main histological subtypes of RCC can non-invasively be differentiated from each other by using imaging modalities. Accurate subtype differentiation of RCC has valuable prognostic and therapeutic implications, and therefore knowledge of imaging characteristics of ccRCC, pRCC, and cRCC is crucial. Multidetector computed tomography (MDCT) is widely available and is accepted as the diagnostic modality of choice in the detection of RCC. It has improved spatial and temporal resolution and enables us to examine large patient volume coverage by using thin slices and fast scanning times [2]. Furthermore, dynamic MDCT examination using unenhanced images prior to one or more post-contrast phases is performed as a dedicated study of known renal masses [8]. It has also been shown that dynamic multiphase CT examination can play an important role in the subtype differentiation of RCC. Also, magnetic resonance imaging (MRI) using T2 signal intensity characteristics can provide useful information about the discrimination of distinct histological subtypes of RCC.
In this study, our aim was to investigate the usefulness of dynamic MDCT using unenhanced and cortico-medullary phase images and T2-weighted fast spin echo (FSE) MRI in the differentiation of the main histologic subtypes of RCC based on the histopathological results of the tumours. Mean tumour attenuation values on unenhanced and cortico-medullary phase CT and mean signal intensity characteristics on FSE T2-weighted MRI images were evaluated quantitatively, and qualitative visual assessment of the tumours was also performed in both modalities. Following this procedure, these 2 modalities were compared in terms of enabling subtype histological differentiation of RCC.
Material and methods
Patients
Hospital Institutional Research Ethics Board Committee approval was not required, and informed patient consent was not waived due to the retrospective nature of the study. From March 2014 to July 2019, all patients were retrospectively investigated who had been diagnosed as RCC on our picture archiving and communication system (PACS Medical workstation, Siemens Medical Systems, Erlangen, Germany). After applying our exclusion criteria regarding tumour diameter less than 1 cm, inadequate image quality, loss of pathology records, incomplete study, etc., a total of 80 pathologically proven RCC patients who had undergone either partial or total nephrectomies were enrolled in the study. Among the patients based on their pathology results, RCC histological subtypes consisted of 54 ccRCC, 15 pRCC, and 11 cRCC. There were 62 male (%77.5) and 18 female (%22.5) patients. Among the 54 ccRCC patients, 29 had both non-contrast and cortico-medullary phase CT, 1 had only non-contrast CT, 5 had only cortico-medullary phase CT, and 38 had MRI examination. In the pRCC group, 10 patients had both non-contrast and cortico-medullary phase CT, 1 had only non-contrast CT, 1 had only cortico-medullary phase CT and 12 patients had MRI. Finally, in 11 cRCC patients, 9 had both non-contrast and cortico-medullary phase CT, and only 5 had MRI.
CT technique
All CT examinations were performed using a 128-detector row helical CT scanner (Somatom Sensation 16, Siemens Medical Systems, Erlangen, Germany). CT images were obtained during patient breath-hold using the following parameters: 120 kVp, variable tube current (150-250 mAs), slice thickness 5 mm, and reconstruction interval 2 mm. All patients underwent pre-contrast, cortico-medullary, and nephrographic phases. First an unenhanced CT scan was performed. Then, contrast-enhanced CT images were obtained following administration of 100-150 ml of non-ionic contrast material (Ultravist 300, Iopromide injection 300 mg/ml) by using a power injector at a rate of 2-4 ml/s. The scan delay times were 30-45 s for the cortico-medullary phase and 70-90 s for the nephrographic phase, respectively. Cortico-medullary phase images were considered when a conspicuous enhancement difference was seen between the renal cortex and medulla.
Computed tomography analysis
All image analyses and quantitative measurements were performed at our PACS by the same experienced abdominal radiologist (A.M.H.), who was blinded to the patients’ pathology results. In 3 histologically different subtype RCC patients, in order to evaluate attenuation values, region-of-interest (ROI) areas were placed on normal-appearing renal cortex and tumour mass, on both unenhanced and cortico-medullary phase images. For renal cortex measurements a standard size of 20 mm2 ROI was applied. For tumour measurements, an approximately same sized ROI covering two-thirds of the mass was applied on both phases. In order to measure a maximum degree of tumour enhancement, the most enhanced solid portion of the tumour was chosen while avoiding cystic and necrotic regions as much as possible. Additionally, whole tumour mass attenuation measurements were performed on both phases by applying ROI areas comprising the complete tumour lesion presenting with the largest diameters on the image. Hence, mean attenuation values of the tumour including whole lesion and renal cortex were calculated on unenhanced and cortico-medullary phase CT images and quantified as Hounsfield units (HU). Qualitative evaluation of all tumours was also performed based on visual assessment, and they were classified as either homogenous or heterogenous depending on their contrast enhancement pattern.
Magnetic resonance imaging technique
All images in our study were obtained using a 12-channel phased-array torso coil on a 1.5-tesla clinical scanner (Avanto- SQ Engine, Siemens, Erlangen, Germany). We evaluated T2-weighted FSE sequence using TR: 7500 msec, TE: 85 msec, echo train length (ETL): 20, Nex: 1, and bandwidth: 260 Hz, on the axial or coronal plane.
Magnetic resonance imaging analysis
All quantitative measurements on T2-weighted FSE sequences were performed at our PACS by the same abdominal radiologist (A.M.H.), who was unaware of the pathology results. For each patient a circular ROI was placed on the tumour and normal renal cortex on T2-weighted FSE image. A standard ROI of 20 mm2 was used for renal cortex measurements. Similarly to the CT evaluation, again a ROI covering two-thirds of the mass and also the whole tumour was applied while avoiding cystic and necrotic areas as much as possible. These measurements were performed on the images where the largest tumour diameters were present. Thus, mean signal intensity measurement values of the tumour including whole lesion and renal cortex were calculated. Finally, as with CT, all tumours were subjected to visual assessment and were again classified as either homogenous or heterogenous based on their appearance on T2-weighted images.
Pathological diagnosis
All the patients in this study had undergone either partial or total nephrectomy. Following this procedure, all tumour specimens were evaluated by an experienced genitourinary pathologist (A.A.O.). RCC subtype histological differentiation was performed according to WHO 2016 classification. The WHO/ISUP grading system was used for the grading of clear cell and papillary RCCs.
Statistical analysis
The SPSS 15.0 Windows program was used for statistical analysis. In each RCC subtype group, differences in sex distribution were evaluated by the Ki-square test and age difference with the ANOVA test. Mean tumour diameter differences in each subtype RCC group and the evaluation of the differences between patient subgroups were interpreted using the Kruskal-Wallis test. Analysis of the subgroups was done with the Bonferroni correction using the Mann-Whitney U test.
Results
Eighty patients (61 males and 19 females) were included in this study. Regarding the sex distribution of these patients according to each tumour subtype, while the clear cell carcinoma group consisted of 40 males and 14 females, chromophobe and papillary carcinomas comprised 8 males and 3 females, and 13 males and 2 females, respectively. The mean age of all patients was 56.78 ± 11.13 years (age range: 22-80 years). The mean age of the 3 tumour subtypes were calculated as follows: ccRCC 55.81 ± 11.58 (age range: 22-80) years, cRCC 53.18 ± 7.22 (age range: 37-64) years, and pRCC 62.93 ± 10.00 (age range: 48-79) years. Forty-five tumours were located on the right kidney and 35 tumours were on the left (clear cell type 30 right, 24 left; chromophobe type 6 right, 5 left; and papillary type 9 right, 6 left). Tumour mean diameter was calculated as 55.92 ± 3.07 mm for ccRCCs and 61.09 ± 3.81 mm and 38.26 ± 2.29 mm for chromophobe and pRCCs, respectively. No statistically significant differences were found in the location, sex, and age distribution of the 3 subtype RCC patients. In terms of mean diameters for each tumour subtype, although the papillary ones seemed smaller than the other 2 subtypes, this had no statistically significant difference, either. On diffusion-weighted imaging (DWI) using b values of 0 and 800 mm2/s, ccRCCs exhibited higher mean apparent diffusion coefficient (ADC) values (1.347 × 10⁻³ mm2/s) than cRCC (1.03 × 10⁻³ mm2/s) and pRCC (0.667 × 10⁻³ mm2/s). Although a statistically significant difference was found between ccRCCs and other type RCCs, no statistically significant difference was observed between cRCC and pRCC patients.
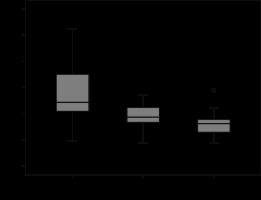
The mean attenuation values of each RCC subtype, including renal cortex values, both on pre- and post-contrast MDCT images, were analysed in Tables 1, 2, and 3. No statistically significant difference was found among the mean attenuation values of the 3 tumour subtypes on pre-contrast CT images. The tumour attenuation values of each subtype also did not show a marked difference from normal renal cortex values on pre-contrast images. However, on post-contrast CT images, ccRCC demonstrated a prominent degree of contrast enhancement compared to the chromophobe and papillary ones (Figure 1). Regarding the chromophobe and papillary subtypes, no statistically significant difference was found in terms of the degree of tumour enhancement between 2 subtypes, but chromophobe tumours showed slightly higher attenuation values than those of papillary tumours (Figures 2-4). When we compared the degree of each tumour subtype enhancement to the normal enhancing renal cortex, while clear cell type tumours demonstrated a degree of contrast enhancement close to the renal parenchyma, the other 2 subtypes showed significantly lower enhancement. In a comparison of mean attenuation values of tumour ROI and whole tumour measurements, the obtained HU values did not exhibit any significant difference for the 3 subtypes of RCC both on pre- and post-contrast CT images (Figure 5). Qualitative evaluation of each tumour subtype based on visual assessment on post-contrast CT images revealed that 28 out of 35 clear cell carcinomas showed heterogenous enhancement while 7 had a homogenous appearance (Figure 1). In 9 cases of chromophobe carcinomas, 4 had a heterogenous and 5 had a homogenous enhancement pattern (Figure 2). However, in the papillary subtype only 2 cases showed a heterogenous appearance, while 11 cases exhibited a homogenous contrast enhancement (Figure 3). In clear cell cases, the appearance was mostly heterogenous, whereas in papillary type carcinomas this was mostly homogenous. In chromophobe carcinoma cases an almost equal distribution was observed. These results showed statistically significant differences. As a result, we can claim that most clear cell carcinomas exhibit heterogenous contrast enhancement on cortico-medullary phase CT images in contrast to the papillary subtypes which usually have a homogenous appearance, based on our visual evaluation.
Table 1
Mean attenuation values of clear cell renal cell carcinoma patients on non-contrast (NC-CT) and contrast-enhanced CT (CE-CT) images
Table 2
Mean attenuation values of chromophobe renal cell carcinoma patients on non-contrast (NC-CT) and contrast-enhanced CT (CE-CT) images
Table 3
Mean attenuation values of papillary renal cell carcinoma patients on non-contrast (NC-CT) and contrast-enhanced CT (CE-CT) images
Figure 1
A 43-year-old-woman with left clear cell type renal cell carcinoma (RCC). A) A pre-contrast axial computed tomography (CT) scan shows a 37 × 31 mm in diameter mass lesion in the mid-anterior portion of the left kidney with an attenuation value of 41.51 HU. A circular ROI covering two thirds of the lesion was used for measurements from tumour and normal renal cortex. B) On cortico-medullary phase contrast-enhanced CT, the attenuation value of the tumour was measured as 75.16 HU. On visual assessment, tumour shows a heterogenous enhancement. C) On pre-contrast CT scan, whole tumour measurement yielded a 37.19 HU value. D) Whole tumour value on contrast-enhanced CT calculated as 71.10 HU. Tumour shows relatively high HU values that can be compared to the normal enhancing renal cortex. E) FSE T2-weighted axial magnetic resonance (MR) image shows high mean signal intensity value of the tumour measuring 460.72. A circular ROI covering two-thirds of the lesion was used and also renal cortex signal intensity was measured as 420.88. Tumour has a higher signal intensity than the normal renal cortex. F) FSE T2-weighted axial MR image demonstrates whole tumour and renal cortex measurements. 434.83 and 420.88 signal intensity values were obtained, respectively. Tumour has a heterogenous signal intensity similar to that of CT. G) Clear cell RCC. Nests of clear cells surrounded by prominent interconnecting vascular framework. H&E ×20
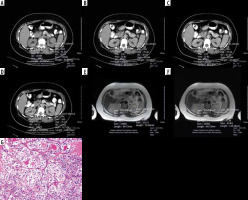
Figure 2
A 47-year-old-man with left chromophobe renal cell carcinoma (RCC). A) A pre-contrast axial computed tomography (CT) scan reveals a mass lesion with a size of 91 × 76 mm located in the midlateral portion of the left kidney. A circular ROI was placed for measurement and the tumour exhibited an attenuation value of 40.41 HU. B) On cortico-medullary phase contrast-enhanced CT, again the attenuation value of the tumour was calculated, which increased to 57.84 HU. The tumour had heterogenous enhancement. C) On pre-contrast CT scan, obtained whole tumour measurement was 40.00 HU. D) On contrast-enhanced CT scan the whole tumour measurement calculated as 53.64 HU. The tumour had lower HU values than the normal enhancing renal cortex. E) FSE T2-weighted axial magnetic resonance (MR) image demonstrates a tumour mean signal intensity value of 288.48. Renal cortex signal intensity was measured as 327.90. The tumour shows a lower signal intensity than the renal cortex. F) FSE T2 weighted axial MR image reveals whole tumour and renal cortex signal intensity measurements. The tumour had a 298.75 signal intensity value, which is lower than the renal cortex. It has heterogenous appearance. G) Chromophobe RCC. Solid sheets of clear and eosinophilic cells with hyperchromatic irregular nuclear membranes and perinuclear halos. H&E ×20
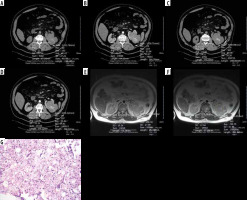
Figure 3
A 48-year-old-man with right papillary renal cell carcinoma (RCC). A) On pre-contrast axial computed tomography (CT) scan a mass lesion with a size of 71 × 34 mm in the mid-portion of the right kidney is seen. It has a 32.51 HU attenuation value. B) On cortico-medullary phase contrast-enhanced CT scan, the attenuation value of the tumour was calculated as 38.89 HU. The tumour had homogenous enhancement. C) On pre-contrast CT scan, whole tumour measurement was calculated as 33.61 HU. D) On contrast-enhanced CT scan the whole tumour exhibited 41.05 HU. The tumour showed prominently lower HU values than the normal enhancing renal cortex. E) FSE T2-weighted axial MR image demonstrates a relatively low mean signal intensity value of 233.08. Renal cortex signal intensity was 406.90 and the tumour had a conspicuous lower signal intensity value than the renal cortex. F) FSE T2-weighted axial MR image reveals whole tumour and renal cortex signal intensity measurements. The tumour showed a signal intensity value of 249.58. Renal cortex intensity was 392.06 and higher than the tumour. The tumour exhibits a homogenous appearance similar to that of CT. G) Papillary RCC. Prominent papillary architecture and abundant foamy macrophages in the papillary cores. H&E ×20
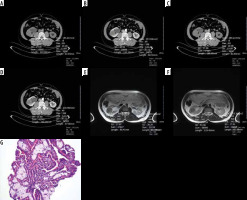
Figure 4
Box and whisker plots of contrast-enhanced computed tomography ROI measurements of clear cell, chromophobe, and papillary carcinoma subtypes presented as Hounsfield units
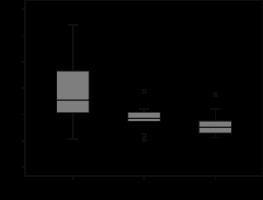
Figure 5
Box and whisker plots of contrast-enhanced computed tomography whole tumour measurements of clear cell, chromophobe, and papillary carcinoma subtypes presented as Hounsfield units
The MR T2 signal intensity values of each RCC subtype, including renal cortex values on FSE T2-weighted images are analysed in Tables 4, 5, and 6. T2 signal intensity values of ccRCC were found to be significantly higher than both chromophobe and papillary subtypes. It also showed a higher signal intensity than normal renal parenchyma (Figure 1). Although the chromophobe subtype RCC showed a prominent lower T2 signal intensity than the clear cell subtype, no statistically significant signal intensity difference was found between chromophobe and papillary subtypes (Figure 2). Chromophobe subtype RCC had a slightly lower T2 signal intensity than normal renal parenchyma. The papillary subtype RCC had a significantly lower T2 signal intensity than ccRCC and a similar T2 signal intensity value as the chromophobe subtype (Figures 3 and 6). The papillary subtype showed a prominently lower signal intensity value than the renal cortex compared to the other 2 subtypes. In a comparison of T2 signal intensity values of tumour ROI and whole tumour measurements, signal intensity values did not show a significant difference for 3 subtypes of RCC on FSE T2-weighted images (Figure 7). Qualitative evaluation of each tumour subtype based on visual assessment on FSE T2-weighted images yielded that among 38 clear cell carcinoma patients, 25 showed a heterogenous and 13 a homogenous appearance (Figure 1). In chromophobe carcinomas, 3 showed a heterogenous and 2 a homogenous signal intensity (Figure 2). Finally, in papillary tumours, 10 patients had a homogenous signal intensity and only 2 a heterogenous appearance (Figure 3). These results showed that papillary subtype tumours have a mostly homogenous appearance on T2-weighted images, and therefore a statistically significant difference was found compared to the other tumour subtypes on visual assessment. No significant difference was found on the visual assessment of clear cell and chromophobe subtypes.
Figure 6
Box and whisker plots of MR ROI measurements of clear cell, chromophobe, and papillary carcinoma subtypes presented as T2 signal intensity values
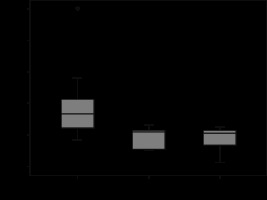
Figure 7
Box and whisker plots of MR whole tumour measurements of clear cell, chromophobe, and papillary carcinoma subtypes presented as T2 signal intensity values
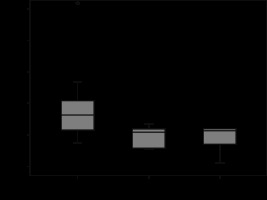
Table 4
T2 signal intensity values of clear cell RCC patients on T2-weighted FSE images
Table 5
T2 signal intensity values of chromophobe RCC patients on T2-weighted FSE images
Table 6
T2 signal intensity values of papillary RCC patients on T2-weighted FSE images.
Discussion
In RCC patients, tumour histologic subtype, initial stage of tumour, and histopathological nuclear grading are considered to be the 3 most important prognostic factors [2]. Hence, it is important to distinguish RCC histological subtypes by performing cross-sectional imaging modalities instead of invasive procedures.
In our study, we investigated the utility of both dual-phase MDCT and T2-weighted FSE MRI in the discrimination of RCC histological subtypes. Although there are many studies in the literature using either CT or MRI for subtype differentiation of RCC patients, to our knowledge this is the first study using both modalities simultaneously on the same patient cohort in terms of investigating their influence on this topic.
In the discrimination of RCC subtypes, CT findings have been shown to display a good correlation with the histopathological characteristics of the tumours. The most prominent parameter among these criteria has proven to be the degree of tumour enhancement [9,10]. Therefore, a baseline unenhanced CT acquisition is inevitable in order to measure the degree of tumour enhancement on post-contrast images.
In their study, Pooler et al. did not find any significant attenuation value difference between the pathologically proven RCC histological subtypes on unenhanced CT images [11]. Similarly to that study, we also did not find important differences of attenuation values between the 3 main histological subtype RCC patients on unenhanced CT images.
Bata et al. in their study evaluated the degree of tumour enhancement on both cortico-medullary and nephrographic phases by using both small ROIs and whole tumour attenuation values for evaluation. The cohort comprised 20 ccRCC and 15 pRCC patients. They showed that ccRCC had significantly higher attenuation difference and attenuation ratio values than pRCC on both phases and pRCC usually appeared as a less enhancing lesion, compared to the normal enhancing renal cortex [10].
Chen et al. performed a whole lesion quantitative CT evaluation on 46 ccRCC and 15 pRCC patients. They demonstrated that the mean and median whole lesion enhancement of ccRCC was significantly higher than that of pRCC on all post-contrast phases [12]. Chen et al. and some other authors claimed that whole lesion evaluation would be beneficial in the quantification of tumour heterogeneity and hence could clarify differential tumour behaviour [13].
In a larger patient population including 89 ccRCC and 16 pRCC patients, Ruppert-Kohlmayr et al. [14] evaluated enhancement differences of 2 types of tumours on post-contrast CT images. In the cortico-medullary phase, they found that attenuation values of ccRCC (152.6 ± 35.4 HU) were significantly higher than those of pRCC (61.8 ± 24.4 HU) (p < 0.05). In the nephrographic phase, a prominent difference was also present between 2 subtype tumours, measuring (105.1 ± 17.5 HU) for ccRCC and (67.3 ± 14.4 HU) for pRCC, respectively (p < 0.05).
Gomes et al. investigated the usefulness of a single-phase cortico-medullary contrast-enhanced CT in the discrimination of RCC subtypes in a cohort consisting of 53 ccRCC, 15 cRCC, and 11 pRCC patients. Although in agreement with other multiphasic CT studies in the literature, they obtained a significantly lower mean quantitative tumour percentage enhancement (TE) and tumour-to-cortex enhancement (TCI) values for pRCC compared to ccRCC and cRCC patients, but they were unable to differentiate ccRCC patients from cRCC patients by using these quantitative enhancement indexes [15]. Jung et al. examined 114 ccRCC, 17 cRCC, and 18 pRCC patients and showed that the ccRCC patients demonstrated the highest contrast enhancement and also heterogeneity of contrast enhancement, followed by cRCC and pRCC patients. They found a significant enhancement difference between the ccRCC and pRCC in the cortico-medullary phase and between ccRCC and other types in the nephrographic phase. There was a significant difference in the heterogeneity of enhancement between ccRCC and other subtypes on cortico-medullary phase images [16].
In a dynamic contrast-enhanced study performed by Lee-Felker et al. including 86 ccRCC, 10 cRCC, and 36 pRCC patients, it was shown that ccRCC patients had significantly higher maximum attenuation values than pRCC patients on all post-contrast phases and, again, significantly higher values than cRCC patients on the nephrographic and excretory phases [17]. Contrary to the study by Young et al. [9], they showed that cRCC patients exhibited maximal tumour enhancement on the cortico-medullary phase rather than the nephrographic phase.
Kim et al. in their multi-phasic CT study described an absolute attenuation threshold value of 84 HU between unenhanced and cortico-medullary phase CT, and by applying this, they were able to discriminate ccRCC patients from other RCC subtype patients with 74% sensitivity and 100% specificity [18]. Young et al. also similarly described attenuation cut-off values for the cortico-medullary phase images on multi-phasic contrast-enhanced CT. They used 106 HU, 55 HU, and 75 HU in this order for the discrimination of ccRCC patients from those of oncocytoma, pRCC, and cRCC and obtained accuracy values of 77%, 85%, and 84%, respectively [9].
In our study, consistent with other studies in the literature, ccRCC patients showed a higher degree of contrast enhancement on cortico-medullary phase compared to the cRCC and pRCC patients. Although there was no significant difference, cRCC patients exhibited slightly greater enhancement than pRCC patients. ccRCC patients showed a close degree of contrast enhancement to the renal parenchyma, while the other subtypes had a prominent degree of lesser enhancement. Regarding the visual assessment on post-contrast CT images, we observed that ccRCC patients demonstrated a mostly heterogenous appearance, while pRCC patients were mostly homogenous. In cRCC patients both types of contrast enhancement pattern were observed.
Similarly to other studies, ccRCC showed a stronger degree of contrast enhancement than other RCC subtypes in this study. This can be explained by its abundant vascularity and alveolar architecture, as demonstrated on histological evaluation [19].
T2-weighted MRI has been advocated as useful in the initial evaluation of RCC patients for subtype differentiation [20]. It is considered to be highly accurate in the discrimination of ccRCC from pRCC subtype. Although ccRRC shows intermediate to high signal intensity on T2-weighted images, pRCC has a low signal intensity due to haemorrhagic contents and papillary projections [21]. But cRCC T2 signal intensity is not clearly understood.
Oliva et al. in their study evaluated 28 ccRCC and 21 pRCC patients based on T1 and T2 signal intensity characteristics on MRI and correlated these findings with pathology results. They showed that T1 signal intensity mean attenuation values of both subtypes was similar, but pRCC patients showed a significantly lower mean signal intensity ratio value (0.67 ± 0.2) than ccRCC patients (1.41 ± 0.4) on T2-weighted images. They concluded that if a T2 tumour signal intensity ratio of ≤ 0.66 was used as a cut-off value, a 54% sensitivity and 100% specificity could be obtained [22].
Young et al. examined 34 ccRCC, 12 pRCC, and 10 cRCC patients with a multiphasic dynamic contrast-enhanced MRI including 4 phases. Relative signal intensity values of ccRCC patients compared with uninvolved renal cortex on the cortico-medullary phase was compared with other subtypes and was found to be significantly greater than papillary and chromophobe ones, with an accuracy of 90%. They concluded that multiphasic MRI may assist in differentiating ccRCC from other subtypes [23].
In the literature, DWI studies have also recently been utilized in the subtype differentiation and discrimination of low- and high-grade RCC patients. Goyal et al. evaluated 33 RCCs and found that ccRCC showed significantly higher apparent diffusion coefficient (ADC) values compared to the other subtypes, and lower grade tumours had higher ADC values than the higher-grade ones [24]. Another study performed by Wang et al. including 85 RCCs revealed that cRCCs and pRCCs exhibited significant lower mean ADC values than ccRCCs [25]. Our study showed similar results to these studies.
In our study, ccRCC patients showed significantly higher T2 signal intensity values than cRCC and pRCC patients. ccRCC also showed a higher signal intensity than the normal renal parenchyma. Although cRCC showed a prominent lower T2 signal intensity than ccRCC, there was no statistically significant signal intensity difference between the chromophobe and papillary subtypes. cRCC exhibited a slightly lower T2 signal intensity than the normal renal parenchyma. Finally, pRCC showed a significantly lower T2 signal intensity than ccRCC and had similar T2 signal intensity values with the chromophobe subtype. Papillary subtype showed prominently lower signal intensity values than the renal cortex compared to the other 2 subtypes. Visual assessment on FSE T2-weighted images revealed that papillary subtype tumours have a mostly homogenous appearance on T2-weighted images, and therefore a statistically significant difference was found compared to the other subtypes. But there was no significant difference in the visual assessment of clear cell and chromophobe subtypes.
Our study possesses some limitations. First, it was a retrospective study, and a selection bias may have occurred. Secondly, a major limitation was the small number of the chromophobe and papillary RCC patients, although this was partly due to their significantly lower incidence compared to the ccRCC patients. Therefore, further investigations including a sufficient number of the other subtypes might be useful and could validate our results. Thirdly, we did not include the other rare subtypes of RCC, which even have a significantly lower incidence than the papillary subtype. Fourth, we did not discriminate between papillary 1 and 2 tumours, which have completely different prognoses. Finally, we did not calculate the threshold values for subtype differentiation of RCC patients on cortico-medullary phase contrast-enhanced CT and FSE T2-weighted MR images that can be used as a diagnostic landmark.
Conclusions
In conclusion, we can assume that dual-phase contrast-enhanced CT and FSE T2-weighted MRI are useful imaging tools in the subtype differentiation of RCC patients. Therefore, these non-invasive attenuation and signal intensity measurement techniques combined with visual assessment have some clinical implications and can obviate many patients to undergo invasive biopsy procedures. Our data clarified that both modalities provide crucial information; the findings are consistent with and support each other, and therefore can reliably be used in the subtype differentiation of RCC patients.


