Introduction
Endometrial cancer (EC) is the most common gynaecological malignancy, ranking fourth among cancers in women [1]. The treatment strategy is determined by assessing local invasion and regional lymph node metastasis [2,3]. Surgery is the standard for resectable tumours, involving hysterectomy, bilateral oophorectomy, pelvic and para-aortic lymphadenectomy, and omental and peritoneal biopsies [4]. Histological tumour grade and depth of myometrial invasion (MI) strongly correlate with outcomes [5], sparking debates on lymphadenectomy necessity for stage I cases. According to European Society for Medical Oncology (ESMO) guidelines, low-risk patients with grade 1 or 2 endometrioid adenocarcinoma without deep MI should not undergo lymphadenectomy [2,6]. Accurate diagnosis is crucial, with magnetic resonance imaging (MRI) considered the gold standard imaging technique due to its excellent soft-tissue contrast resolution. However, it is not always applicable due to extended examination time, high examination costs, and contraindications for certain patient groups, such as metal implants or claustrophobic patients.
On the other hand, computed tomography (CT) is a cross-sectional, high-resolution, three-dimensional diagnostic imaging modality and is recommended for distant staging [7]. Recently introduced dual-energy CT (DECT) scans an object using 2 different energies or tube voltages, allowing the acquisition of images similar to those obtained with single-energy CT, and also enables material decomposition and iodine extraction [7-10] to generate multiple different image datasets, such as virtual monoenergetic images (VMI). VMI approximates a monoenergetic X-ray image, enhancing iodine contrast and improving visualisation of contrast-enhanced lesions [9,11,12]. This has the potential to lead to improved tumour recognition and local diagnostic capabilities. If CT can assess deep MI as well as MRI, it would allow patients to avoid an additional examination for local staging and could represent a one-stop radiological examination for staging EC [4]. To the best of our knowledge, few studies have assessed the efficacy of DECT for evaluating MI in EC. This study aimed to evaluate the diagnostic performance of VMI in the local diagnosis of EC compared to that of conventional CT (C-CT), MRI, and pathologic staging.
Material and methods
Study design
Patients with pathologically diagnosed endometrial epithelial cancer, who underwent DECT and MRI before surgery between September 2021 and October 2022, were included in this retrospective study (approval number: R03-117). Approval from the Institutional Review Board waived the need for written informed consent because the content of this study falls within the scope of normal clinical practice. However, written consent was obtained for each individual contrast-enhanced MRI and contrast-enhanced CT procedure. At our institution, both contrast-enhanced MRI and contrast-enhanced CT are routinely performed preoperatively for EC. Exclusion criteria were as follows: pathology including histologic types other than EC, MRI protocol not as prescribed, therapeutic intervention before surgery, surgery performed at another hospital, cases with no remaining DECT data, and iodine contrast agent dose reduction.
Patient staging adhered to the 2023 International Federation of Gynaecology and Obstetrics (FIGO) classification [13].
Image protocol
All CT examinations were performed using the IQon spectral CT scanner (Philips Medical Systems, Amsterdam, Netherlands). Scanning was performed with the following acquisition parameters: tube voltage, 120 kVp; helical pitch, 0.798; detector collimation, 64 × 0.625; and rotation time, 0.5 s. Tube current was modulated by automatic exposure control (dose right index, 24-25; Philips Healthcare). A 500 mgI/kg dose of contrast medium was injected via the peripheral vein of the upper extremity over 50 s using a power injector, followed by a 50 ml saline flush. The contrast agent used was modified according to body weight. All scans were extended in a craniocaudal direction from the lung apices or liver dome to the pubis 80 s after intravenous administration of the contrast medium. To evaluate low-energy images, we decided to use 40 keV images, which have been reported to have the highest tumour recognition from previous studies [4,11,14-18]. Images from just above the aortic bifurcation to the pubis were selected and reconstructed using 120 kVp C-CT and 40 keV VMI with a slice thickness of 2.0 mm and reconstruction interval of 2.0 mm. Images of the axial and sagittal planes along the uterine axis on C-CT and VMI were also reconstructed with a slice thickness of 2.0 mm and a reconstruction interval of 2.0 mm. The optimal window levels and widths were set to 35 and 350 Hounsfield units (HU) for C-CT, and 140 and 680 HU for VMI.
Magnetic resonance imaging was performed using 3T equipment (Ingenia®; Philips Medical Systems, Netherlands). The protocol included T1-weighted imaging (T1WI), T2-weighted imaging (T2WI), DWI with a b-value of 0 and 1000, apparent water diffusion coefficient (ADC) maps, dynamic contrast-enhanced T1WI (DCE-T1WI), and contrast-enhanced T1WI (CE-T1WI). Further details of these parameters are listed in Table 1. The images to be evaluated were sagittal and axial directions perpendicular to the long axis of the uterine body.
Table 1
Acquisition parameters of MRI
[i] T1WI – T1-weighted imaging, T2WI – T2-weighted imaging, DWI – diffusion-weighted imaging, DCE-T1WI – dynamic contrast-enhanced T1-weighted imaging, CE-T1WI – contrast-enhanced T1-weighted imaging, TSE – turbo spin echo, EPI – echo planar imaging, GRE – gradient echo, SPIR – spectral presaturation with inversion recovery
Quantitative image analysis
Quantitative determination of the myometrium and EC on C-CT and VMI was performed using region-of-interest (ROI) analysis by board-certified radiologists (A.A., B.B.) with 8 and 7 years of experience, respectively. ROI analysis of C-CT and VMI was performed to obtain mean CT values (measured in HU) of myometrium excluding myomas, adenomyosis, and vessels, followed by qualitative image analysis. For EC, the ROI was set to be as large as possible without including the surrounding area. Image noise was quantified as the standard deviation (SD) of the CT value of the anterior abdominal wall fat tissue. The signal-to-noise ratio (SNR) of the myometrium was calculated by dividing the CT value of the myometrium by the image noise. The contrast-to-noise ratio (CNR) of the tumour to myometrium was calculated using the following equation: CNR = (mean HU of myometrium-HU of EC)/image noise [11]. Because the enhancing effect of EC may be weaker or stronger than that of the myometrium, absolute values were used for CNR.
Qualitative image analysis
Five expert radiologists (M.Y., T.A., M.S., S.H., and T.S.) with 8, 7, 13, 16, and 20 years of experience in abdominal radiology, respectively, independently reviewed the C-CT, VMI, and MRI in random order. They evaluated each image by assigning the extent of MI using a 5-point scale: 1, tumour not visualised; 2, no MI; 3, < 1/2 MI; 4, > 1/2 MI; and 5, invasion into the uterine serosa or more. A score of 1 indicated the absence of a tumour, and a score other than 1 indicated the presence of a tumour. A diagnostic score of ≥ 3 indicated a definite invasion of the myometrium. Next, the invasion of the cervical stroma and lymph node metastasis were evaluated using a 5-point scale: 1 – definitely absent; 2 – probably absent; 3 – equivocal; 4 – probably present; and 5 – definitely present. For cervical invasion and lymph node metastasis, ≥ 4 was considered definitive. In CT, the cervix often exhibits relatively low attenuation, with absorption values similar to those of EC. Cervical invasion was assessed only when clear infiltration of the cervix by EC was evident. Lymph nodes were evaluated for potential metastasis when their short diameter exceeded 10 mm, exhibited a round shape, and demonstrated internal heterogeneity in contrast enhancement.
Radiologists were blinded to the pathological, clinical, and other imaging findings, with 2 weeks or more between the interpretations of different image sets from the same patient.
Statistical analysis
For quantitative analysis, the mean CNR and SD were calculated, and the Wilcoxon signed-rank test was used to evaluate the difference in CNR between C-CT and VMI.
For qualitative analysis, the sensitivity, specificity, and accuracy were calculated for each diagnostic parameter by selecting 2 options: presence or absence. Receiver operating characteristic (ROC) analysis was performed to assess the diagnostic performance. The area under the ROC curve (AUC) interpreted the diagnostic value as follows: 0-0.70, poor; 0.70-0.90, moderate; and 0.90-1.00, high. We estimated 95% confidence intervals (CIs) and performed multiple comparisons using the Friedman test with Bonferroni correction to compare the sensitivity, specificity, accuracy, and AUC for each image set. The Friedman exact test is a non-parametric test used for analysing qualitative data involving 3 or more groups. The Bonferroni correction is a method employed to adjust the significance level of multiple comparisons to reduce the likelihood of making a Type I error. The inter-reader agreement was assessed using κ statistics. The κ-statistic interpreted the agreement as follows: < 0, no; 0-0.20, slight; 0.21-0.40, fair; 0.41-0.60, moderate; 0.61-0.80, substantial; and 0.81-1.00, almost perfect.
All statistical analyses were performed using SPSS software (SPSS Statistics 28.0; IBM, New York, NY, USA). Statistical significance was set at p < 0.05.
Results
Patients
A total of 45 women (mean age, 62 years; age range, 44-84 years) were evaluated across the datasets. A flowchart of the patient selection process is shown in Figure 1.
Figure 1
Flowchart of the patient selection process
MRI – magnetic resonance imaging, CT – computed tomography
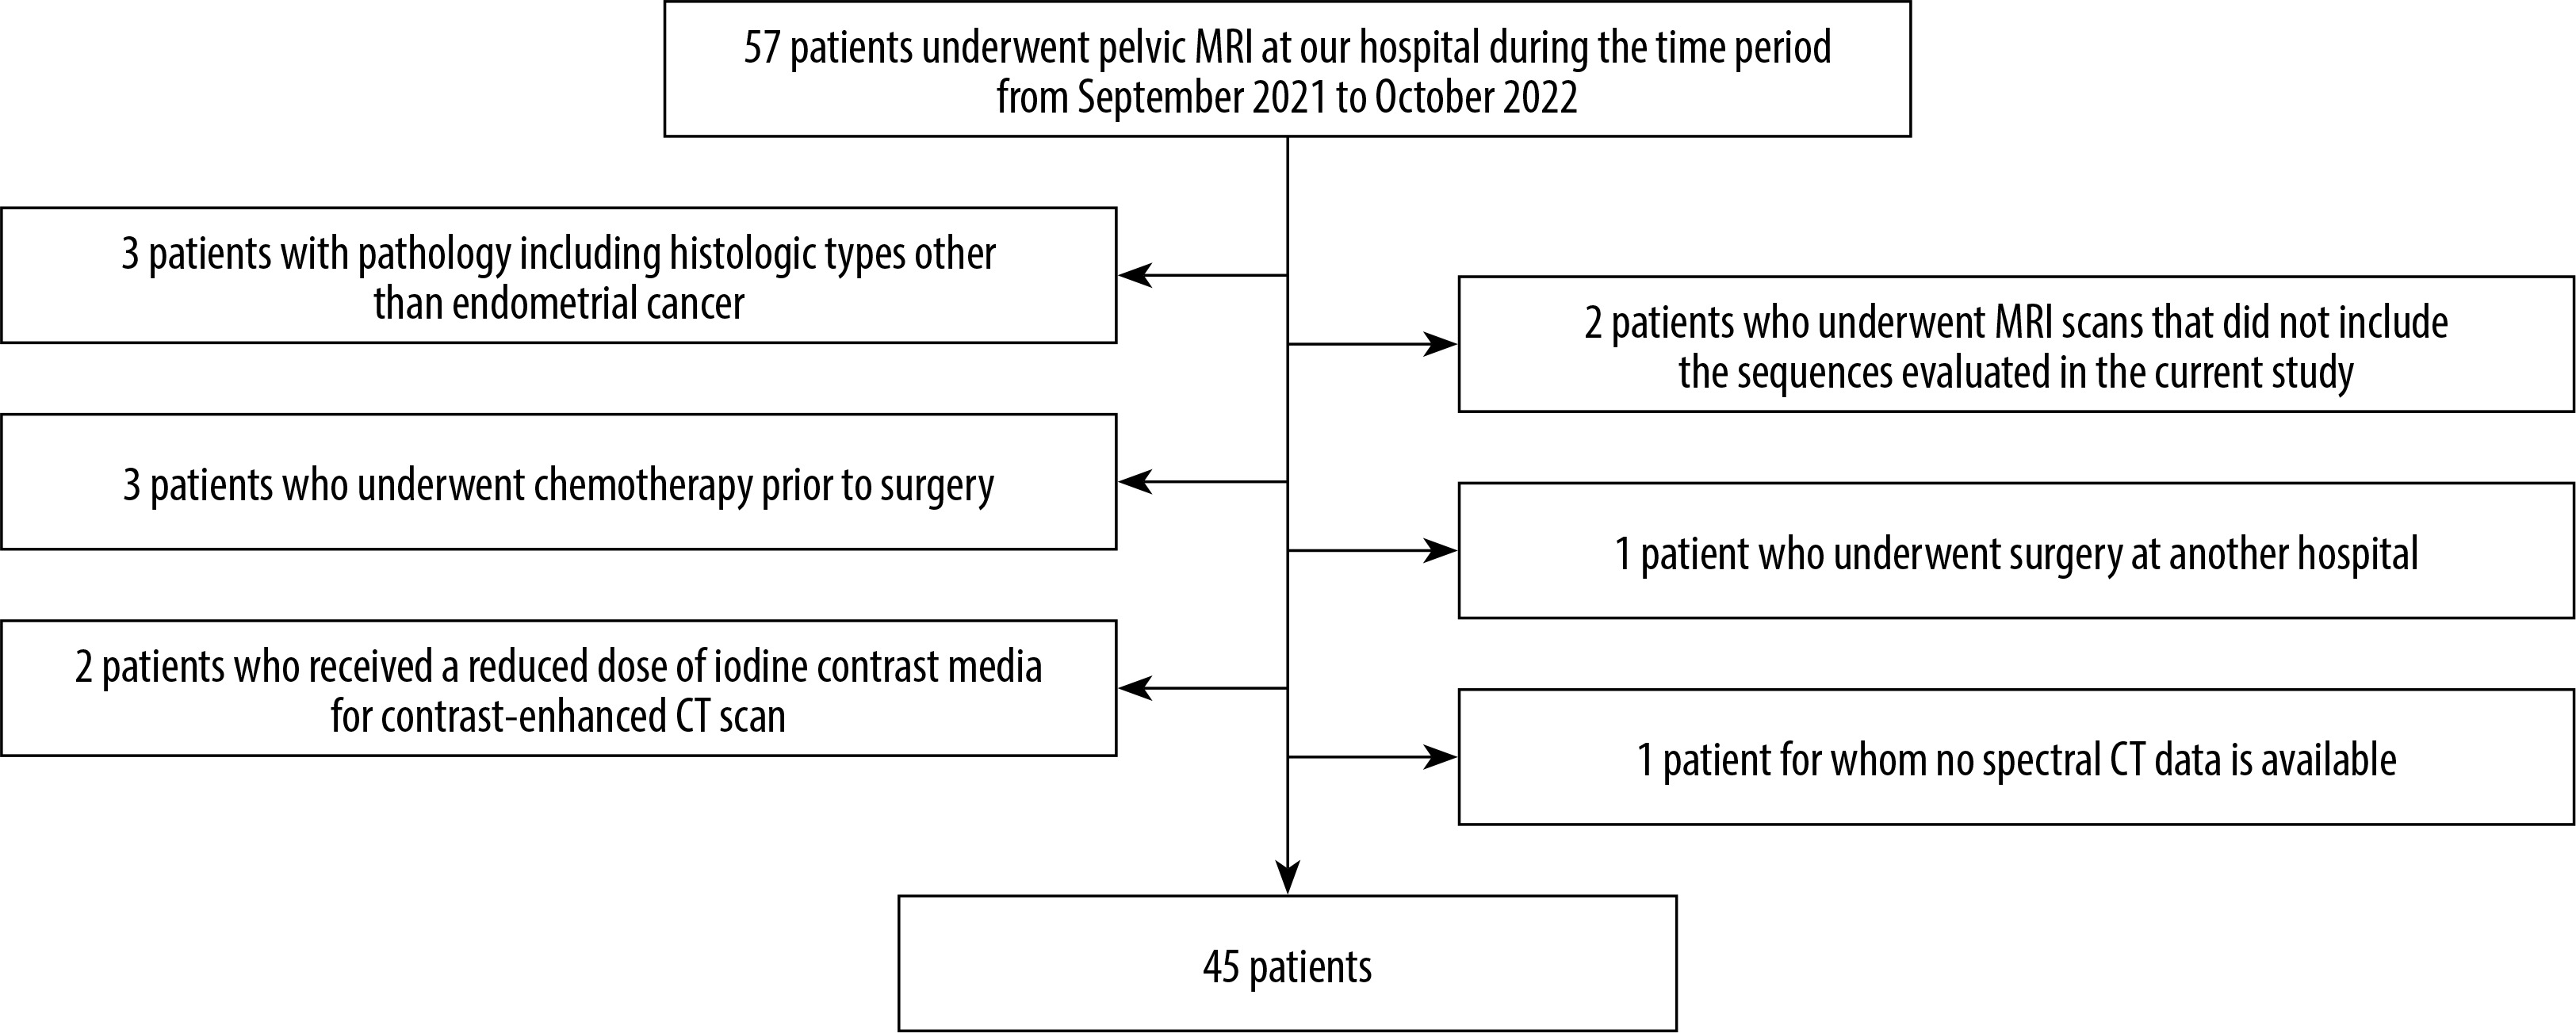
Table 2 shows patient characteristics, pathological types of EC, and the FIGO (2023) stage. All patients underwent hysterectomy, and the tumour stage was determined pathologically. Based on the diagnosis of preoperative MRI, pelvic lymph node dissection was not performed in patients in whom MI was not suspected; only a biopsy was performed, and lymph node dissection was performed in all patients with suspected MI. The median time between MRI and CT was 4 days and between MRI and surgery was 48 days (Table 2). Out of 45 cases, there were 6 cases of aggressive histological types. Among the non-aggressive histological types, 12 patients had no MI, 15 patients had < 1/2 MI, and 6 patients had > 1/2 MI. Cervical stromal invasion was observed in 3 cases, with one case classified as stage IIIC2 due to pelvic lymph node metastasis. Additionally, one patient had ovarian metastasis, and 3 patients had a total of 13 lymph node metastases.
Table 2
Characteristics of patients and lesions
Quantitative image analysis
The mean tumour-to-myometrium CNR was 4.30 ± 2.54 (range, –2.24 to 12.09) on C-CT and 7.53 ± 4.32 (range; –2.87 to 20.42) on VMI, and the CNR of VMI was significantly higher than that of C-CT (p < 0.001).
Supplementary Table 1 shows the sensitivity, specificity, accuracy, and AUC for local diagnostic parameters of EC on C-CT, VMI, and MRI by radiologists, and Table 3 shows the mean values of sensitivity, specificity, accuracy, and AUC for local diagnostic parameters. In terms of tumour detection, VMI demonstrated higher sensitivity than C-CT for all readers and a trend comparable to that of MRI, although no significant differences were observed. Because tumours were present in all cases, other parameters such as specificity, accuracy, and AUC could not be calculated. The sensitivity of VMI in detecting the presence of MI was significantly higher than that of C-CT and MRI (p = 0.027 and 0.011, respectively). However, the specificity of VMI was significantly lower than that of MRI (p = 0.018). Furthermore, when detecting the presence of cervical stromal invasion, C-CT was significantly superior to MRI in terms of sensitivity and AUC (p = 0.018 and 0.004, respectively). For other local diagnostic parameters, there were no significant differences in sensitivity, specificity, accuracy, or AUC between the image sets. In the context of lymph node metastasis, VMI exhibited a trend of higher sensitivity, specificity, accuracy, and AUC compared to C-CT, and MRI showed a tendency to be even higher than VMI in each of these aspects, although no statistically significant differences were observed.
Table 3
Readers’ mean values of sensitivity, specificity, accuracy, and AUC for local diagnosis parameters of endometrial cancer in conventional CT, VMI, and MRI
[i] Parentheses indicate 95% confidence intervals. “–“ indicates that it cannot be calculated due to an exact match. C-CT – conventional computed tomography, VMI – virtual monoenergetic image, MRI – magnetic resonance imaging, AUC – the area under the receiver operating characteristic curve, *p < 0.05
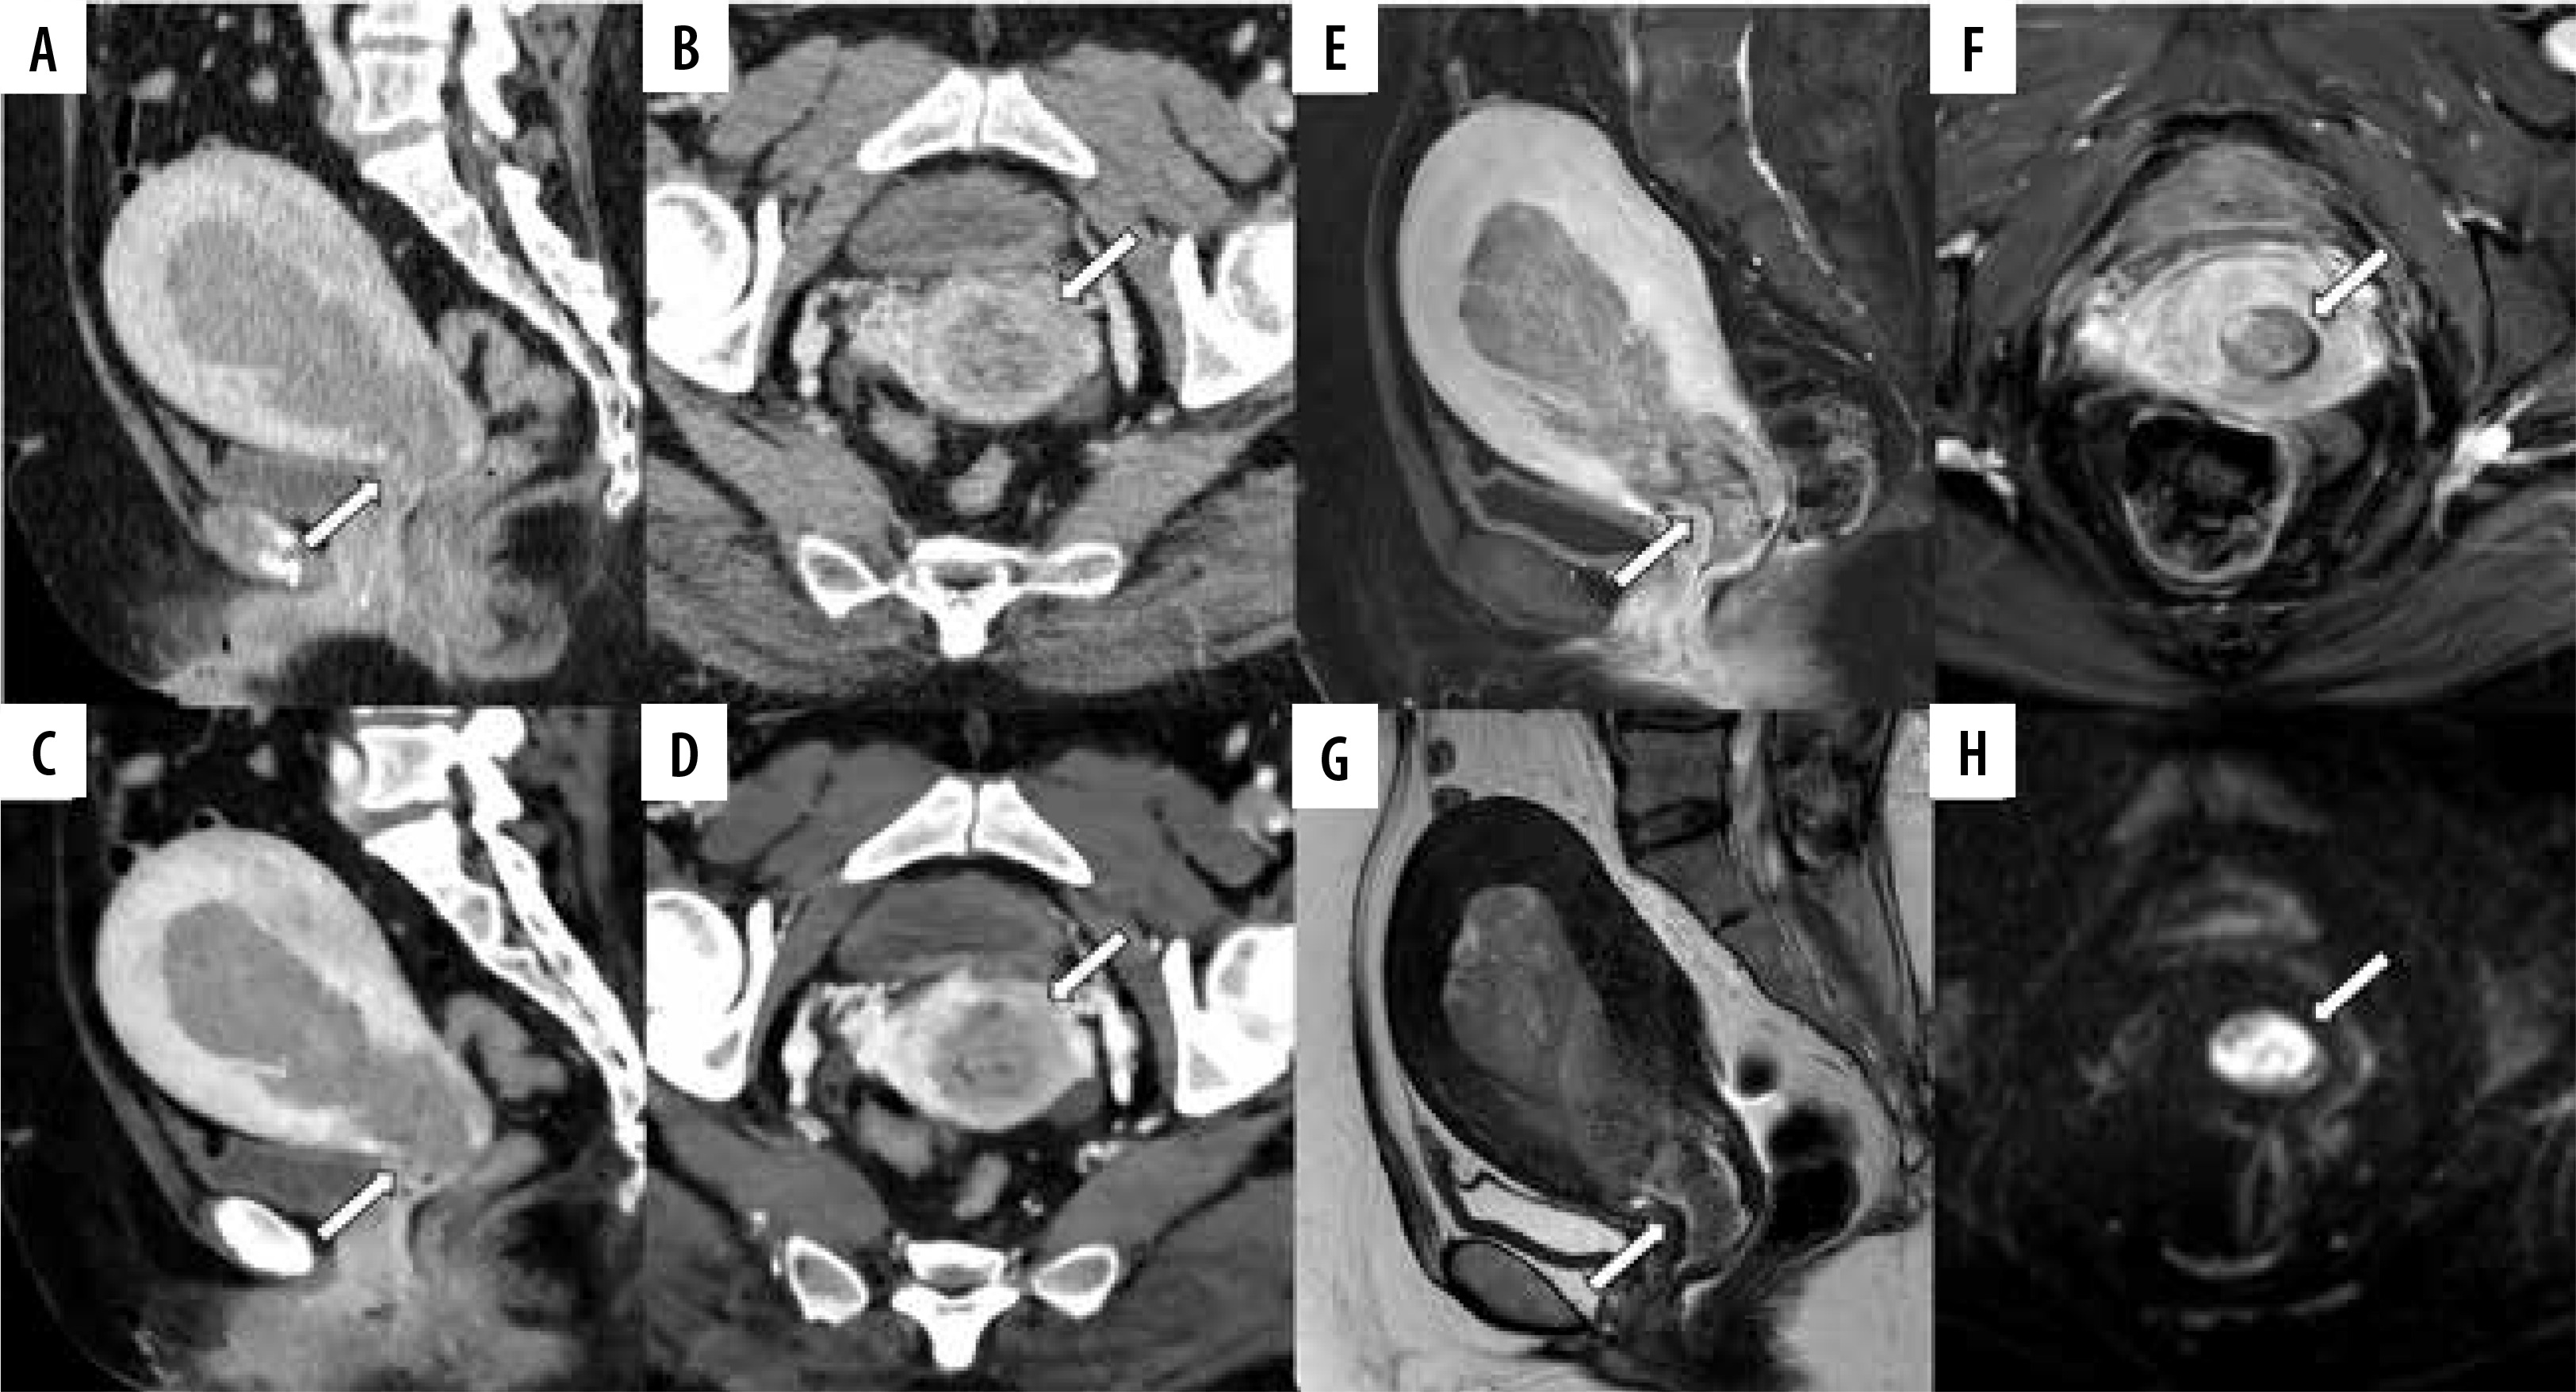
Figures 2-6 show C-CT, VMI, and MRI of stage IA2, IB, IIIC1, IA1, and II endometrioid carcinoma, respectively. Figures 2, 3, and 4 show that VMI provides a better contrast between the myometrium and tumour than C-CT, and the tumour is more clearly defined and highlights irregularities suggestive of MI. Figure 5 shows a case of EC that was misdiagnosed on CT as having deep MI because the myometrium appeared hypodense. This is probably due to a history of curettage, and is particularly emphasised by VMI, which could lead to a misdiagnosis. It is also worth noting that VMI depicts normal cervical stroma at a lower density than C-CT (Figures 4 and 5), and the enhancement of the metastatic lymph node appears more prominent (Figure 4). Figure 6 shows a case of EC with cervical stromal invasion. Irregularities in the cervical stroma were more prominent on C-CT or VMI than on MRI.
Figure 2
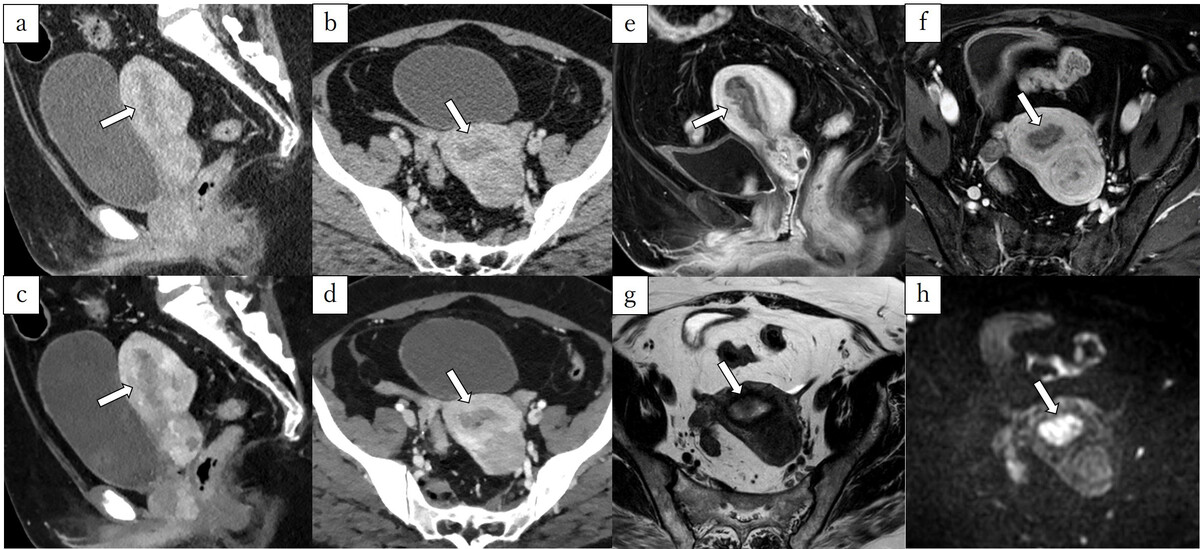
A 58-year-old woman pathologically diagnosed with FIGO (2023) IA2 endometrioid carcinoma, Grade 1, characterised by shallow myometrial invasion (MI). Infiltration of the myometrium measured 8/22 mm. A, B) Sagittal and axial conventional CT images. C, D) Sagittal and axial virtual monoenergetic images. E, F) Sagittal and axial fat-saturated contrast-enhanced T1-weighted images. G) Axial T2-weighted image. H) Axial diffusion-weighted image. Conventional CT (C-CT) shows a low-attenuation tumour filling the uterine cavity (A, B, arrows). On virtual monoenergetic images (VMI), the contrast between the tumour and myometrium is enhanced, and irregularity between the tumour and myometrium suggests MI (C, D, arrows). Fat-saturated contrast-enhanced T1-weighted images reveal an irregular border between the tumour and the myometrium on the anterior wall (E, F, arrows). On T2-weighted image, the tumour shows higher signal intensities than the myometrium (G, arrow), and the junctional zone is preserved. Diffusionweighted image shows no irregularity in the tumour-myometrium boundary (H, arrow). Three readers did not diagnose MI using C-CT. On VMI, all readers correctly diagnosed MI. On magnetic resonance imaging, the 3 readers did not diagnose MI

Figure 3
A 54-year-old woman pathologically diagnosed with FIGO (2023) IB endometrioid carcinoma, Grade 1. The infiltration of the myometrium measured 9/13 mm. A, B) Sagittal and axial conventional CT images. C, D) Sagittal and axial virtual monoenergetic images. E, F) Sagittal and axial fatsaturated contrast-enhanced T1-weighted images. G) Axial T2-weighted image. H) Axial diffusion-weighted image. On conventional CT (C-CT), a hypovascular tumour fills the uterine cavity with thin myometrium (A, B). On virtual monoenergetic images (VMI), the contrast between the tumour and myometrium is enhanced, highlighting irregularities suggestive of myometrial invasion (MI) (D, arrow). On fat-saturated contrast-enhanced T1-weighted images reveal an irregular border between the tumour and the myometrium on the anterior wall (E, F, arrows). On T2-weighted image, the tumour shows higher signal intensities than the myometrium, and the junctional zone of the anterior wall is absent, raising the possibility of deep MI in that area (G, arrow). Diffusion-weighted image reveals MI in the anterior wall (H, arrow). Only one reader misdiagnosed as having no MI on C-CT, whereas all readers correctly diagnosed with VMI and magnetic resonance imaging
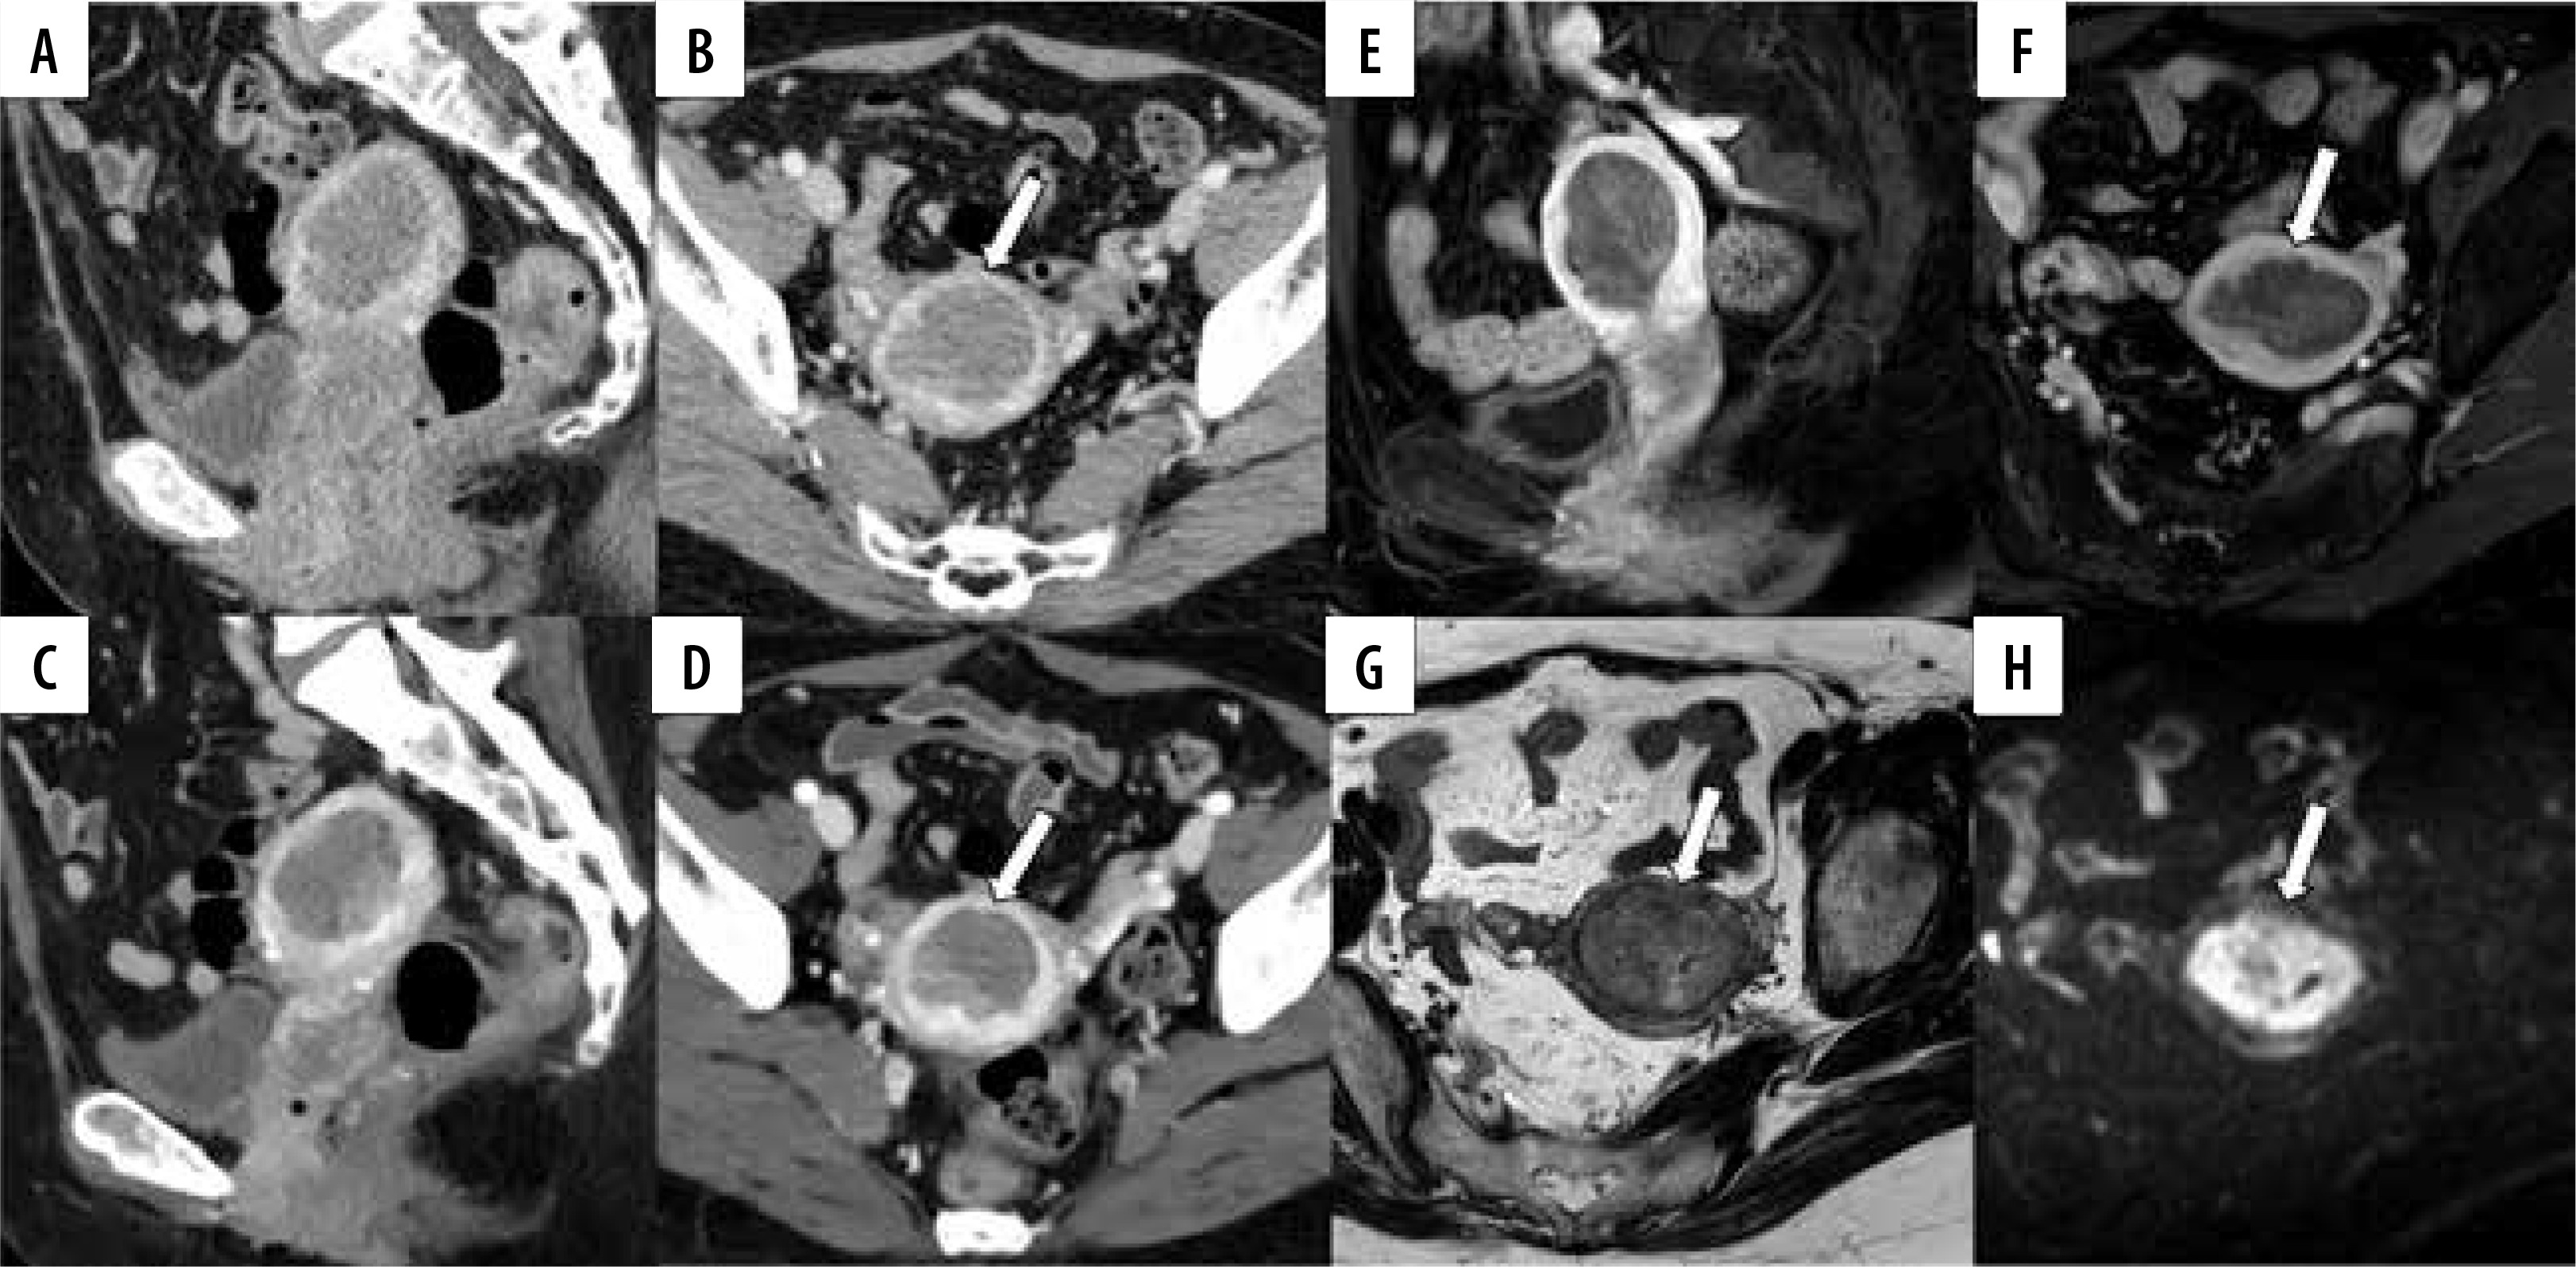
Figure 4
A 65-year-old woman pathologically diagnosed with FIGO (2023) IIIC1 endometrioid carcinoma, Grade 1. The infiltration of the myometrium measured 10/15 mm. Four lymph node metastases were identified within the pelvic region. A, B) Sagittal and axial conventional CT images. C, D) Sagittal and axial virtual monoenergetic images. E, F) Sagittal and axial fat-saturated contrast-enhanced T1-weighted images. G) Axial T2-weighted image. H) Axial diffusion-weighted image. Conventional CT (C-CT) reveals a low-density mass detected in the uterine cavity, with an unclear boundary between the tumour and the myometrium on the anterior wall side (A, B, arrows). A nearby lymph node is detected, but it does not measure more than 10 mm in its short diameter (A, arrowhead). On virtual monoenergetic images (VMI), the contrast between the tumour and the myometrium is enhanced, and the components invading deeply into the myometrium on the left anterior side are also clearer (C, D, arrows), in addition, the metastatic lymph node exhibited stronger contrast than C-CT (C, arrowhead). On fat-saturated contrast-enhanced T1-weighted images, the contrast between the tumour and the myometrium is distinct (E, F, arrows). On T2-weighted image, the junctional zone on the anterior wall is unclear, and myometrial invasion (MI) is apparent, but its extent is difficult to evaluate, possibly due to adenomyosis (G, arrow). The metastatic lymph node shows a slight heterogeneity (G, arrowhead). On diffusion-weighted image the border of the tumour invading more than half of the myometrium is clearly delineated (H, arrow). Two readers misdiagnosed as shallow MI on C-CT, and only one reader was able to diagnose deep MI on magnetic resonance imaging. In VMI, three readers were able to diagnose deep MI. As for lymph node metastasis, no one could diagnose metastasis on C-CT. However, 2 readers could diagnose the metastasis both on VMI and MRI
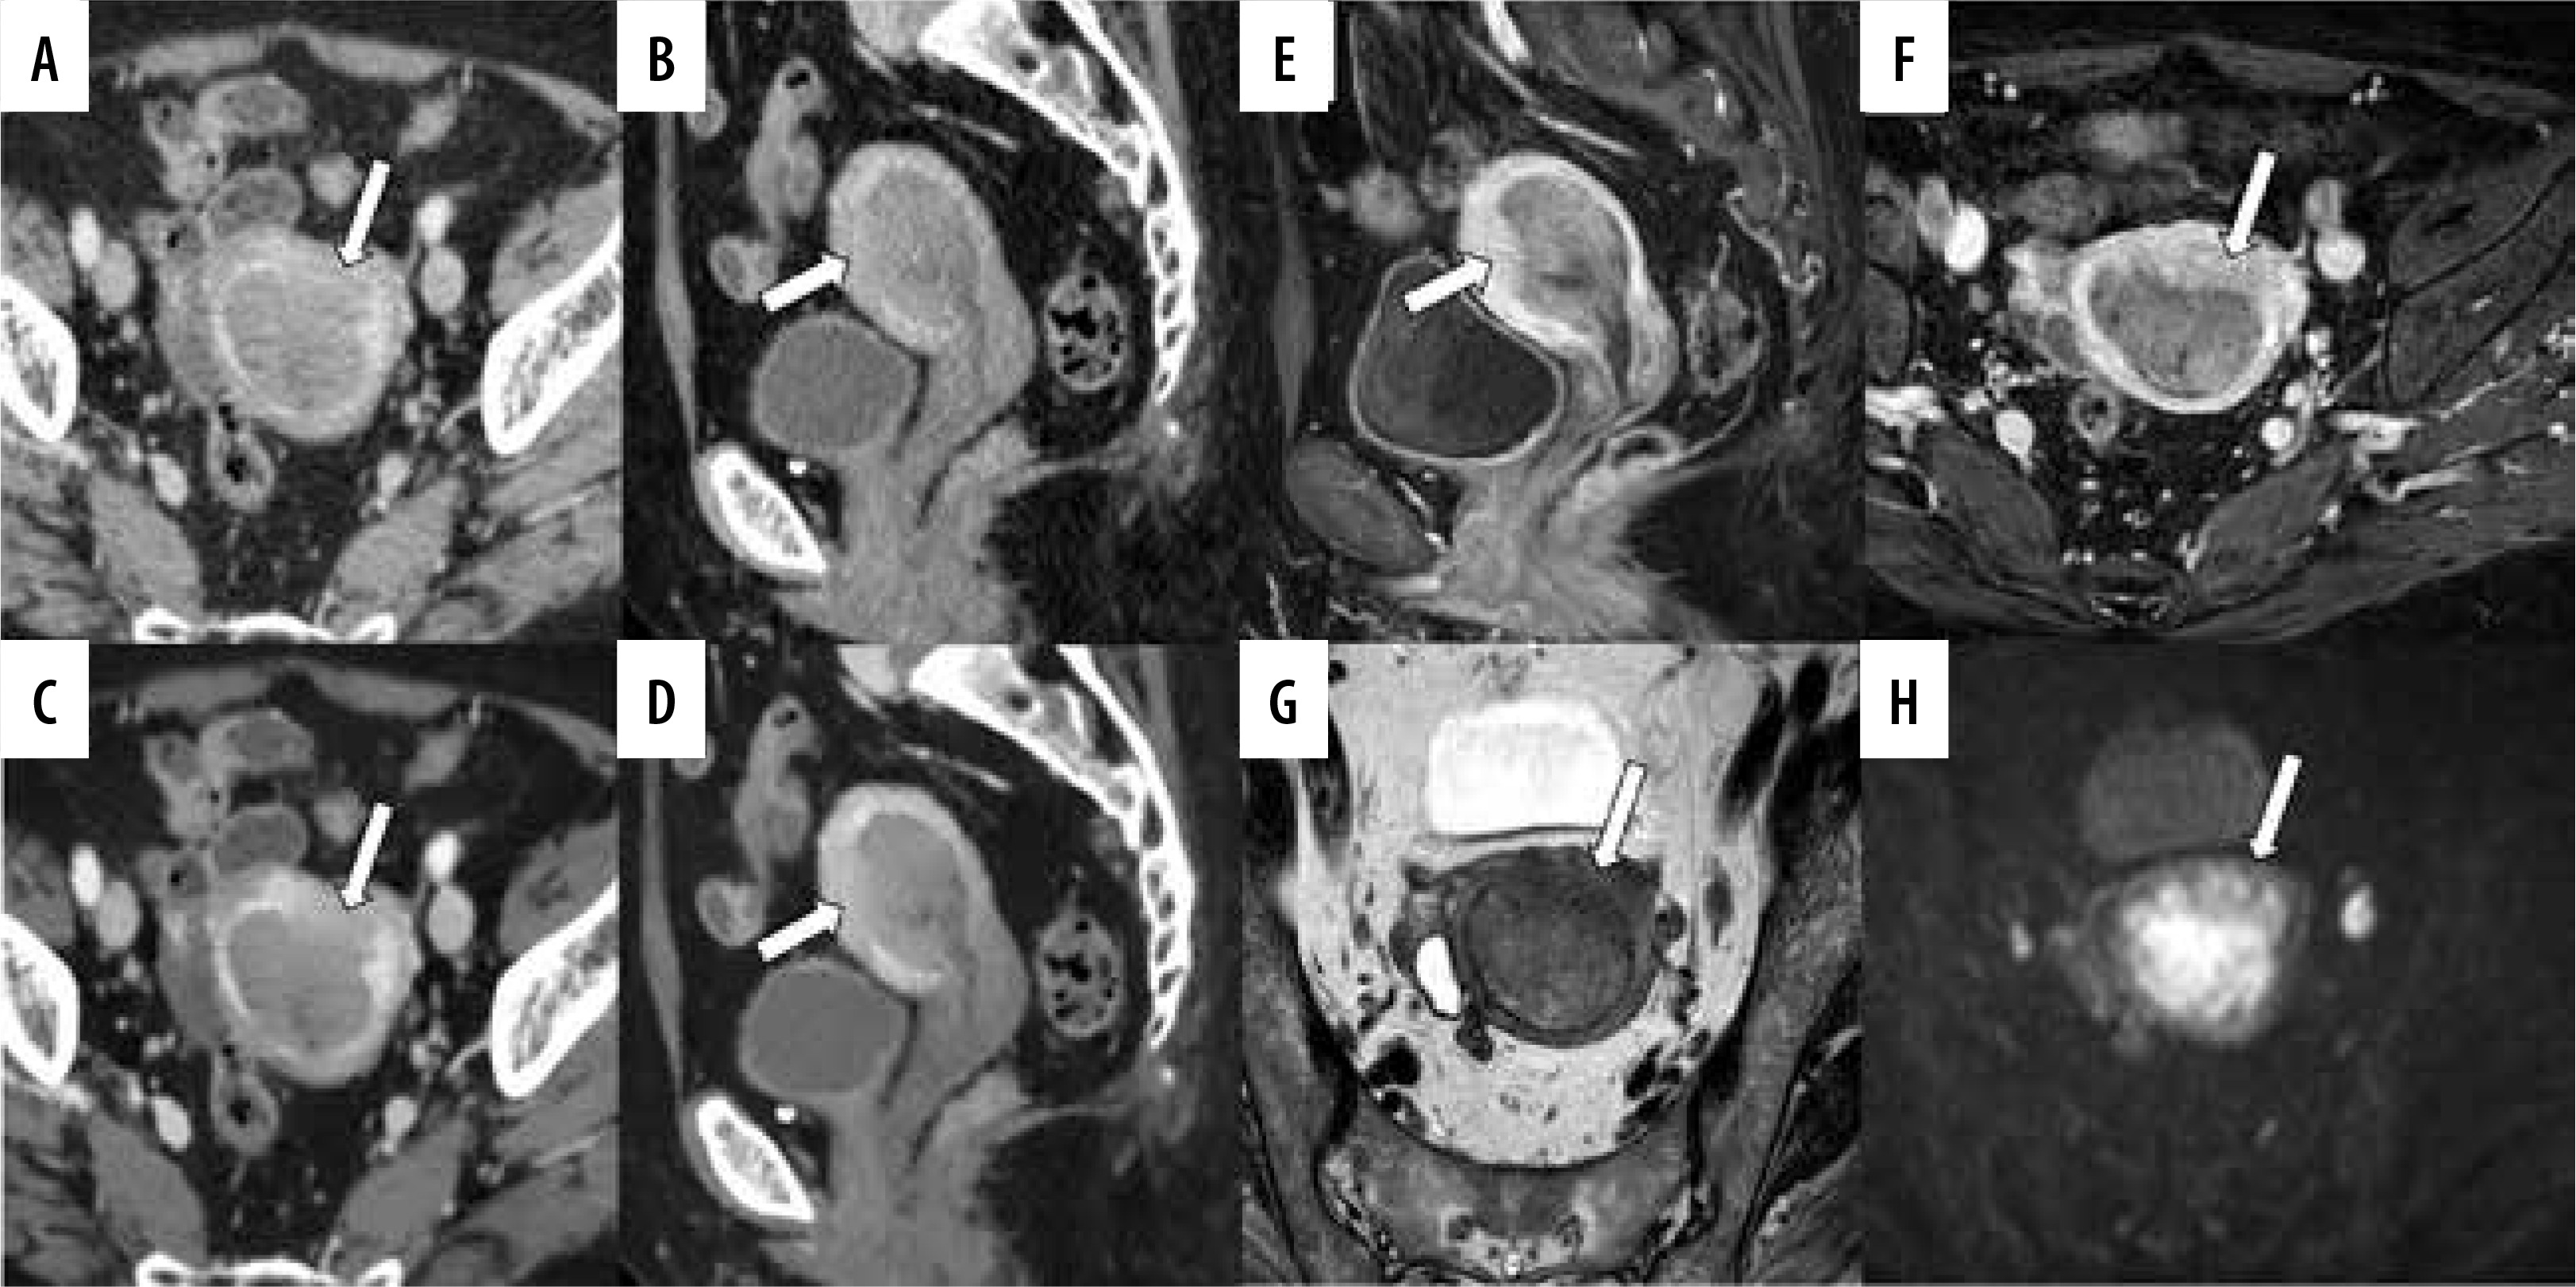
Figure 5
A 49-year-old woman pathologically diagnosed with FIGO (2023) IA1 endometrioid carcinoma, Grade 1 without myometrial invasion. The patient has a history of cone biopsy of the cervix and total curettage of the endometrium. A, B) Sagittal and axial conventional CT images. C, D) Sagittal and axial virtual monoenergetic images. E, F) Sagittal and axial fat-saturated contrast-enhanced T1-weighted images. G) Axial T2-weighted image. H) Axial diffusion-weighted image. Conventional CT (C-CT) reveals heterogeneity in the myometrium, and the boundary between the endometrium and myometrium is unclear on the right side (A, B, arrows). On virtual monoenergetic images (VMI), heterogeneity in the myometrium is even more pronounced, and the boundary between the endometrium and myometrium is enhanced (C, arrow). However, the endometrium and myometrium interface on the right side remains unclear on the axial VMI (D, arrow). Fat-saturated contrast-enhanced T1-weighted images show diffuse poor enhancement in the myometrium just below the endometrium, suggesting the influence of endometrial scraping (E, F, arrows). On T2-weighted image, there is no endometrial thickening, making it difficult to recognize the tumour (G, arrowhead). Diffusion-weighted image shows diffusion restriction limited to the left side of the endometrium, suggesting endometrial cancer (H, arrowhead). On C-CT, 3 readers over-diagnosed the tumour with myometrial invasion (MI). On VMI, 4 readers misdiagnosed as deep MI. On magnetic resonance imaging, all readers correctly diagnosed no MI
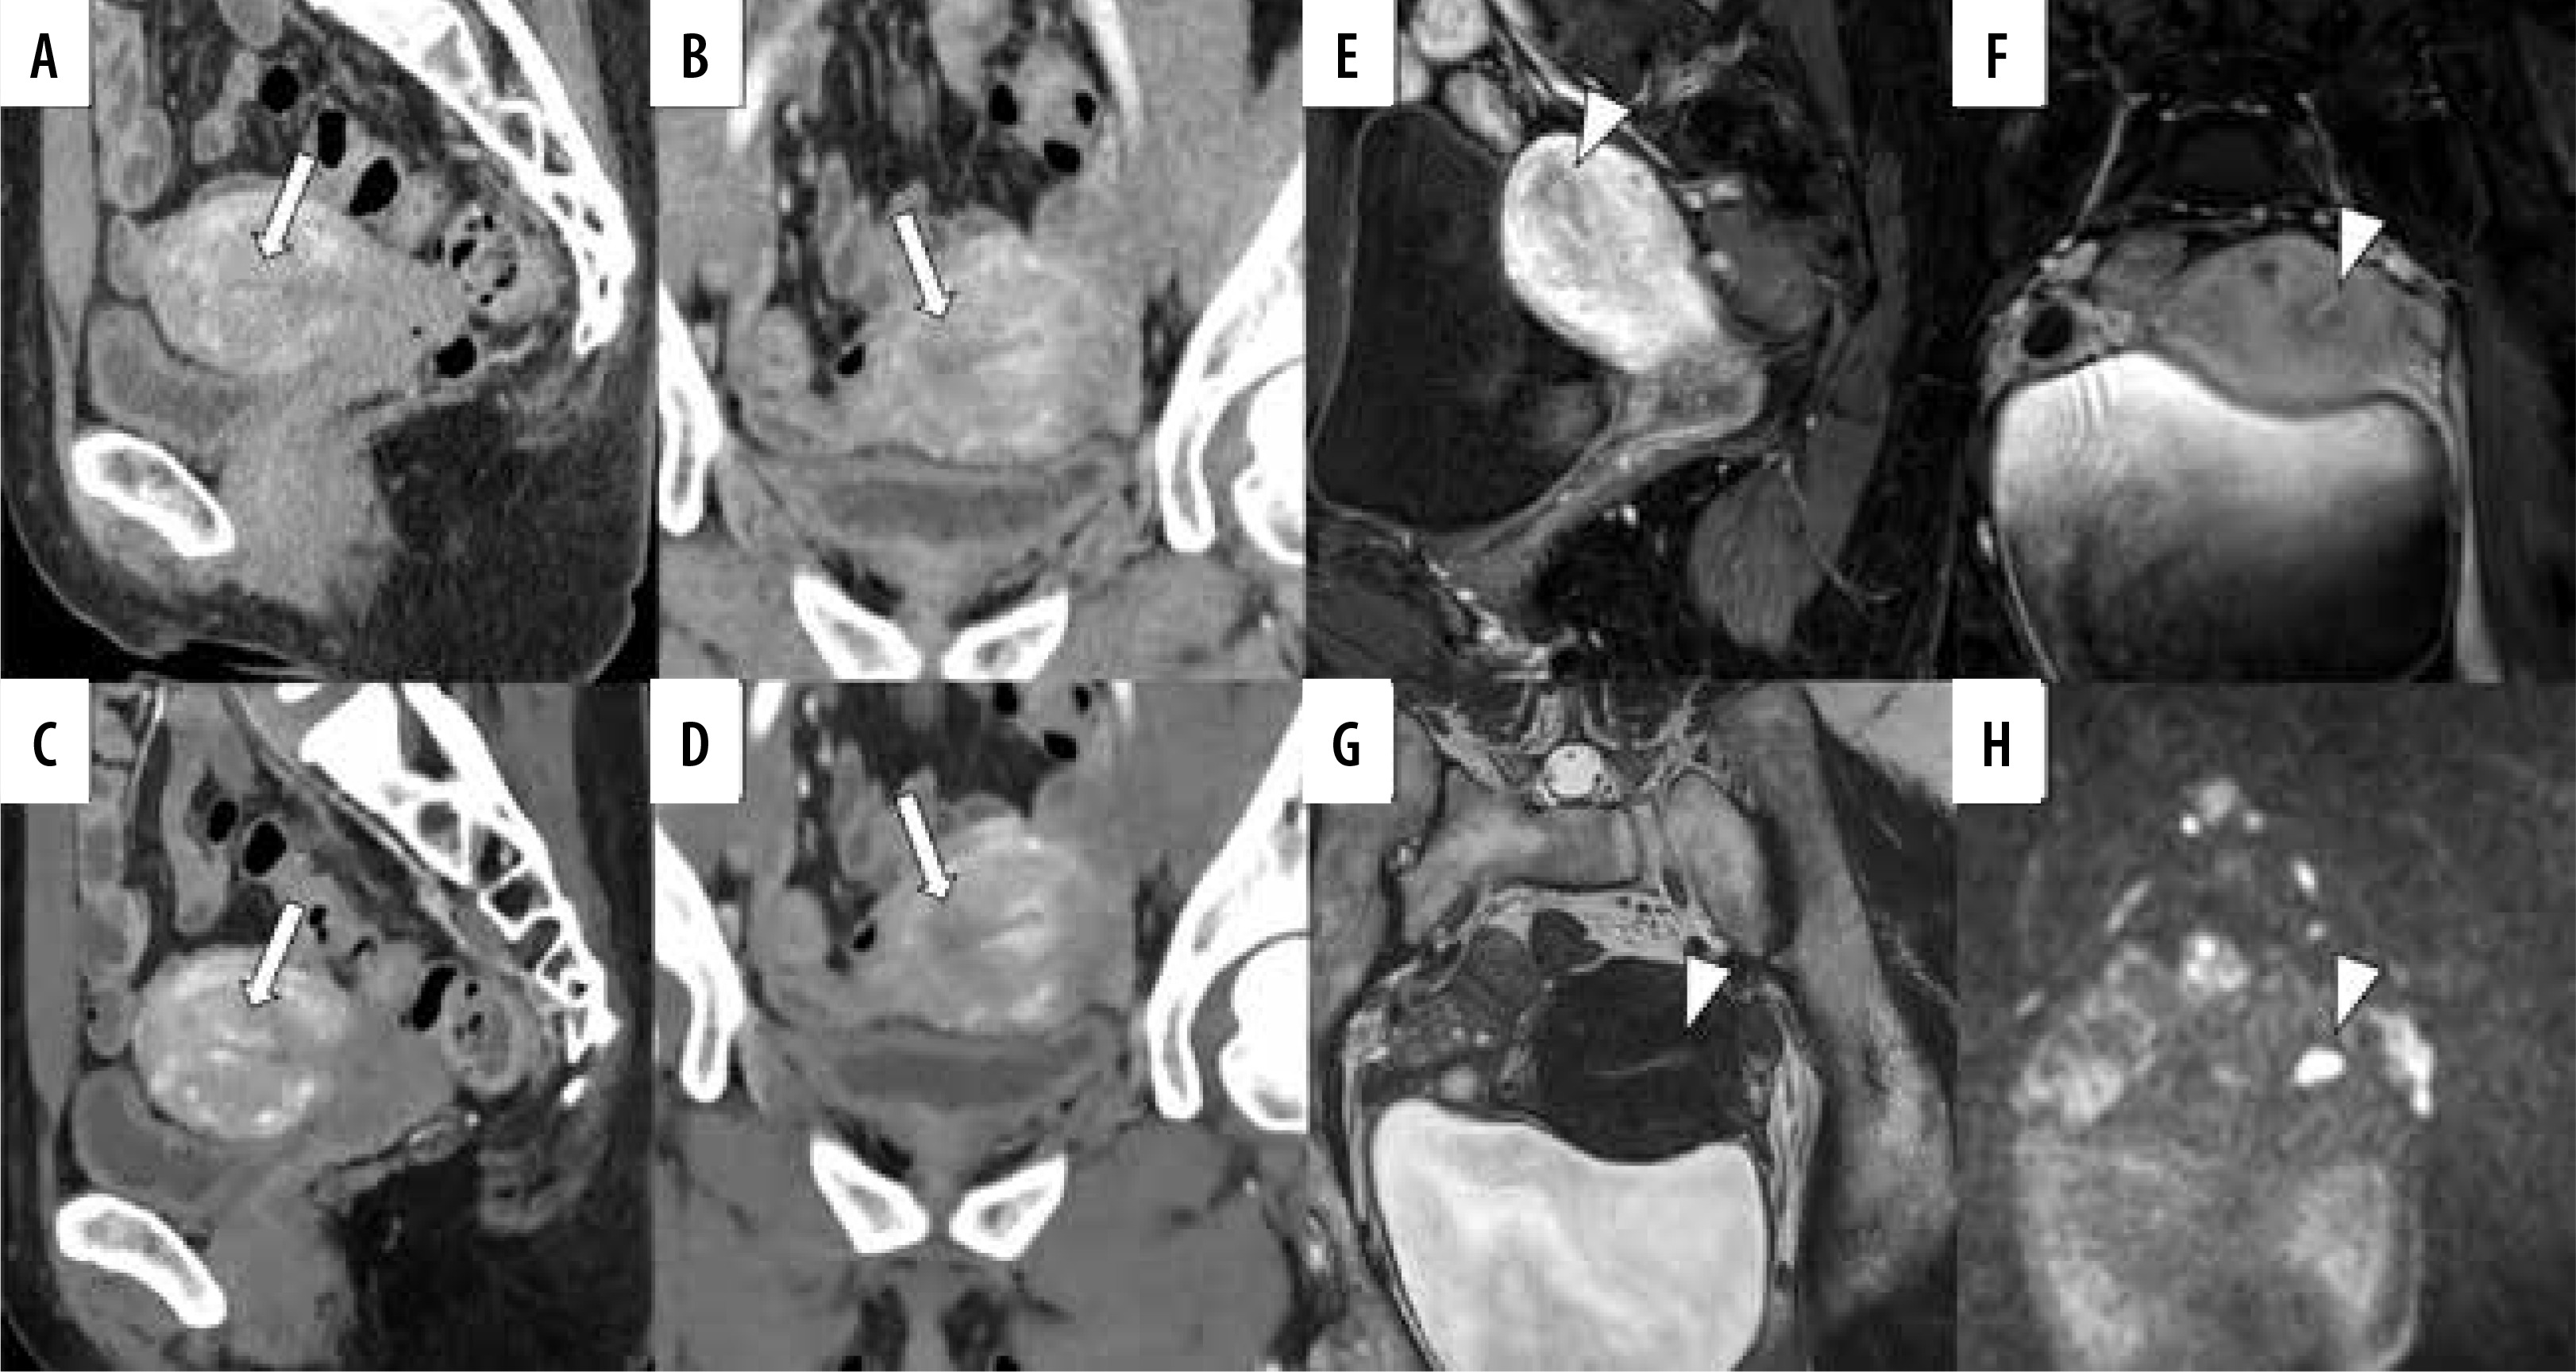
Figure 6
A 45-year-old woman pathologically diagnosed with FIGO (2023) II endometrioid carcinoma, Grade 1. A, B) Sagittal and axial conventional CT images. C, D) Sagittal and axial virtual monoenergetic images. E, F) Sagittal and axial fat-saturated contrast-enhanced T1-weighted images. G) Axial T2-weighted image. H) Axial diffusion-weighted image. Following the MRI, a CT scan was performed four days later. A mass filling the uterine cavity and extending into the cervix is observed. In conventional CT (C-CT), the boundary between the tumour in the cervical canal and the cervical stroma is indistinct, with suspected infiltration on the anterior wall (A, B, arrows). Similar findings are noted on virtual monoenergetic images (VMI) (C, D, arrows). The boundary between the tumour in the cervical canal and the cervical stroma appears well-defined on T2-weighted image, fat-saturated contrastenhanced T1-weighted images, and diffusion-weighted image (E-H, arrows). On both C-CT and VMI, all 5 radiologists diagnosed cervical stromal invasion. However, on MRI, 3 radiologists misdiagnosed as no cervical stromal invasion
Inter-observer agreement
Table 4 shows the inter-reader agreement among radiologists for local diagnostic parameters. κ-values among radiologists for VMI ranged from –0.03 to 1.00, with high variability, but mean values were in the slight to fair range. For diagnostic parameters other than the presence of a tumour, κ-values for C-CT tended to be higher than those for VMI, which were higher than those for MRI.
Table 4
Inter-reader agreement of local diagnosis parameters between the radiologists
Discussion
The present study assessed MI, cervical invasion, and lymph node metastasis in EC using C-CT, VMI, and MRI. There was no difference in diagnostic performance between VMI and C-CT or MRI, and VMI had high sensitivity but low specificity for MI.
Traditionally, MRI is considered the most accurate for endometrial local cancer staging due to excellent soft-tissue contrast resolution [19]. CT has been considered unreliable and is not sensitive or specific enough to assess the depth of invasion into the myometrium or cervix [3,19]. However, recent advancements, such as iodine-specific maps and low keV VMI have improved the diagnostic accuracy of CT, and there have been several reports indicating that low keV VMI is useful for tumour recognition [8,11,14-18]. As far as we know, this study is the first to compare DECT and MRI for diagnosing EC, showing the potential of DECT in evaluating MI.
Contrary to expectations, MRI did not demonstrate significantly superior diagnostic performance over CT for all diagnostic parameters in the present study. The CNR of VMI is significantly higher than that of C-CT, increasing the contrast between tumour and background, and most readers showed higher tumour detection sensitivity with VMI. VMI was also more sensitive than C-CT and MRI in assessing MI, which is thought to be due to the better delineation of lesion boundaries because of clearer contrast. However, the extent of MI and the presence of cervical stromal invasion can be easily misinterpreted because of the strong variation in myometrial enhancement and the lower attenuation in the cervix; therefore, no superiority over C-CT could be confirmed. In addition, the inter-reader agreement among radiologists tended to be lower for VMI than for C-CT. We believe that these were because the readers were not accustomed to reading with VMI and that the reading method was developed using C-CT. Further research and training in reading VMI images may improve the inter-reader agreement. Diagnosing slight MI, accurately determining whether the invasion is less than or greater than half of the myometrium, and identifying the presence of cervical stromal invasion proved to be challenging even with MRI. This is supported by the low inter-reader agreement rate and the tendency for a higher AUC among more experienced radiologists, indicating the complexity of the diagnostic process, which requires a comprehensive assessment of multiple sequences. Particularly, accurate diagnosis can be challenging in cases where the uterine structures are distorted by uterine leiomyomas, in the presence of uterine adenomyosis, or when tumours extend into the uterine horns [20]. In this study, patients with adenomyosis and leiomyoma tended to show deeper MI in VMI. Adenomyosis and leiomyoma in VMI exhibited lower attenuation than in C-CT, complicating their differentiation from tumours and potentially leading to incorrect diagnoses. In such cases, we believe that the risk of misdiagnosis can be reduced by simultaneously evaluating both VMI and C-CT. Additionally, a history of curettage may lead to misdiagnosing on CT. Radiologists should exercise caution, especially in cases where a history of curettage or other procedures that may alter tissue density have been performed.
Conventional CT demonstrated a significantly higher AUC than MRI in diagnosing cervical stromal invasion. This result stems from the difficulty, as previously reported, in identifying the absence of stromal invasion in tumours protruding into the cervical canal or detecting minimal stromal invasion with MRI [21]. In contrast, when diagnosed using C-CT, the cervical invasion was estimated based on the status of the corpus tumour and consequently correlated with the true result. On the other hand, the uterine cervix exhibited lower attenuation of VMI, making it more challenging to identify cervical invasion, than that of C-CT. However, cervical stromal invasion was observed in only 2 cases, thus lacking statistical reliability.
In the detection of lymph node metastasis, VMI showed a trend of higher sensitivity, specificity, accuracy, and AUC values compared to C-CT, while MRI exhibited an even stronger trend of superiority over VMI in these aspects. The lack of statistical significance was thought to be due to the limited number of cases with lymph node metastases. In the detection of lymph node metastasis in EC, CT has been reported to have high specificity but low sensitivity [22,23]. Similar results were obtained in this study.
This study has several limitations. First, because only EC cases were included, a blinded evaluation of tumour detection power was not possible. Second, due to the limited number of positive cases of cervical stromal invasion and lymph node metastasis, the statistical power to detect these conditions was insufficient. Third, because the study focused on surgical cases, there were limited positive cases with crucial ovarian metastasis and peritoneal metastasis for staging classification. Fourth, we used 40 keV VMI, which was considered to have the highest contrast in previous reports [11,16-18], and did not evaluate other low-energy VMI. Finally, the diagnostic performance of MRI was worse than previously reported. However, all 5 radiologists who participated in the reading were certified and had long-term experience in reading abdominal CT and MRI. Furthermore, 3 of them specialise in gynaecology and one has many years of experience in gynaecological imaging. Therefore, the present results reflect the performance of real-world radiologists.
Conclusions
In conclusion, in the evaluation of EC, no significant superiority of diagnostic performance of MRI over CT was identified for all diagnostic parameters, and VMI and C-CT showed a higher sensitivity for myometrial and cervical invasion than MRI, respectively. Therefore, if MRI cannot be performed, it may be possible to substitute MRI in a one-stop evaluation by combining VMI and C-CT.
Disclosures
1. Institutional review board statement: The study was approved by the Institutional Review Board of University of Tsukuba Hospital, with approval number: R03-117.
2. Assistance with the article: None.
3. Financial support and sponsorship: None.
4. Conflicts of interest: None.