Introduction
The primary method of detecting breast cancer is X-ray mammography, which is a widely accessible, cheap, and repeatable examination. The sensitivity of mammography in the imaging of malignant lesions decreases with increasing breast density, and in extremely dense breasts, it is significantly lower compared to fatty breasts [1].
The American College of Radiology (ACR) classifies breast density into one of four categories: almost entirely fatty, scattered areas of fibroglandular density, heterogeneous dense, and extremely dense [2]. Breast density is determined by the ratio of the amount of fibroglandular tissue, including lobules and ducts that are the starting point of breast cancer, to the amount of adipose tissue. The amount of fibroglandular tissue is genetically determined; it may also depend on hormonal stimulation and lifestyle, and usually it gradually disappears with age and the onset of menopause [1]. Extremely dense breast structure occurs in about 8% of patients at the screening age and is an independent risk factor in the development of breast cancer. In this group of patients, the risk of breast cancer is twice as high as in the general population and almost 4-6 times higher than in women with fatty breasts [3,4]. In mammography, fibroglandular tissue attenuates X-rays more than adipose tissue, causing opacity similar to a neoplastic lesion [5]. Therefore, women with extremely dense breasts are at increased risk of missing a neoplastic lesion and hence delayed diagnosis of breast cancer. It is associated with a higher initial stage of the neoplastic disease, a worse response to treatment, and higher mortality [6].
In March 2022, the European Society of Breast Imaging (EUSOBI) issued recommendations that all women of screening age with extremely dense breasts should be informed about their individual breast density and have additional imaging apart from mammography, preferably with magnetic resonance imaging (MRI) [7]. MRI is the most effective method of breast diagnostics so far. Thanks to the ability to visualise the neoangiogenesis accompanying the development of malignant lesions, it provides information on the lesion’s morphology and analysis of the kinetics and dynamics of contrast enhancement. In addition, it allows the evaluation of diffusion images, which makes it a highly sensitive and specific diagnostic examination. It is also a method burdened with high costs, long acquisition and readout times, and limited availability in some regions [8,9].
Contrast-enhanced mammography (CEM) is a technique that, similarly to MRI, allows visualisation of the neoangiogenesis of malignant lesions. It is based on a dual-energy technique that utilises the differences in X-ray attenuation of breast tissues and iodine contrast agents. Unlike standard mammography, in addition to morphological information, it also provides data on contrast enhancement of the lesion [10]. CEM is characterised by high diagnostic sensitivity, and it is an easy-to-learn method with lower costs, a shorter acquisition time than MRI, and better patient tolerance [11,12].
The EUSOBI recommendations do not include the use of CEM as a diagnostic tool in the case of extremely dense breasts due to the insufficient number of available studies on this subject. Our study aims to assess the effectiveness of CEM recombinant images in detecting malignant lesions in patients with extremely dense breasts compared to the all-densities population. Additionally, we decided to check the relationship between the occurrence of extremely dense breasts and background parenchymal enhancement (BPE) type.
Material and methods
Patients who underwent a CEM examination from January 2018 to September 2022 were qualified for the retrospective, single-centre study. Due to the retrospective nature of this study, the institutional Ethics Committee repealed the requirement for informed consent. All the test procedures complied with the ethical principles of the 1964 Helsinki Declaration and its subsequent amendments.
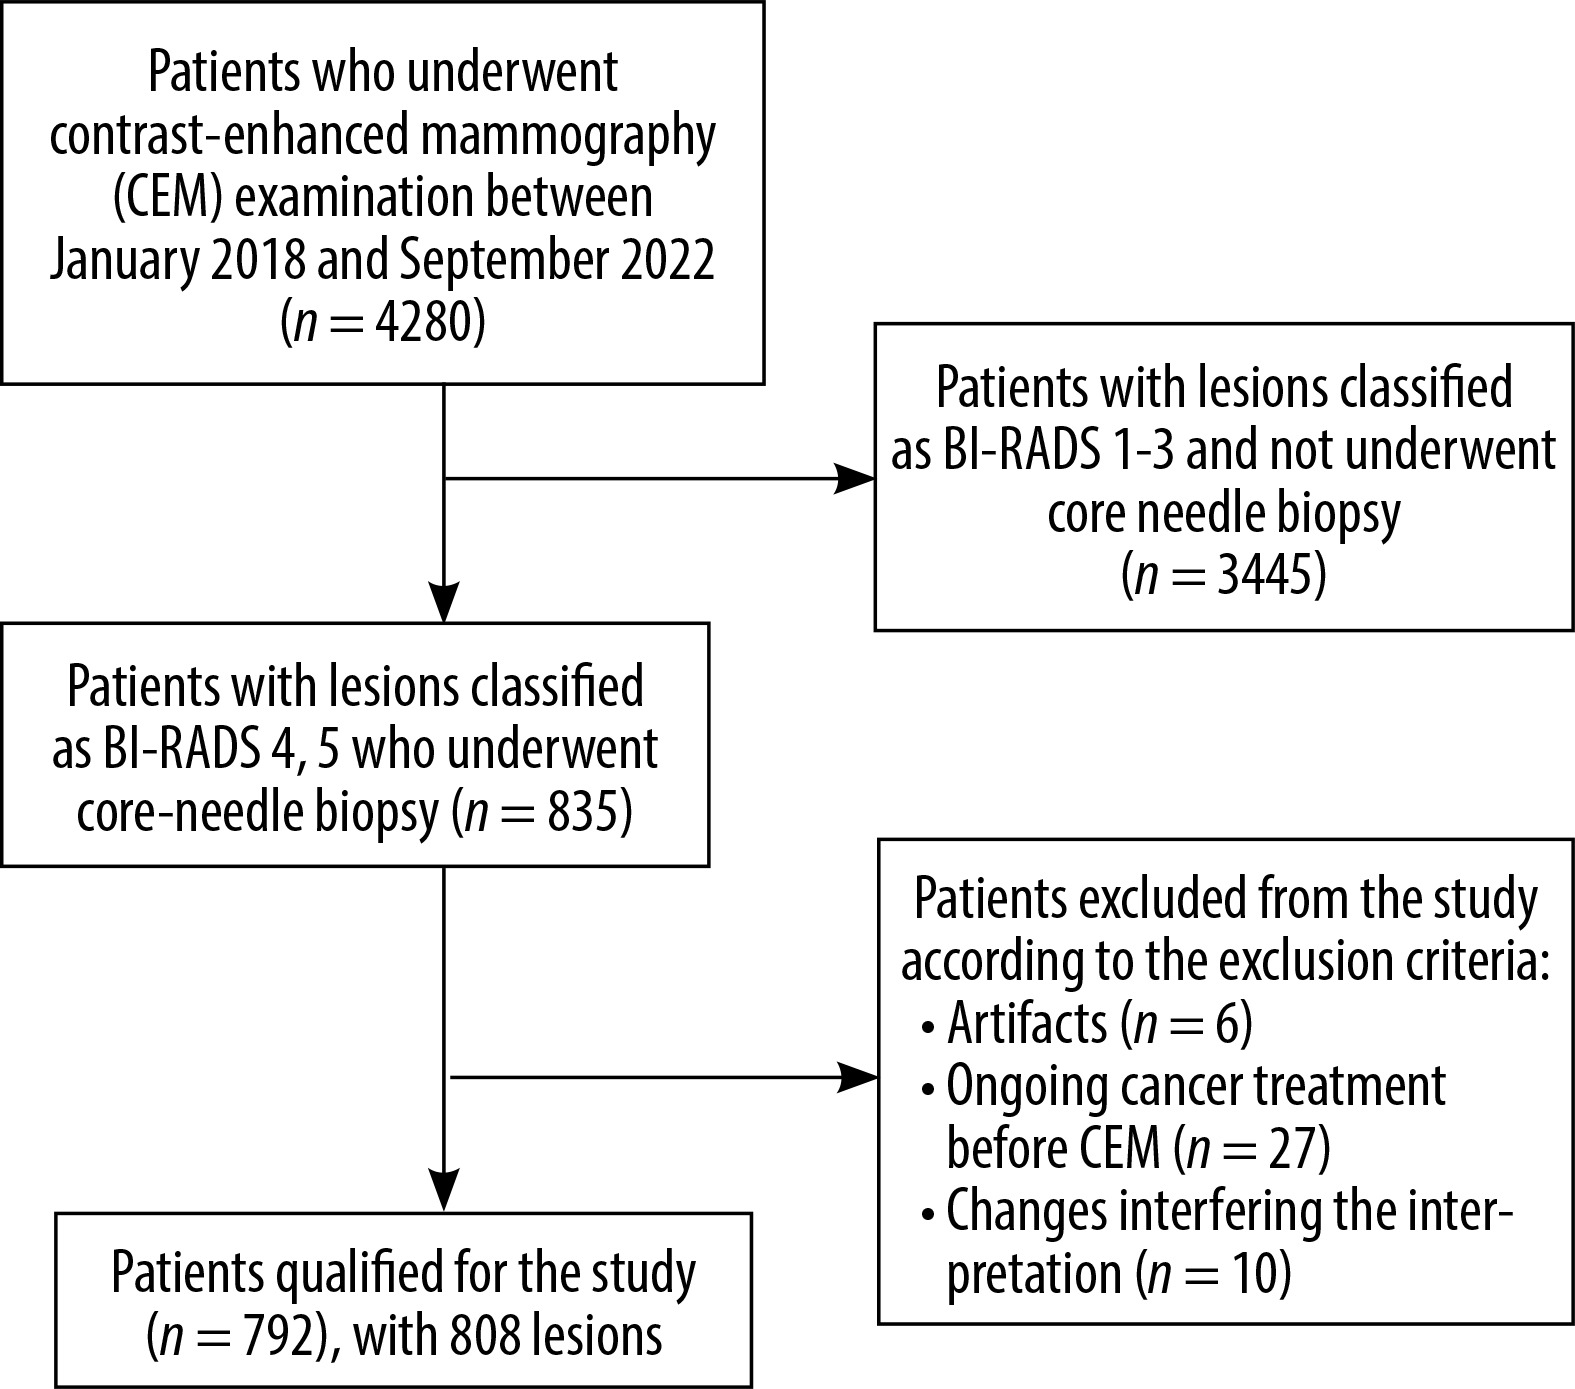
The population of patients qualified for CEM consisted of patients with an increased risk of breast cancer, based on data from each woman’s medical records, prior breast imaging reports, and family history of breast cancer (except for patients with a known mutation in the BRCA 1, BRCA 2 genes, who typically undergo breast MRI). Additionally, the group included patients referred to our centre from centres with lower reference levels, with suspicion of breast cancer, to confirm the existence of the disease (and to perform a core needle biopsy) and, in the case of discrepancies between the mammographic and US images, to determine further treatment. The study included patients with lesions classified based on CEM images as BI-RADS 4 or 5, who had undergone a core needle biopsy and obtained histopathological results when writing the paper. Exclusion criteria from the study were as follows: severe artefacts on CEM images (e.g. halo artefact, blurred images), patients during anti-cancer treatment in whom CEM was performed after initiation of treatment (due to a possible response to treatment and a change in the image morphology of the primary lesion), and examinations with changes that significantly disturb the interpretation of the image (intensive inflammatory changes, abscesses, haematomas). Detailed information on the patients included in the study is presented in Figure 1.
Lesions assessment
For the study purposes, all CEM examinations were reassessed by 2 independent radiologists, blinded to clinical history and each other, with a minimum of 10 years of experience in MMG assessment and approximately 5 years in CEM assessment. All the potential conflicts were resolved by a third radiologist with 8 years of experience in the CEM and 20 years of experience in the MMG assessment. Radiologists classified all CEM examinations into one of four categories according to the ACR [2]:
A – breasts almost entirely fatty, < 25% glandular tissue,
B – adipose-glandular breasts, 25-50% of scattered areas of fibroglandular tissue,
C – glandular-fatty breasts, 50-75% heterogeneous fibroglandular tissue,
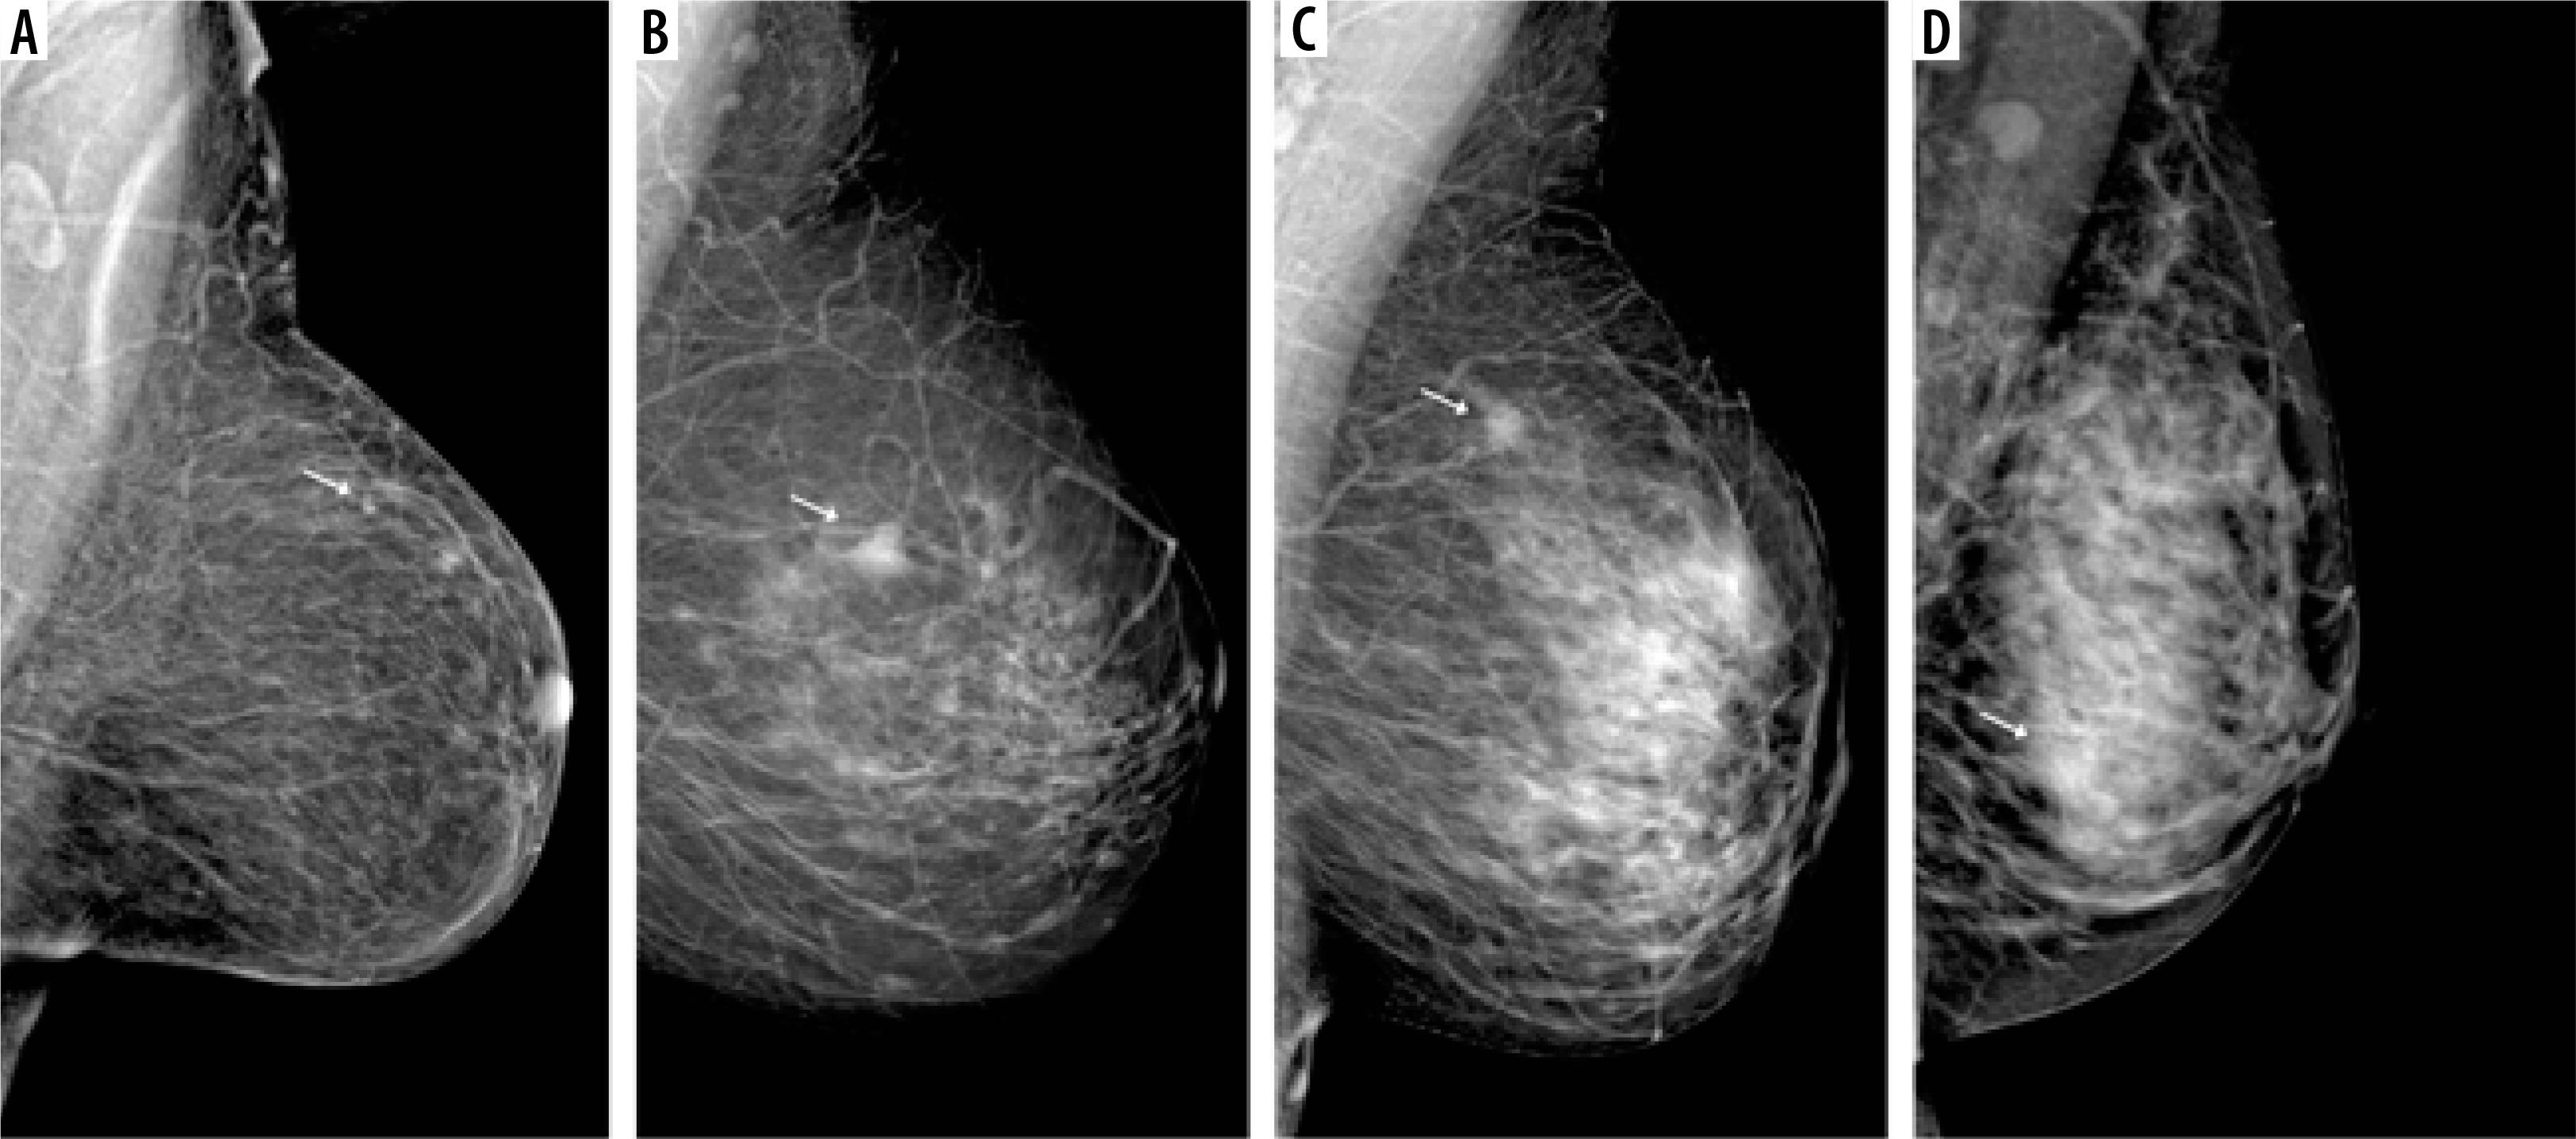
D – breasts extremely dense, with > 75% fibroglandular tissue (Figure 2).
Subsequently, the CEM images and contrast enhancement of the lesions were assessed and classified into enhanced and non-enhanced groups. Lesions that were enhanced were considered true positive changes; those that were not enhanced were considered true negative lesions.
Figure 2
Visibility of breast lesions in low-energy contrast-enhanced mammography (CEM) images, depending on the ACR category. White arrows mark suspicious lesions; all lesions had a histopathological diagnosis of invasive carcinoma NST. A) ACR A, clearly visible, small, irregular focal lesion, not obscured by fibro-glandular tissue. B) ACR B, an irregular lesion clearly visible against the background of fibro-glandular tissue. C) ACR C, a small, irregular focal lesion with a density similar to fibro-glandular tissue. D) ACR D, a lesion that is very poorly distinguished against the background of extremely dense fibro-glandular tissue, visible only as an area of architectural distortion
All images were displayed on a dedicated mammography workstation (IDI MammoWorkstation 4.7.0, GE Healthcare). Then, the mammographic images were associated with the histopathological examination results.
Image acquisition
All CEM examinations were performed in our department using 2 digital mammographs dedicated to dual-energy CEM acquisitions (SenoBright, GE Healthcare, 3000 N. Grandview Blvd., Waukesha, WI, USA, and Giotto Class, IMS Giotto, Sagittario, 5, 40037 Sasso Marconi BO, Italy). An intravenous injection of 1.5 ml/kg of body mass of non-ionic contrast agent was performed using a power injector at a rate of 3 ml/s with a bolus chaser of 30 ml of saline. The device programmed in the CEM mode automatically took a pair of low- and high-energy exposures in each projection, and then specific image processing of both energy images was performed. This processing aimed to obtain subtraction images to highlight contrast enhancement and suppress structured noise due to fibroglandular breast tissue. For each view, the CESM technique made it possible to obtain 2 images: a low-energy acquisition at 26-30 kVp and a high-energy acquisition at 45-49 kVp, with these values depending on breast density and thickness. All the images obtained were in the DICOM format. The total examination time was usually 10 min. After examination, the patients were observed for approximately 30 min for any adverse reactions that may have occurred after administration of the contrast agent.
Histopathology examination
The histopathological result was the reference standard in our study. All core-needle biopsies of suspicious lesions were performed at our centre. After collection, all samples were immediately placed in a 10% buffered formalin solution and sent to the Department of Pathomorphology and Molecular Diagnostics. Tissues were described and processed routinely for paraffin embedding within 48 hours of collection. Paraffin blocks were sliced into 4 μm sections stained with haematoxylin and eosin and evaluated by a team of experienced pathologists. Depending on the clinical situation and histopathological picture, the tissue material secured in the block could perform additional sections in more profound levels and immunohistochemical tests (e.g. oestrogen and progesterone receptors, Ki-67).
Statistical analysis
Statistical analysis was performed using Statistica 13.1. Statistical results were considered significant when p-values were less than 0.05. All tests were 2-tailed. Interval data were presented as mean ± standard deviation or median with lower quartile – upper quartile in case of skewed or non-normal data distribution. Nominal and ordinal data were presented as numbers and percentages. Odds ratio (OR) with a corresponding 95% confidence interval (CI) and p-value was used to assess the diagnostic performance of CEM. Based on a 2 × 2 table, sensitivity, specificity, positive predictive value (PPV), and negative predictive value (NPV) were calculated with corresponding 95% CI.
Results
A total of 792 patients with 808 breast lesions, with an average age of 56 ± 14 years (age range 18-89 years) were qualified for the study. Table 1 summarises basic characteristics of the group.
Table 1
Characteristics of the study group and breast lesions
Patients and lesions characteristics
Among all patients qualified for the study, the most common type of breast structure was adipose-glandular breasts (56.9%), followed by heterogeneously dense breasts (22.7%), extremely dense breasts (10.9%), and fatty breasts (10.5%) (Figure 2). In the case of background parenchymal enhancement (BPE), for the entire group of patients, 40.8% showed mild, 33.1% showed minimal, 18.4% moderate, and 7.7% marked enhancement. For the group of patients with extremely dense breasts, BPE was as follows: 34.9% moderate, 31.4% marked, 25.6% mild, and 8.1% minimal (Figure 3).
Figure 3
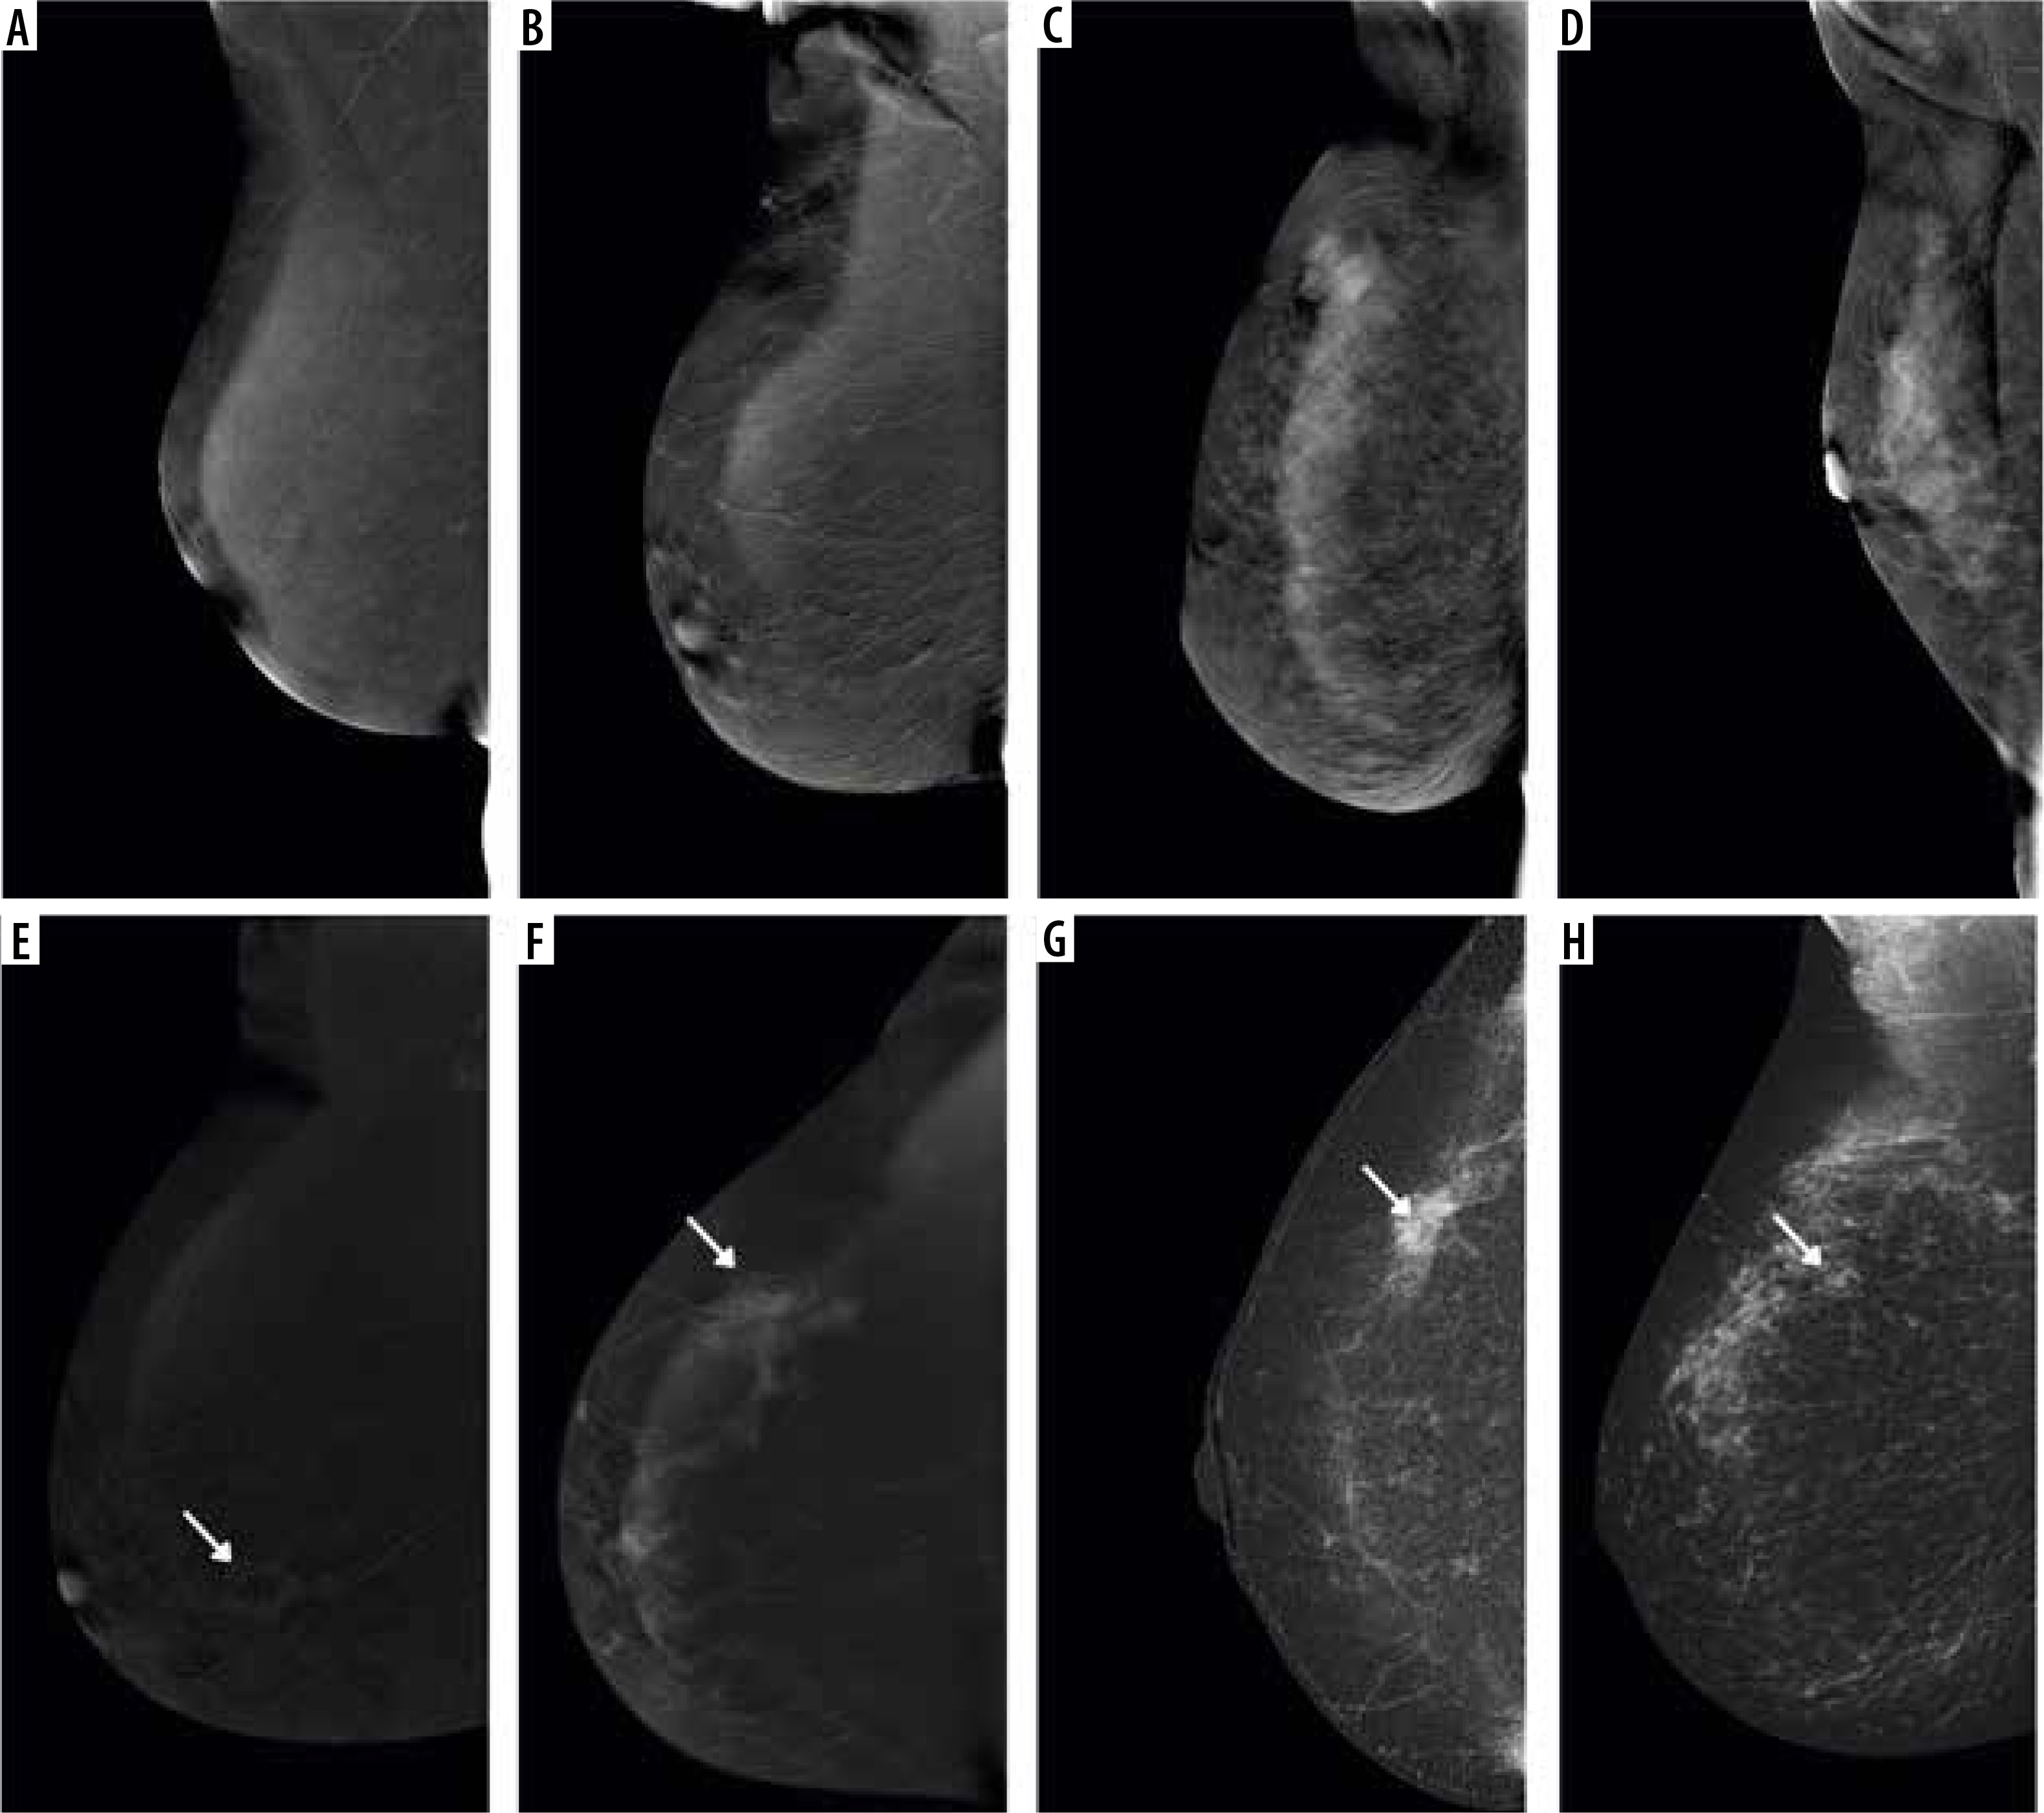
Different types of background parenchymal enhancement (BPE): (A) minimal, (B) mild, (C) moderate, and (D) marked. Visibility of breast lesions in recombined contrast-enhanced mammography (CEM) images, depending on the BPE type: (E) a low enhancing spicular lesion (white arrow) clearly visible on the background of minimal BPE (invasive carcinoma NST), (F) a moderate enhancing, irregular lesion (white arrow) on the background of mild BPE (invasive carcinoma NST), (G) a high enhancing, indistinct lesion (white arrow) on the background of moderate BPE (invasive lobular carcinoma), (H) a moderate enhancing, obscured lesion (white arrow) poorly distinguished on the background of marked BPE (ductal carcinoma in situ)
The size of lesions in the whole group ranged from 2 to 140 mm (median 18 mm; quartiles: 10-30 mm), and in the case of the group with extremely dense breasts it ranged from 3 to 90 mm (median 17 mm; quartiles: 10-28 mm).
The histopathological examination revealed the presence of 52.6% malignant lesions in the whole group, and in the case of breasts with an extremely dense structure – 43%. In the case of the entire study group, the most common malignant lesions had the morphology of a nodule (53.2%), and the most common histopathological diagnosis was invasive carcinoma NST (58.1%). Similarly, in the group of extremely dense breasts, malignant lesions also most often had a nodular morphology (46%), and invasive NST carcinoma was the most common histopathological diagnosis (59.5%) (Figures 4 and 5).
Figure 4
A 50-year-old patient with a palpable tumour on the border of the upper quadrants. A) Low-energy contrast-enhanced mammography (CEM) image, the white arrow indicates an area of architectural distortion, poorly distinguishable against the fibro-glandular tissue. B) CEM recombined image, white arrow indicates a spicular, strongly enhancing tumour, much larger than in low-energy images. C) Lobules dilated by neoplastic cells (lobular carcinoma in situ) surrounded by diffuse, inconspicuous infiltration of invasive lobular carcinoma
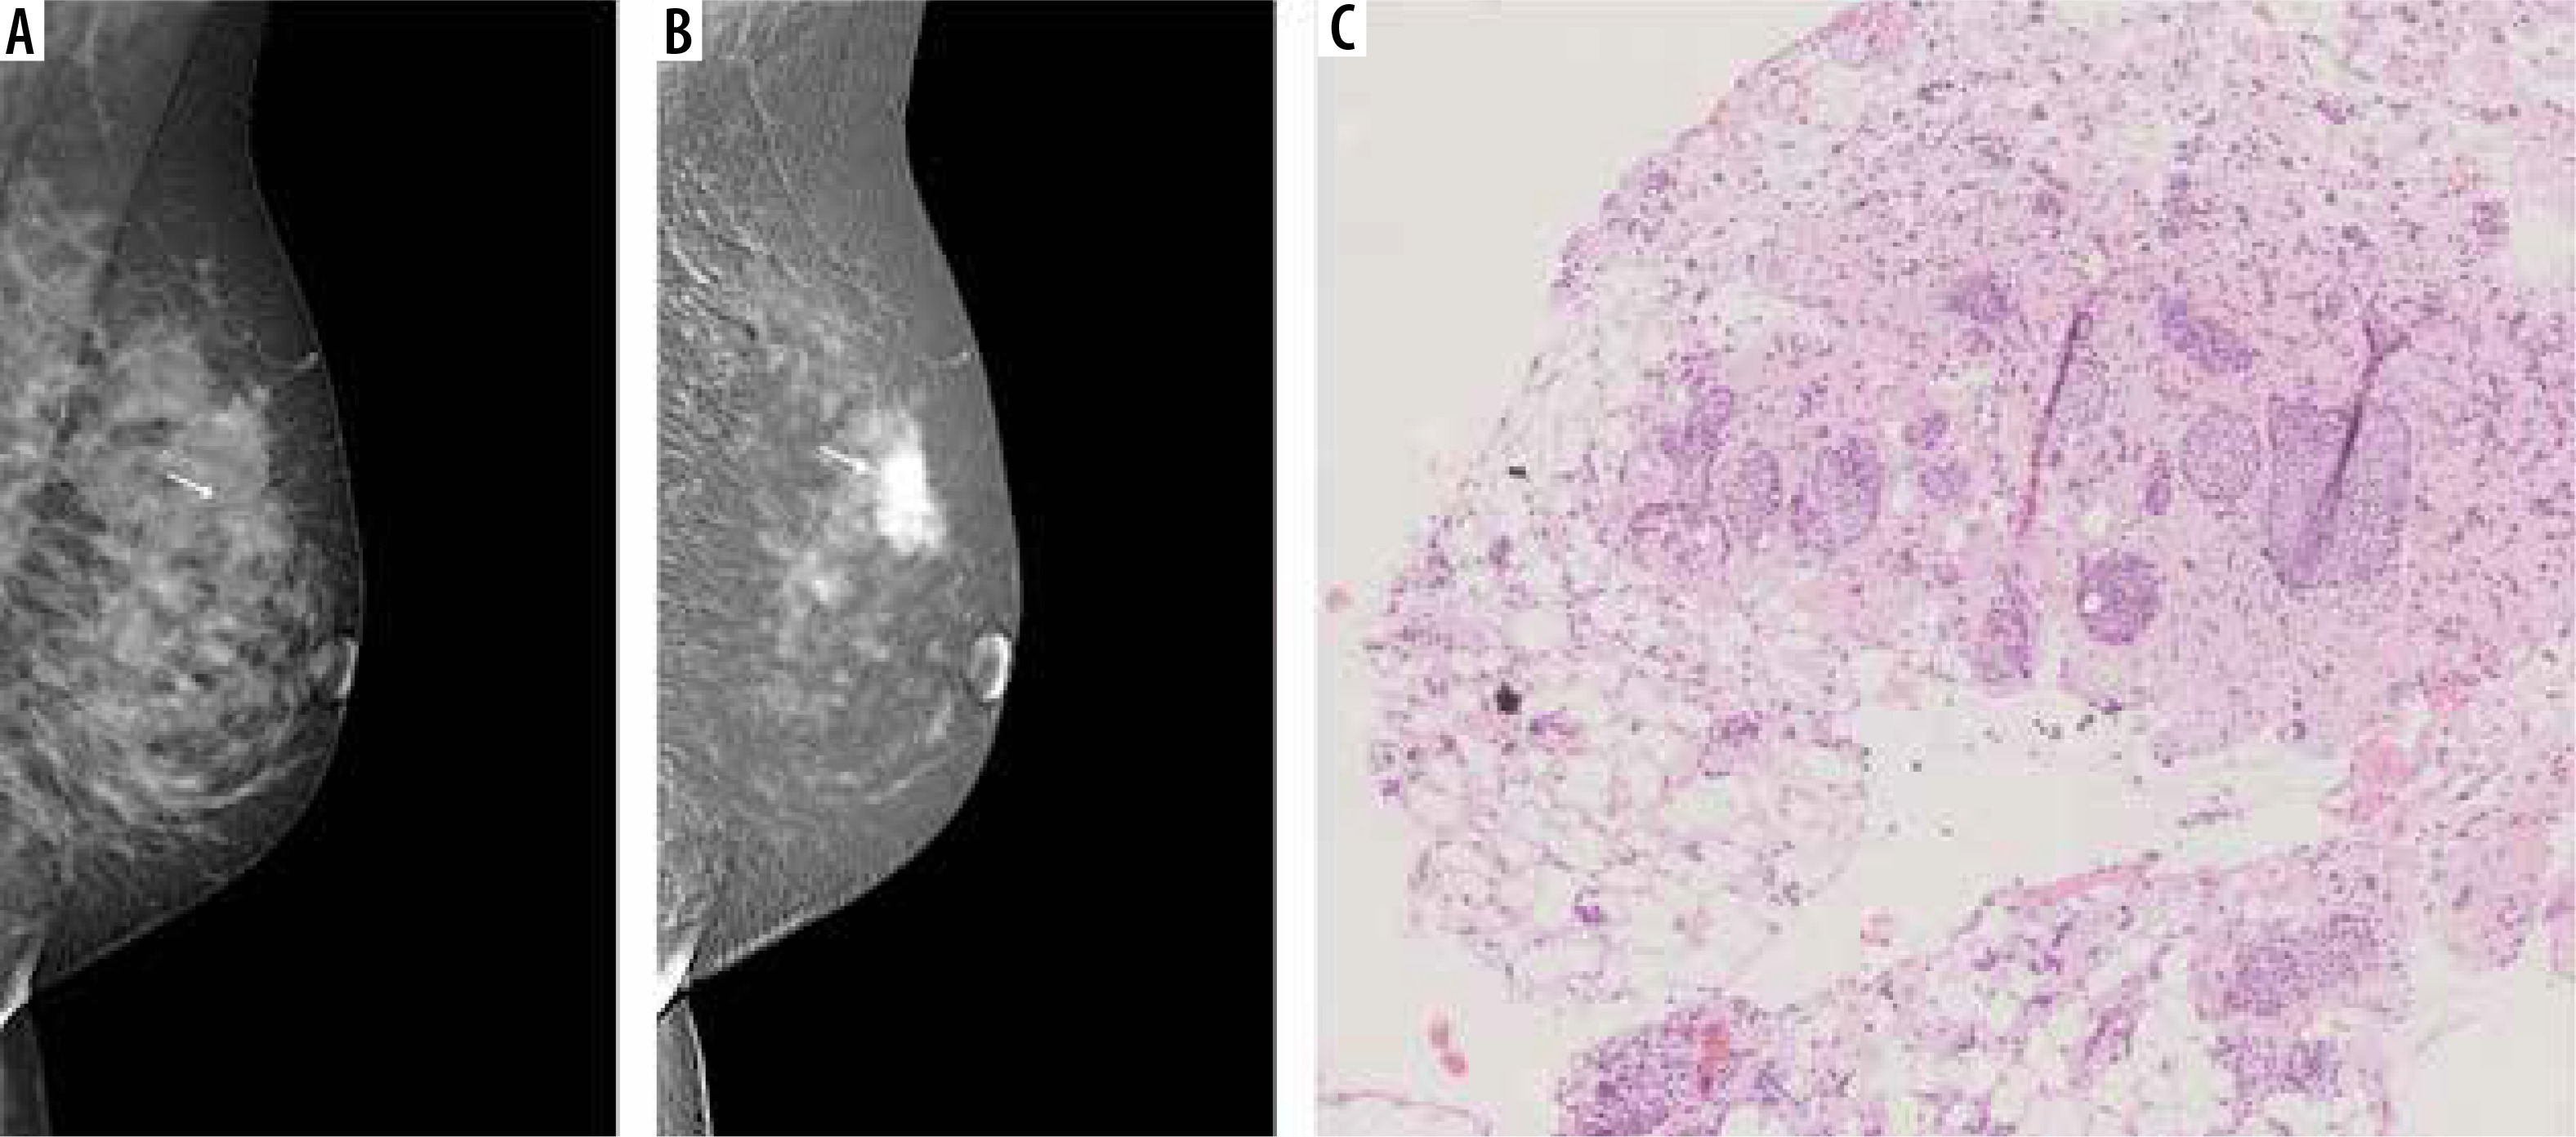
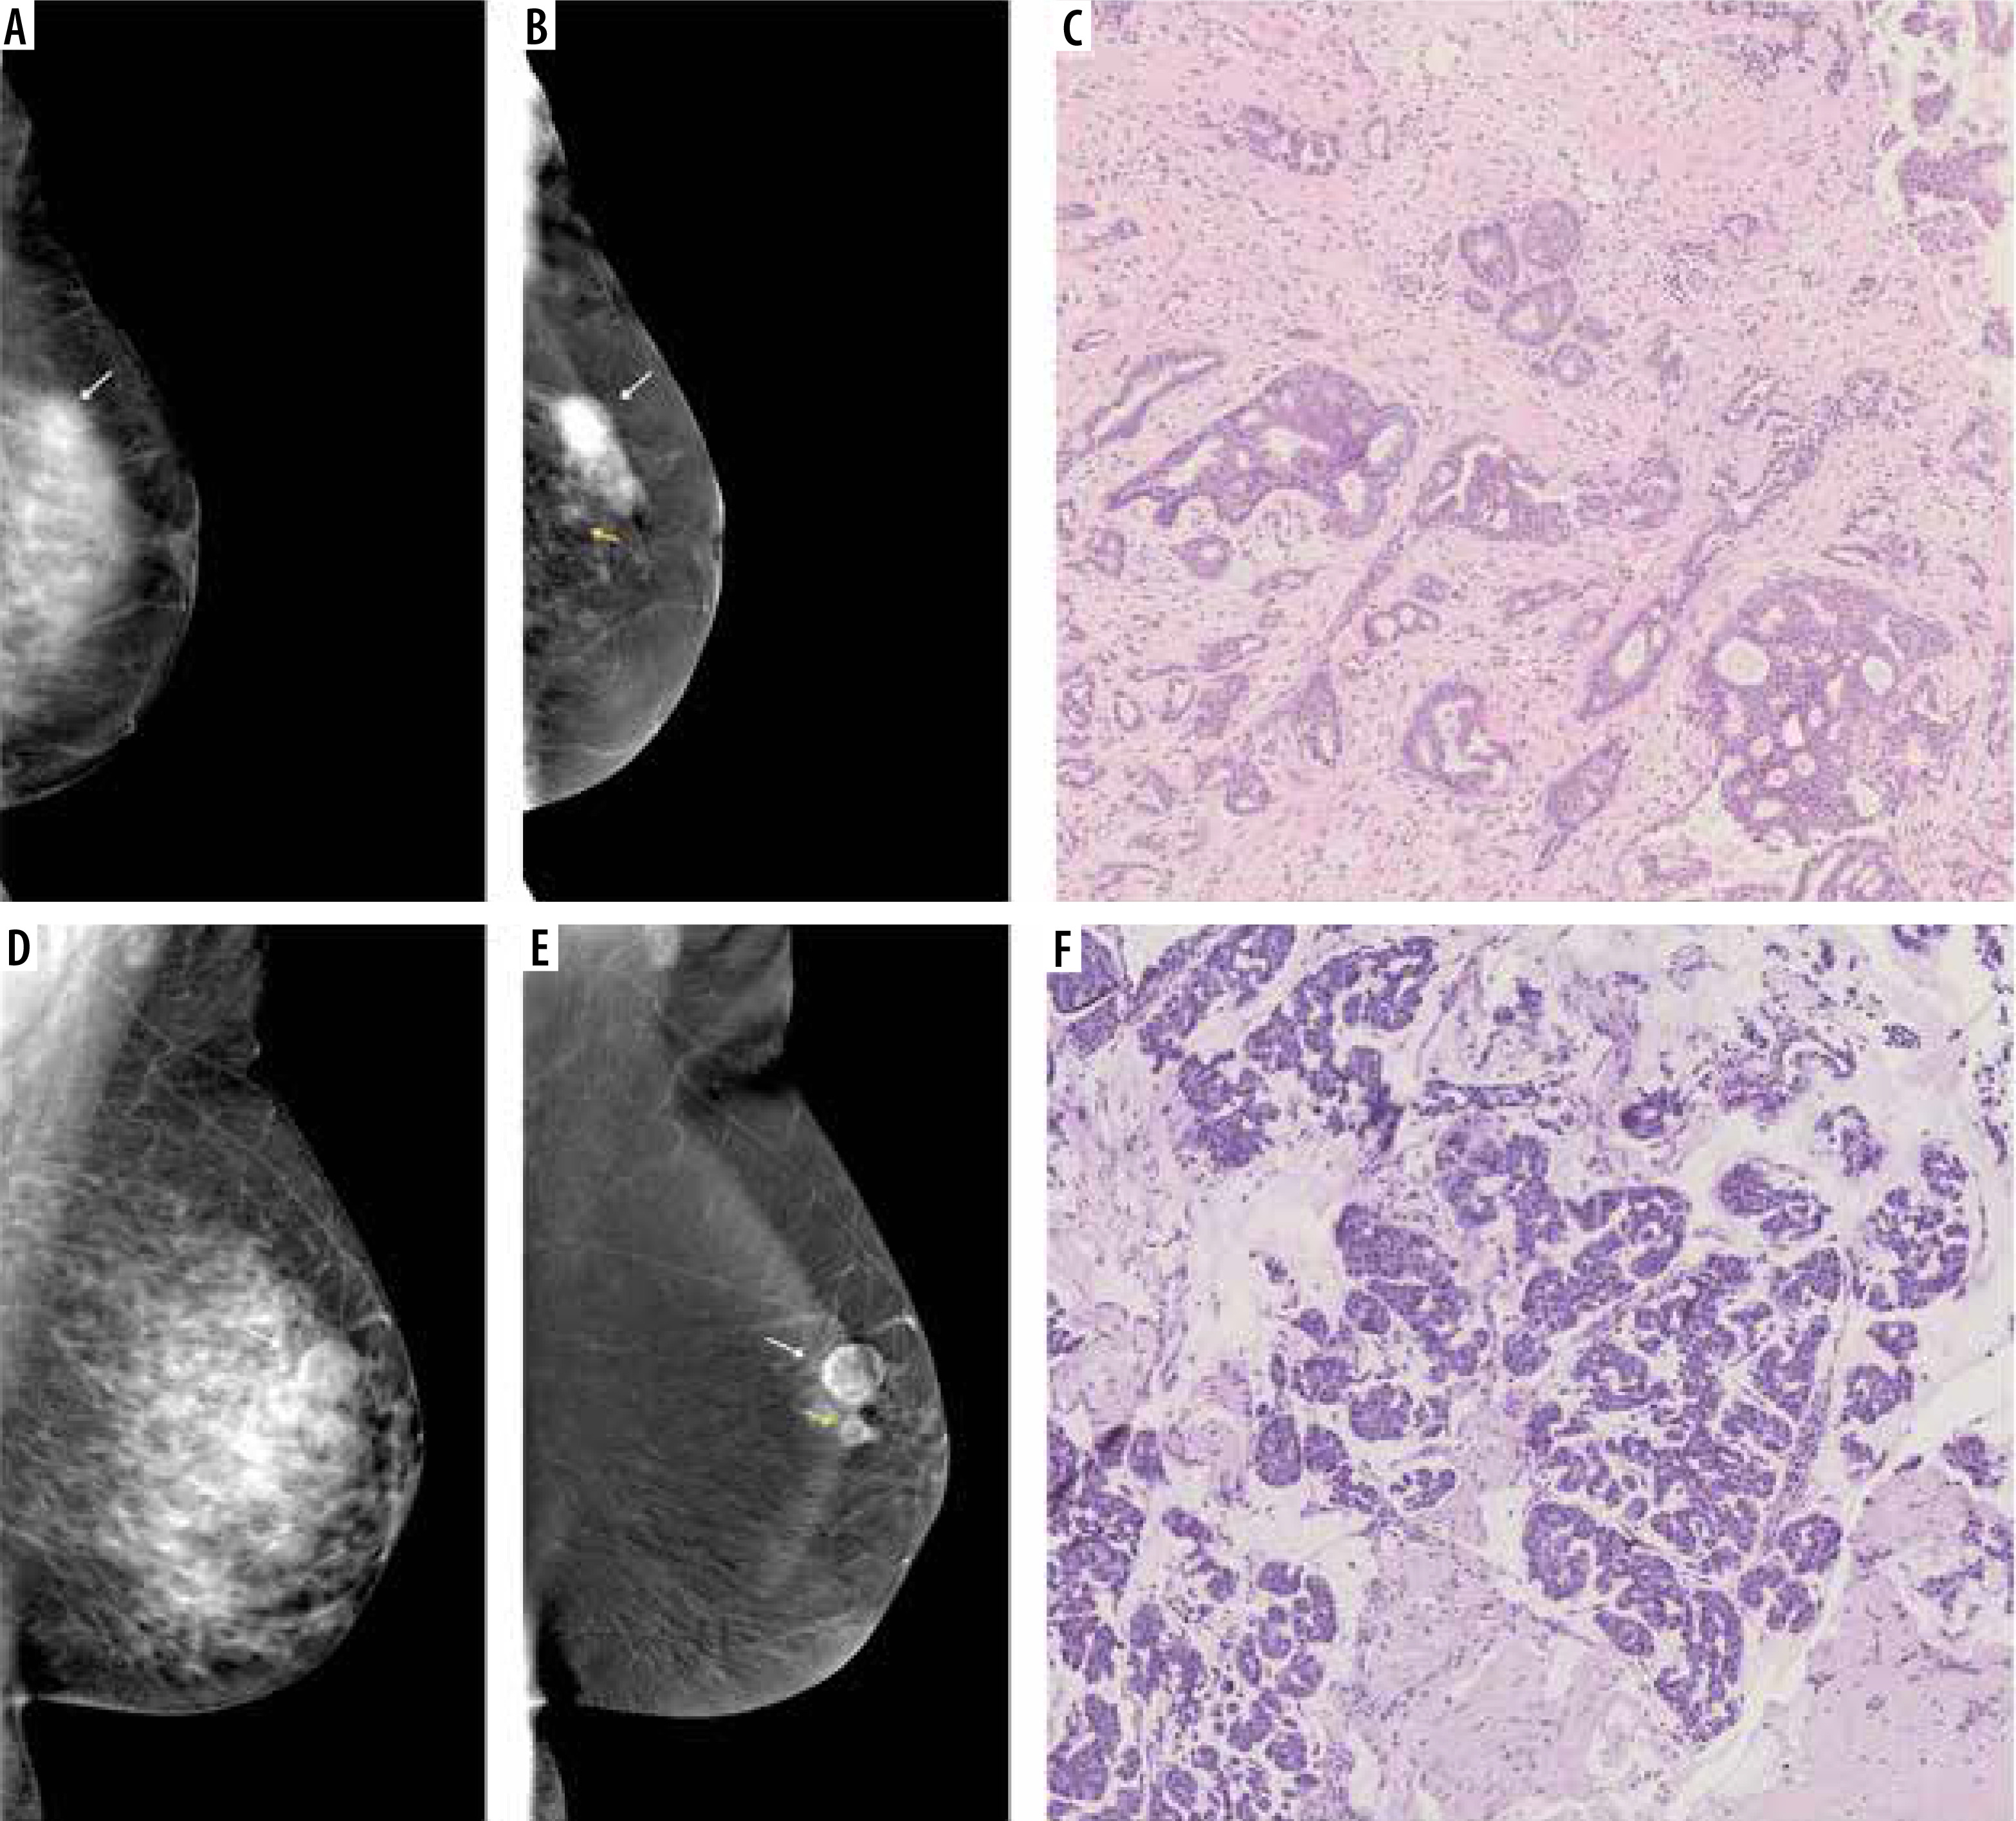
Figure 5
Multifocal neoplastic processes of the breast. A) On low-energy contrast-enhanced mammography (CEM): only clusters of pleomorphic microcalcifications are visible against the background of dense glandular tissue (white arrow). B) On the recombined CEM image the projection of the microcalcifications shows a diffuse area of inhomogeneous enhancement (white arrow), and 2 additional enhancement foci anterior to it (yellow arrows). C) Invasive carcinoma NST and foci of ductal carcinoma in situ in collagenous stroma. D) A well-circumscribed oval lesion is visible on a low-energy CEM image (white arrow). E) In the recombined image, the lesion is inhomogeneously enhanced (white arrow), and a second enhancement foci is visible below (yellow arrow). F) Pink sclerotic fibrosis mixed with empty-looking mucinous pools with floating clusters of mucinous carcinoma cells
Benign lesions with the morphology of a nodule were the most common in both groups: 42.3% and 44.9% for the whole group and the group with extremely dense breasts, respectively. The most common histopathological diagnosis for benign lesions was fibroadenoid lesions, which occurred in 51.4% of the whole group and in 49% of the group with extreme breast density. Table 2 presents detailed information on the histopathological nature of the lesions, divided into individual groups of density according to the ACR.
Table 2
Detailed histology of the lesions included in the study
Diagnostic performance
Among all malignant lesions in the entire group, only 16/425 (3.8%) did not enhance after intravenous administration of a contrast agent in CEM examination. All these lesions had the morphology of microcalcifications and the following histopathological diagnoses: 9 ductal carcinomas in situ, 6 invasive lobular carcinomas, and one invasive medullar carcinoma. In the case of extremely dense breasts, only 1/37 (2.7%) malignant lesions did not enhance and was diagnosed as invasive lobular carcinoma.
Of all benign lesions, 39.9% showed contrast enhancement and had the following morphology: nodule (59.5%), microcalcifications (21.5%), asymmetry (13.1%), and nodule and microcalcifications (5.2%). The most frequent histopathological diagnosis among benign enhancing lesions was fibroadenoma (58.2%) and fibrosis/FCC/fibroadenomatoid hyperplasia (27.5%). In the case of extremely dense breasts, 40.8% of the benign lesions enhanced in CEM. The morphology of these lesions was as follows: nodule (35%), microcalcification (50%), asymmetry (10%), nodule and microcalcification (5%), and the most common histopathological diagnosis was fibroadenoma (50%) and fibrosis/FCC/fibroadenomatoid hyperplasia (20%).
The sensitivity of recombinant CEM images in the detection of malignant lesions for the group of all patients was 96.2%, specificity 60%, PPV 72.8%, and NPV 93.5%. In the group of patients with extremely dense breasts, the sensitivity of the method was 97.3%, specificity 59.2%, PPV 64.3%, and NPV 96.7%. The consistency of the histopathological examination with the presence of enhancement in CEM for the group of all density types and extremely dense breasts is presented in Table 3.
Table 3
Diagnostic performance of CEM in the assessment of patients with all breast density categories and with extremely dense breasts
Discussion
CEM combines information about the morphology of breast lesions and their contrast enhancement. It enables the visualisation of lesions undetectable on standard mammograms despite the overlapping of glandular-fibrous tissue. Both CEM and MRI (currently the most effective breast imaging method) work on a similar principle – the possibility of detecting neoangiogenesis accompanying malignant neoplastic lesions. A meta-analysis by Neeter et al. [13], comparing the diagnostic performance of CEM and MRI, showed that the sensitivity of CEM in detecting malignant lesions in the breasts did not differ significantly from MRI, at 96% vs. 97%, respectively. The CEM sensitivity was comparable in our work and amounted to 96.2% for the whole group. In the case of the group with extremely dense breasts the sensitivity was 97.3%, and other researchers obtained similar results. The work of Sudhir et al. [14] showed that the sensitivity of CEM in detecting malignant lesions in dense breasts, classified as C and D according to the ACR, was 96.5% and was higher than the sensitivity of other diagnostic methods, including DBT, mammography, and ultrasonography. In addition, CEM detected several subcentimetre lesions that were missed by other methods. In the work of Rudnicki et al. [15] on a group of Polish patients from a region of the country similar to that of our study, the sensitivity of CEM in the case of extremely dense breasts was as high as 100%. In the work of Łuczyńska et al. [16], the sensitivity of CEM in the patients with extremely dense breasts was 92.7%, higher than in the case of mammography and ABUS. In the study by Qin et al. [17], sensitivity was estimated at only 82.4%. Such a discrepancy in the results may result primarily from the relatively small patient groups in the mentioned studies. Additionally, in studies on Asian populations, where extremely dense breasts are much more common than in Europe, CEM allowed a change in the extent of breast surgery in 18% of the examined patients with dense breasts by visualising new lesions or showing a more extensive infiltration of a neoplastic lesion [18,19].
Non-enhancing lesions on recombinant images are considered potentially benign. However, 16 false-negative results were obtained in our study. All these lesions had a microcalcification morphology. Of these, 6 were invasive lobular carcinoma, which rarely has the morphology of microcalcifications only [20]. Considering the accompanying degree of BPE, which was moderate in 5 cases and marked in one case, BPE could have masked the enhancing component of the lesion. In 9 cases, the microcalcifications were ductal carcinoma in situ (DCIS), which may manifest only as ductal microcalcifications without other morphological features [21,22]. The degree of BPE associated with these microcalcifications was mild in 7 cases, minimal in one, and moderate in one, which may not have significantly impacted the interpretation of the results.
These results do not differ from the work of other researchers [23,24]. They are reflected in the supplement to the BI-RADS lexicon on the interpretation of CEM images, published in 2022, and confirm that in the case of changes in the morphology of microcalcifications, the presence or absence of enhancement does not indicate malignancy. The decision to perform a biopsy should not depend on it [2,10]. Therefore, the key to the interpretation of CEM is the assessment of both low-energy and recombinant images. Our work focused on assessing only the presence of enhancement on recombinant images as an added value compared with standard mammography, and non-enhancing malignant lesions were considered false negatives. Considering low-energy images and current ACR recommendations regarding the interpretation of malignant microcalcifications, the sensitivity of CEM would be even higher.
CEM, despite its high diagnostic sensitivity, is characterised by lower specificity, which in our study was 60% for the group of all patients and 59.2% for the group of patients with extremely dense breasts. The relatively low specificity of CEM is primarily because 39.9% of benign lesions showed contrast enhancement. Most of these changes in the histopathological examination were fibroadenomas (58.2%), followed by fibrosis/FCC/fibroadenomatoid hyperplasia (27.5%), and papillomas (6.5%). Fibroadenomas may differ significantly in the degree of vascularisation, which depends on the fibrous and cellular proportions [25], and papillomas morphologically have a vascular pedicle, which may be responsible for enhancement within the lesion [26,27]. Therefore, it should be assumed that the relatively low specificity of CEM is because benign lesions may show increased vascularity, which will lead to false positive results. This problem also applies to breast MRI. In a meta-analysis by Neeter et al. [13], the pooled specificity was 77% for both MRI and CEM. However, in the same meta-analysis, the pooled DOR estimates indicate a higher overall diagnostic performance of breast MRI than CEM (122.9 vs. 79.5). The higher specificity of MRI about CEM is primarily because a dynamic MRI examination is performed as a standard to assess the dynamics and kinetics of the enhancement of pathological foci and information about diffusion imaging [28,29].
Recently, some authors have shown that increased BPE may be associated with an increased risk of breast cancer [30,31]. In our study, marked enhancement of the stroma in all patients was 7.7%, and in the group of patients with extremely dense breasts, it was significantly higher, at 31.4%. A similar distribution of BPE as in our work was obtained in the work of Karimi et al. [32], where marked enhancement occurred in 7% of patients, and in the case of extremely dense breasts, 25% of patients had marked enhancement, less than in our study, but the study group was also smaller. Other authors have also shown that high BPE was significantly associated with breast density [30,31,33]. Patients with extremely dense breasts not only have an increased risk of breast cancer but also have a higher incidence of marked BPE, which may be an additional risk factor. Additionally, as we showed above, severe BPE may be a factor masking the presence of enhancement of a suspected cancer lesion.
Our study had some limitations. The most important limitation of our study is the relatively broad and heterogeneous study group with multiple clinical contexts, which was dictated by an attempt to collect as large a group of patients with different breast densities as possible. Another limitation is that our centre is an oncological facility in which the characteristics of patients, the occurrence of malignant lesions, and the stage of the disease differ from that of the general population. However, it should be considered that it is in our centre that patients from the groups at increased risk of breast cancer are observed. Patients from other centres are referred for the diagnosis of ambiguous lesions, and thus the number of discreet and difficult-to-date lesion cases is increasing. Another area for improvement is the need to compare it with other methods, e.g. MRI. In this regard, multicentre studies on large groups of patients are needed.
Conclusions
In conclusion, CEM is a highly sensitive method for diagnosing breast cancer, regardless of breast density. The specificity of CEM is relatively low, which is primarily because some benign lesions may contain more blood vessels. In patients with extremely dense breasts, who, according to EUSOBI recommendations, should additionally perform breast MRI, CEM could serve as a complementary or additional examination in the absence or low availability of MRI. Patients with extremely dense breasts are more likely to have marked BPE, which is an additional risk factor.