Introduction
Apical periodontitis (AP) is an inflammatory lesion in the periradicular tissues, which is usually caused by bacterial pathogens invading the tooth pulp, leading to apical bone resorption [1,2]. AP is frequently asymptomatic and identified through radiography as radiolucencies. While histopathology is the gold standard for confirming the diagnosis of this disorder, its use is limited by its cumbersome and labour-intensive nature, and potential for damage, destruction, and irreversible loss of samples; so it is not ethical or safe enough to use the given method routinely in all patients [2,3]. Therefore, imaging techniques with high diagnostic accuracy are preferable. In this regard, periapical and panoramic radiographs are standard options used by clinicians; however, they have some inalienable limitations, such as possible missing detection of lesions (e.g. cancellous bone, extensive bone resorption) due to superimposition and distortion of essential structures [4,5].
Cone-beam computed tomography (CBCT) has been used widely for imaging the dentomaxillofacial region over the past 2 decades. It is a 3-dimensional imaging system that can visualize anatomic structures with higher resolution [6-8]. Unfortunately, conflicting results exist on the diagnostic performance of CBCT in predicting periapical and apical lesions [9-11]. In the present study, we aimed to carry out a contemporaneous systematic review and meta-analysis of studies reporting the accuracy values for CBCT imaging in the detection of the apical radiolucencies in patients with AP. Our results will hopefully improve clinicians’ knowledge of the reliability of the imaging procedures currently utilized for AP diagnosis. Early diagnosis and endodontic treatment of AP will potentially help in improving the long-term prognosis of the patients.
Material and methods
Search strategy and eligibility criteria
We searched the Embase, PubMed, Cochrane library, and Scopus databases for literature published from inception to 30 June 2023 without language restriction using the following keywords: “sensitivity” OR “specificity” OR “accuracy” AND “periapical lesion” OR “periapical lesions” OR “periapical periodontitis” OR “periapical disease” OR “periapical diseases” OR “periapical pathology” OR “apical lesion” OR “apical lesions” OR “apical periodontitis” OR “apical disease” OR “apical diseases” OR “apical pathology” OR “apical radiolucency” OR “apical radiolucencies” OR “periapical radiolucency” OR “periapical radiolucencies” AND “cone-beam computed tomography” OR “CBCT”. The search was applied to title/abstract. We included the studies that reported the diagnostic accuracy values of CBCT in the detection of the apical radio-lucencies among AP human patients by comparing AP diagnosis with a control group without lesions. The exclusion criteria included the following: (1) reviews, case reports, editorials, and letter to the editors; (2) studies with unextractable data on our study outcomes; (3) duplicate papers; (4) full-texts not being available; and (5) in vitro or ex vivo surveys. We reported the present study according to the PRISMA (Preferred Reporting Items for Systematic Reviews and Meta-Analyses) guidelines [12].
Study selection and data extraction
We screened independently the sources identified through the database search using pre-designed eligibility forms. The full texts of the papers potentially related to the outcome of the present study were obtained and assessed. Any disagreements were resolved by consensus. We extracted the following data from the eligible studies finally included: first author’s name, publication year, study country, sample type, sample size, and values of CBCT diagnostic performance (sensitivity, specificity, positive predictive value [PPV], negative predictive value [NPV]). In addition to CBCT data, we tried to extract the information of other imaging methods performed on the same sample (control) for further analyses.
Risk of bias assessment
We utilized the adapted Prediction Model Risk of Bias Assessment Tool (PROBAST) criteria to assess the risk of bias of the included studies [13]. After applying the PROBAST criteria, we rated each study as having a low, high, or unclear risk of bias and concerns about applicability. A detailed summary of the assessment tool is provided in the Results.
Statistical analysis
We pooled the diagnostic accuracy values of CBCT using a random-effects model. We also estimate the pooled diagnostic accuracy for digital radiography as a subgroup analysis. The estimates were presented as percentage and 95% confidence interval (CI). We examined the heterogeneity between the surveys by I2 statistic, which ranges from 0.0% to 100.0%; a p-value less than 0.10 was considered significant [14]. We provided forest plots to visualize the meta-analysis findings by arraying the point estimate (diagnostic value) and 95% CI within a study in a horizontal orientation. In addition, publication bias was evaluated using a funnel plot – a scatter plot of the size of the studies against the effect sizes they report; an asymmetry in the funnel plot represents the publication bias. Publication bias can yield overestimated effect sizes and may suggest the existence of non-existing effects. We also performed subgroup analyses by publication date, study region, and sample size. As additional attempts to find the potential sources of heterogeneity, Galbraith plots were constructed to spot the outlier studies. Leave-one-out metaanalyses were also performed to appraise the influence of each study on the overall estimates. The statistical analyses were done using the Comprehensive Meta-Analysis and STATA software packages.
Results
Search results, study selection, and characteristics
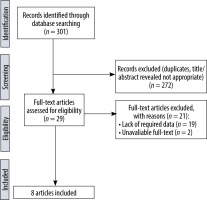
In total, 301 citations were initially generated by our search strategy, of which 293 were excluded due to duplication or unsuitability. Finally, a total of 8 eligible articles were retrieved and enrolled in this systematic review and meta-analysis [15-22]. Figure 1 illustrates the search strategy and study selection according to the PRISMA. All articles were published in English. The publication date was between 2009 and 2022. The baseline information of the surveys is shown in Table 1. Also, the results of the risk of bias assessment are summarized in Table 2.
Table 1
Baseline characteristics of the studies included in this systematic review
| Study | Country | Sample type | Sample size | CBCT device and set-up details | Control imaging assessment |
|---|---|---|---|---|---|
| Kanagasingam, 2017 [15] | UK | Human jaws | 86 | 9000 3D Extraoral Imaging System, FOV of 50 mm × 37 mm, 60 kVp, 2 mA, 10.8 s | Digital radiography |
| Keerthana, 2021 [16] | India | Human jaws | 112 | Care Stream CS9300, FOV of 50 mm × 50 mm, voxel size of 0.09 mm, 84 kVp, 5 mA, 20 s | Digital radiography |
| Kirnbauer, 2022 [17] | Austria | Human jaws | 206 | Planmeca ProMax 3D Max, FOV of 10.0 × 5.9 cm or 10.0 × 9.3 cm, voxel size of 200 mm, 96 kV, 5.6-9.0 mA, 12 s | NA |
| Lennon, 2011 [18] | UK | Dry mandibles | 20 | Accuitomo 3D FPD, FOV of 4 cm × 4 cm, 90 kV, 4 mA, 17.5 s | NA |
| Liang, 2014 [19] | China | Dry mandibles | 100 | 3D Accuitomo-XYZ Slice View Tomograph Scanner, FOV of 4 cm × 4 cm, voxel size of 125 mm, 70 kVp, 3-5 mA, 17.5 s | Digital radiography |
| Patel, 2009 [20] | UK | Dry jaws | 18 | Morita Veraviewpocs, 80 kV, 3.0 mA, a 17.5 s | Digital radiography |
| Setzer, 2020 [21] | USA | Human jaws | 61 | Morita Veraviewpocs 3DF40, FOV of 4 cm × 4 cm, voxel size of 125 mm | NA |
| Sogur, 2009 [22] | Turkey | Dry mandibles | 84 | Accu-I-Tomo (3DX), 80 kV, 1.5 mA, 17.5 s | Conventional radiography and digital radiography |
Table 2
Risk of bias assessment of the included studies according to the Prediction Risk of Bias Assessment Tool (PROBAST)
| Study | ROB | Applicability | Overall | ||||||
|---|---|---|---|---|---|---|---|---|---|
| Participants | Predictors | Outcome | Analysis | Participants | Predictors | Outcome | ROB | Applicability | |
| Kanagasingam, 2017 [15] | + | + | + | + | + | + | + | + | + |
| Keerthana, 2021 [16] | + | + | + | + | + | + | + | + | + |
| Kirnbauer, 2022 [17] | + | + | + | + | + | + | + | + | + |
| Lennon, 2011 [18] | + | + | + | ? | + | + | + | ? | + |
| Liang, 2014 [19] | + | ? | + | ? | + | + | + | ? | + |
| Patel, 2009 [20] | + | + | + | ? | + | - | + | ? | - |
| Setzer, 2020 [21] | + | + | + | + | + | + | + | + | + |
| Sogur, 2009 [22] | + | ? | + | + | + | + | + | ? | + |
Sensitivity
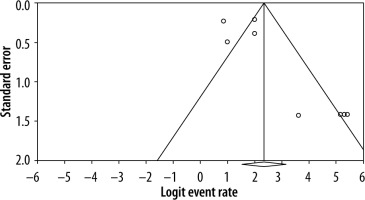
The sensitivity values reported for CBCT imaging in the 8 studies varied from 89.0% to 99.6%. According to the analysis, the overall pooled sensitivity value for CBCT was 94.6% (95% CI: 90.2-97.1; I2 = 55.9%, p = 0.026) (Table 3 and Figure 2). The funnel plot was relatively symmetrical (Figure 3). The results of the subgroup analyses based on publication date, study region, and sample size are represented in Table 3. The Galbraith plot detected no outlier studies (Supplementary Figure 1). Based upon the leave-one-out meta-analysis, we found that excluding the study by Kirnbauer et al. resulted in the lowest and insignificant heterogeneity value (Supplementary Table 1). The subgroup analysis of 6 studies showed that the overall pooled sensitivity value for digital radiography was 61.0% (95% CI: 38.3-79.8; I2 = 94.4%, p < 0.001).
Figure 3
Funnel plot to assess publication bias across studies assessing sensitivity of cone-beam computed tomography
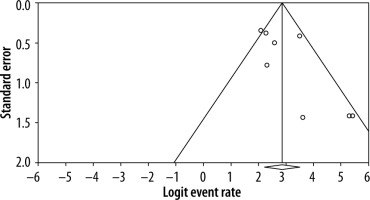
Table 3
Pooled estimates of diagnostic performance of cone-beam computed tomography for apical periodontitis according to different subgroups
Specificity
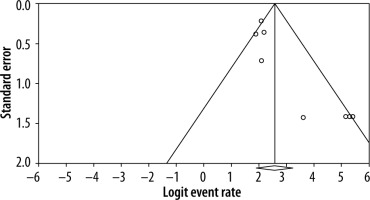
The lowest and highest specificity values reported for CBCT imaging in the studies were 70.0% and 99.6%, respectively. Analysis showed that the overall pooled specificity value for CBCT was 91.2% (95% CI: 81.7-96.0; I2 = 81.6%, p < 0.001) (Table 3 and Figure 4). The funnel plot did not indicate substantial publication bias (Figure 5). The results of the subgroup analyses based on publication date, study region, and sample size are shown in Table 3. The Galbraith plot did not detect any outlier studies (Supplementary Figure 2). According to the leave-one-out meta-analysis, excluding the study by Sogur et al., led to the lowest, but still significant, heterogeneity value (Supplementary Table 2). Based on the subgroup analysis of 6 studies, the overall pooled specificity value for digital radiography was 97.3% (95% CI: 85.6-99.5; I2 = 86.7%, p < 0.001).
Positive predictive value
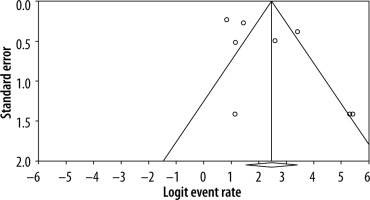
The PPV reported for CBCT imaging in the included studies ranged from 87.0% to 99.6%. Based on the analysis, the overall pooled PPV for CBCT was 93.0% (95% CI: 87.4-96.2; I2 = 56.5%, p = 0.024) (Table 3 and Figure 6). The funnel plot was not suggestive of publication bias (Figure 7). The results of the subgroup analyses based on publication date, study region, and sample size are shown in Table 3. The Galbraith plot detected no outlier studies (Supplementary Figure 3). The leave-one-out meta-analysis indicated that excluding the study by Keerthana et al. resulted in the lowest, but still significant, heterogeneity value (Supplementary Table 3). The subgroup analysis of 5 studies indicated that the overall pooled PPV for digital radiography was 98.3% (95% CI: 92.0-99.6; I2 = 74.4%, p = 0.002).
Negative predictive value
The lowest and highest NPV reported for CBCT imaging in the enrolled studies were 70.0% and 99.6%, respectively. Analysis demonstrated that the overall pooled NPV for CBCT was 92.3% (95% CI: 82.3-96.8; I2 = 86.4%, p < 0.001) (Table 3 and Figure 8). The funnel plot was relatively symmetrical (Figure 9). The results of the subgroup analyses based on publication date, study region, and sample size are shown in Table 3. The Galbraith plot detected no outlier studies (Supplementary Figure 4). Based on the leave-one-out meta-analysis, excluding the study by Kirnbauer et al. led to the lowest, but still significant, heterogeneity value (Supplementary Table 4). As per the subgroup analysis of 5 surveys, the overall pooled NPV for digital radiography was 41.6% (95% CI: 28.0-56.6; I2 = 89.5%, p < 0.001).
Discussion
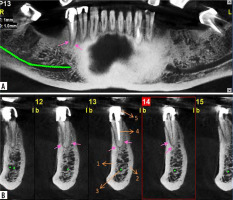
In the present study, we systematically reviewed the published literature to find the available evidence on the accuracy of CBCT imaging in detecting the apical radiolucencies among patients with AP diagnosis. After screening many references, 8 eligible studies were finally included in this meta-analysis. According to the analyses, the overall sensitivity, specificity, PPV, and NPV estimated for CBCT were 94.6%, 91.2%, 93.0%, and 92.3%, respectively. These values for digital radiography were 61.0%, 97.3%, 98.3%, and 41.6%, respectively. Based on our findings, CBCT has excellent accuracy in predicting AP. On the other hand, despite excellent specificity and PPV, digital radiography has significantly lower sensitivity and NPV compared with CBCT. These data show the high reliability of CBCT imaging in predicting and rolling out AP in suspected cases, whereas digital radiography can be associated with a considerable rate of missed detections of AP. Figure 10 illustrates panoramic-like (A) and cross-sectional (B) cone-beam computed tomography sections, indicating apical periodontitis around the apex of the right second mandibular premolar.
Figure 10
Panoramic-like (A) and cross-sectional (B) cone-beam computed tomography sections that demonstrate radiolucency around the apex of the right second mandibular premolar (pink arrows), presenting apical periodontitis. 1) Buccal cortical plate, 2) lingual cortical plate, 3) mandibular canal, 4) root, 5) crown
This study highlights the remarkable diagnostic precision of CBCT imaging for apical periodontitis prediction. This potency positions CBCT as a potent tool for precise lesion detection, enabling confident treatment decisions and improved patient outcomes. Moreover, the study underscores the vital role of CBCT in treatment planning, allowing clinicians to visualize lesion extent, aiding in tailored strategy development, and enhancing decision-making for endodontic and surgical interventions. By significantly reducing diagnostic uncertainty through a high PPV and NPV, CBCT empowers clinicians to accurately confirm or exclude apical periodontitis presence, thus mitigating misdiagnosis risks. Comparative analysis with digital radiography reaffirms the superiority of CBCT in AP prediction, manifesting in better sensitivity, specificity, PPV, and NPV. This finding advocates prioritizing CBCT over traditional radiography to heighten diagnostic accuracy in AP cases. Despite heightened radiation exposure and cost, the study endorses CBCT utilization in suspected AP cases due to its diagnostic advantages, especially in cases requiring precise lesion visualization. Consequently, clinicians can judiciously integrate CBCT into treatment planning, ensuring optimal patient care.
A few systematic reviews have been performed to assess the accuracy of CBCT in predicting the AP [23,24]; however, these reviews either included a small number of individual studies or provided limited information on the diagnostic accuracy values. The meta-analysis by Leonardi Dutra et al. [23], which analysed 4 studies, reported 95.0% and 88.0% for the sensitivity and specificity values of CBCT, respectively. Also, in the meta-analysis by Mostafapoor et al. [24], analysing 5 surveys, the values estimated for sensitivity and specificity of CBCT were 95.0% and 90.0%, respectively. Compared with these 2 studies, we found a comparable value for sensitivity but a slightly higher value for specificity. Overall, we included more individual studies than those reviews; we also estimated PPV and NPV for CBCT, while they did not. Therefore, our data is more beneficial for the readers.
The current study has some strengths. The comprehensive literature search and strict eligibility assessment of the studies could enhance the overall validity of the findings. Also, we assessed different diagnostic indices for CBCT, including sensitivity, specificity, PPV, and NPV, providing a strong foundation for understanding the diagnostic performance of CBCT in the context of apical periodontitis. Finally, emphasizing the clinical implications of the high diagnostic accuracy of CBCT for apical periodontitis adds practical value to the study and can guide future research and clinical decision-making.
Despite the excellent diagnostic accuracy of CBCT, this imaging method needs some caution; for example, field of view adjustment should be considered, to use the lowest radiation dose possible on the patients [25-27]. According to the latest statement of American Association of Endodontists/American Academy of Oral and Maxillofacial Radiology Position, CBCT imaging should be the method of choice for diagnosing patients presenting with conflicting or nonspecific clinical signs and symptoms [28]. Additionally, it is important to note that AP is the final diagnosis of a clinical condition, and CBCT can only detect imaging alteration and, consequently, help clinicians to predict AP. Therefore, the suspected cases should be referred for further evaluation after the imaging process. Finally, as with any medical technology, careful consideration of radiation exposure and associated risks is crucial. Further investigations could explore optimized imaging protocols and dose-reduction strategies to ensure patient safety while maximizing diagnostic benefits.
A limitation of our current systematic review and metaanalysis was the high statistical heterogeneity observed among the included studies for most estimates. To explore the sources of this heterogeneity, we conducted subgroup analyses by publication date, study region, and sample size; we found that the given factors could explain the heterogeneity between studies. It is also worth noting that publication bias does not account for the observed heterogeneity. Additionally, Galbraith plots identified no outlier studies as potential sources of heterogeneity regarding the diagnostic indices. Finally, some studies could partly justify the heterogeneity according to leave-one-out meta-analyses. Overall, high heterogeneity is expected when conducting a meta-analysis of frequency measures [29,30]. However, it is recommended that more homogeneous surveys are conducted to improve the validity of the results.
Conclusions
The results of this systematic review and meta-analysis indicate that CBCT imaging has excellent diagnostic accuracy in detecting the apical radiolucencies for AP. We also found that CBCT has better discriminant test performance for AP than digital radiography. Future research endeavours might investigate comparative effectiveness studies, examining the clinical outcomes and cost-effectiveness of CBCT-guided treatment strategies compared to conventional approaches. Longitudinal studies could provide insights into the impact of CBCT on treatment success rates, patient satisfaction, and long-term prognosis.


