Introduction
Mediastinal staging is critical for therapeutic decision-making in patients with lung cancer. Although positron emission tomography-computed tomography (PET-CT) is considered a standard imaging modality for these patients, its sensitivity and negative predictive value (NPV) may be suboptimal [1]. These limitations are particularly evident in low-grade tumours and cases with low nodal standardised uptake values (SUV) [2-12]. The value of the node-tumour ratio (NTR) has been assessed in several studies, suggesting its potential utility [13-20]. If a high NPV of NTR is confirmed, it could influence current guidelines and eliminate the need for unnecessary invasive mediastinal staging in a significant subset of patients. However, the limited number of patients analysed in the published reports, variation in confirmatory tests used, and inconsistent results do not support firm conclusions. This study aimed to evaluate whether NTR better predicts N2 involvement than mediastinal lymph node SUV in patients with lung cancer. Additionally, analysis of data from a large cohort of patients, in whom confirmation of PET results included routinely performed endobronchial ultrasound (EBUS), endoscopic ultrasound (EUS), and intraoperative systematic lymph node dissection, enabled us to examine the relationship between PET diagnostic yield and clinical characteristics such as age, sex, body mass index (BMI), tumour grade, histological type, and lobar location of the primary tumour.
Material and methods
This study was conducted in accordance with the Declaration of Helsinki (revised in 2013). Due to the retrospective nature of the analysis, the Ethics Committee waived the need for individual consent. This study adhered to the STRAD guidelines.
Clinical questions
Does the diagnostic yield of PET in detecting mediastinal node involvement in patients with non-small cell lung cancer (NSCLC) depend on the lymph node SUV?
Does the yield of PET in the diagnosis of mediastinal lymph node involvement in patients with NSCLC depend on the NTR?
Does the diagnostic yield of PET depend on clinical characteristics, including age, sex, BMI, grade, histological type, and lobar location of the primary tumour?
Patients
Data were included for all patients who underwent surgery for primary lung cancer between 2010 and 2015. The inclusion criteria were as follows: age 18-90 years; clinical stage I-IVA (only oligometastatic cancers were included for stage IV); and curative-intent anatomical lung resection.
Intervention
All patients underwent a preoperative diagnostic work-up, including PET-CT, bronchoscopy, EBUS, and EUS. PET imaging was performed using a Discovery 690 scanner (General Electric HealthCare, Chicago, Illinois, USA). The protocol included CT attenuation correction imaging and lung window reconstruction (80-210 mA, 3.75 mm section thickness, and 0.8-second gantry rotation speed). Whole-body PET with a 2.5 mm section thickness was performed using non-attenuation-corrected (NAC), measured attenuation-corrected (MAC) images, and the Q.Clear algorithm. Reconstructions used included Q. Clear, SharpIR, Q. AC, and VUE Point HD. The maximum SUV was calculated using PET Odyssey software. Each study was independently assessed by a radiologist and nuclear medicine specialist.
Combined EBUS and EUS, referred to as combined ultrasound (CUS), were performed by endoscopists with extensive experience in both tracheobronchial and esophagogastric endoscopy. Samples from each lymph node station were prepared separately, and the cytological smears were fixed in 96% ethanol. The CUS technique has been previously described in detail [21]. In all patients, lung resection was performed by certified thoracic surgeons, with standard lymph node dissection according to the European Society of Thoracic Surgeons guidelines, including the following nodal stations: right side (2R, 4R, 3A, 7, 8, and 9) and left side (5, 6, 7, 8, and 9) [22].
Lymph nodes from each station were dissected separately, fixed in 10% buffered formalin, and labelled. Cytological and histological specimens were examined by an experienced pathologist specialising in lung pathology. Standard light microscopy images with haematoxylin and eosin staining were used.
Endpoints
The primary endpoints were as follows: (1) risk of false-negative results, sensitivity, and NPV based on the mediastinal lymph node SUV, and (2) risk of false-negative results, sensitivity, and NPV of NTR.
The secondary endpoint was the correlation between PET results and clinical characteristics, including age, sex, BMI, grade, histological type, and lobar location of the primary tumour.
Statistical analysis
All calculations were performed using Dell Statistica data analysis software system version 13 (Dell Computer Corporation, Round Rock, USA). Sensitivity, specificity, positive and negative predictive values, and accuracy are expressed as percentages. Confidence intervals for sensitivity, specificity, and accuracy were calculated using the exact Clopper-Pearson method, while those for predictive values used the standard logit method, according to Mercaldo. Logistic regression was used to model binary response data. Model selection utilised the Akaike information criterion (AIC), an estimator of the relative quality of statistical models for a given set of data. Statistical significance was set at p < 0.05.
Results
Overall, data from 774 patients were included in the analysis. The clinical characteristics of the study groups are shown in Table 1.
Table 1
Characteristics of the study group
[i] BMI – body mass index, RUL – right upper lobe, RML – right middle lobe, RLL – right lower lobe, RC – aright central, LUL – left upper lobe, LLL – left lower lobe, LC – left central, PET – positron-emission tomography, SCC – squamous-cell carcinoma, ADC – adenocarcinoma, LCC – large-cell carcinoma
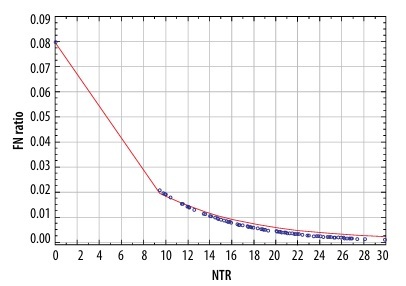
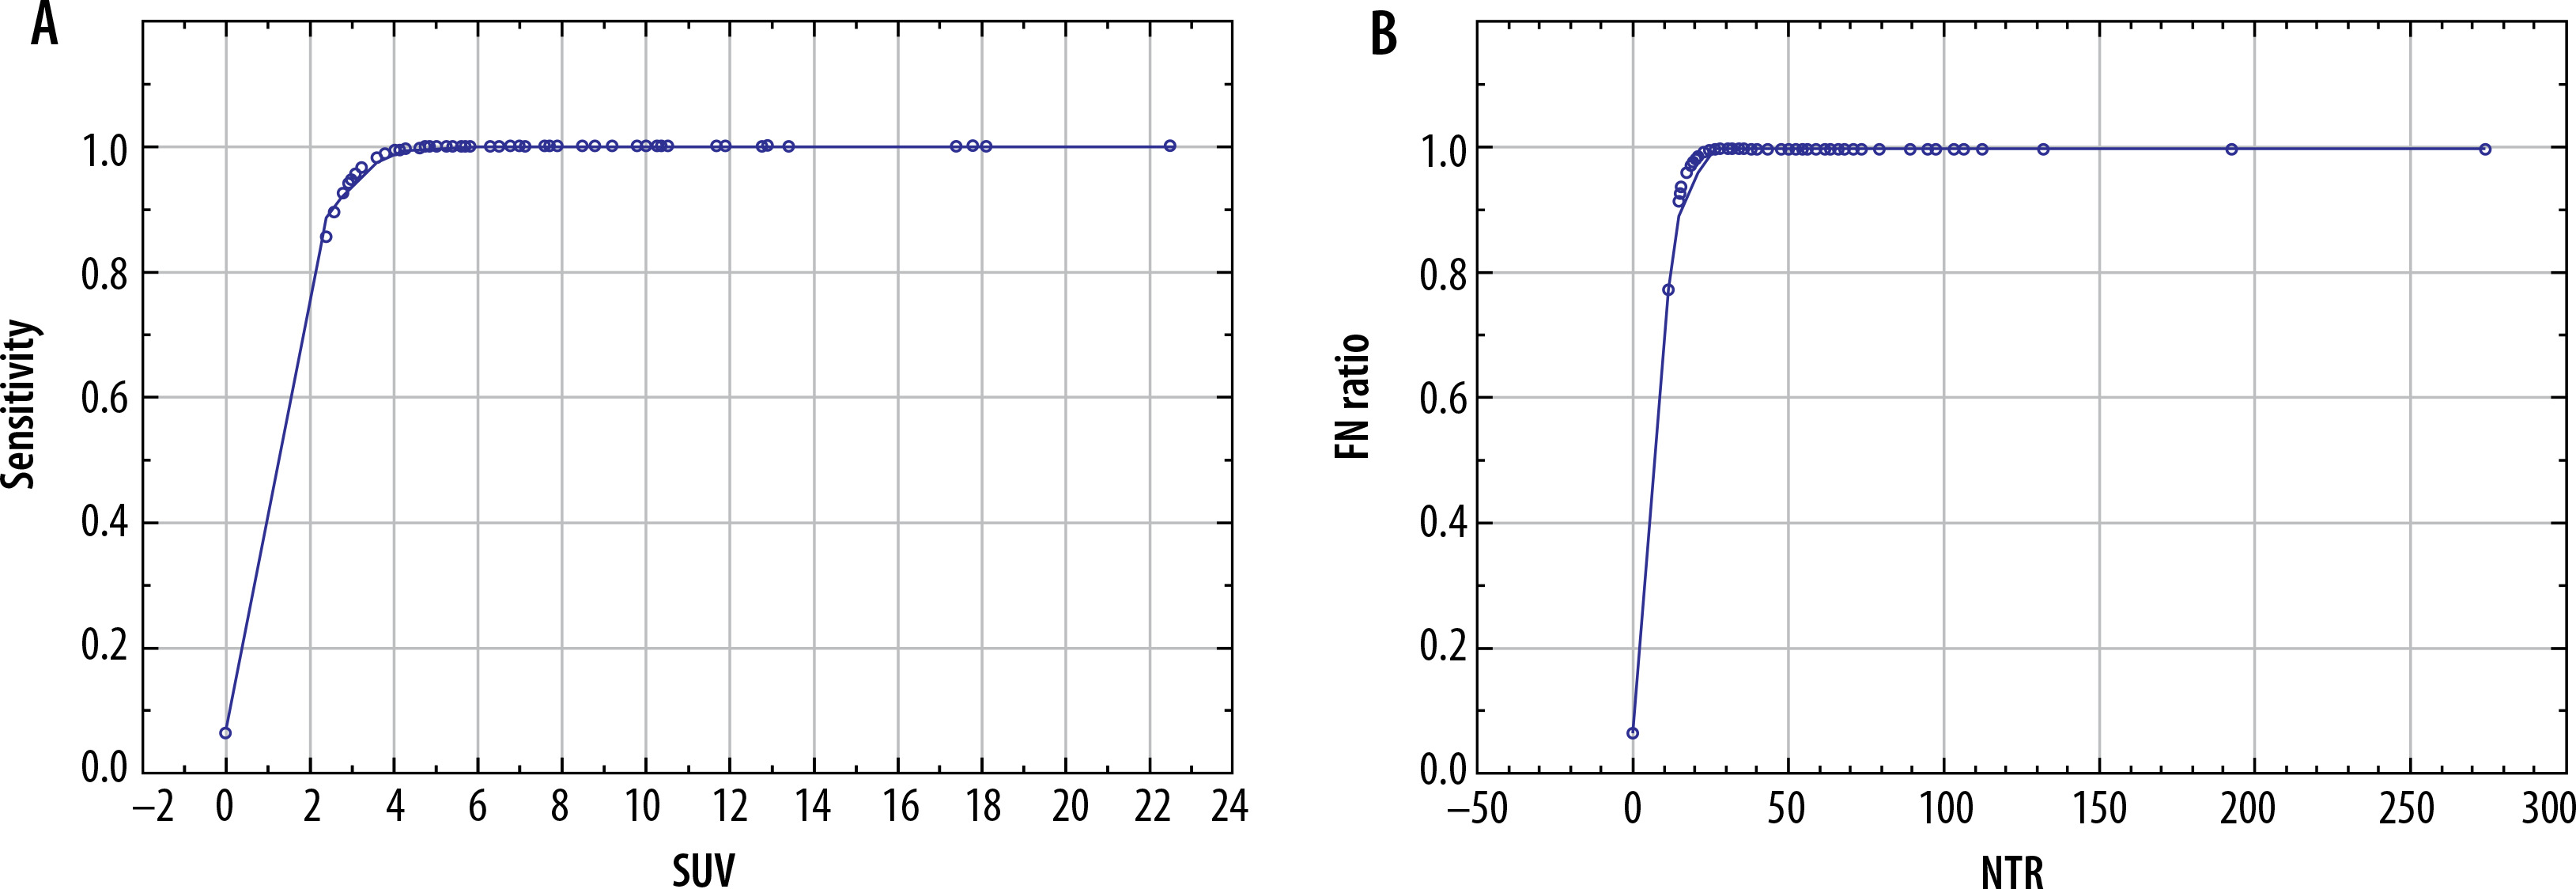
The parameters depicting the diagnostic yield of PET for the detection of N2 disease are presented in Table 2. There was a significant correlation between the risk of false-negative PET results in detecting N2 disease and both the SUV of the mediastinal nodes (p = 0.012) and NTR (p = 0.030) (Figure 1). A comparison of these 2 models using the AIC revealed that NTR performed better than N2 SUV, with AIC values of 307.268 vs. 308.498, respectively. There was a statistically significant correlation between the sensitivity of PET and both the SUV of the mediastinal lymph nodes (p < 0.001) and NTR (p < 0.001) (Figure 2). A comparison of these 2 models using the AIC showed that the sensitivity of NTR was superior to that of N2 SUV, with AIC values of 30.297 vs. 32.171, respectively.
Table 2
Diagnostic yield of mediastinal nodes SUV in detecting N2 metastasis
| Statistic | Value (%) | 95% CI |
|---|---|---|
| Sensitivity | 61.26 | 51.55-70.36 |
| Specificity | 73.91 | 70.39-77.21 |
| PPV | 28.22 | 24.43-32.34 |
| NPV | 91.93 | 89.98-93.53 |
| Accuracy | 72.09 | 68.79-75.23 |
| N2 disease prevalence | 14.34% | 11.95-17.01 |
Figure 1
Relationship between node-tumour ratio (NTR) and false-negative (FN) results of positron-emission tomography
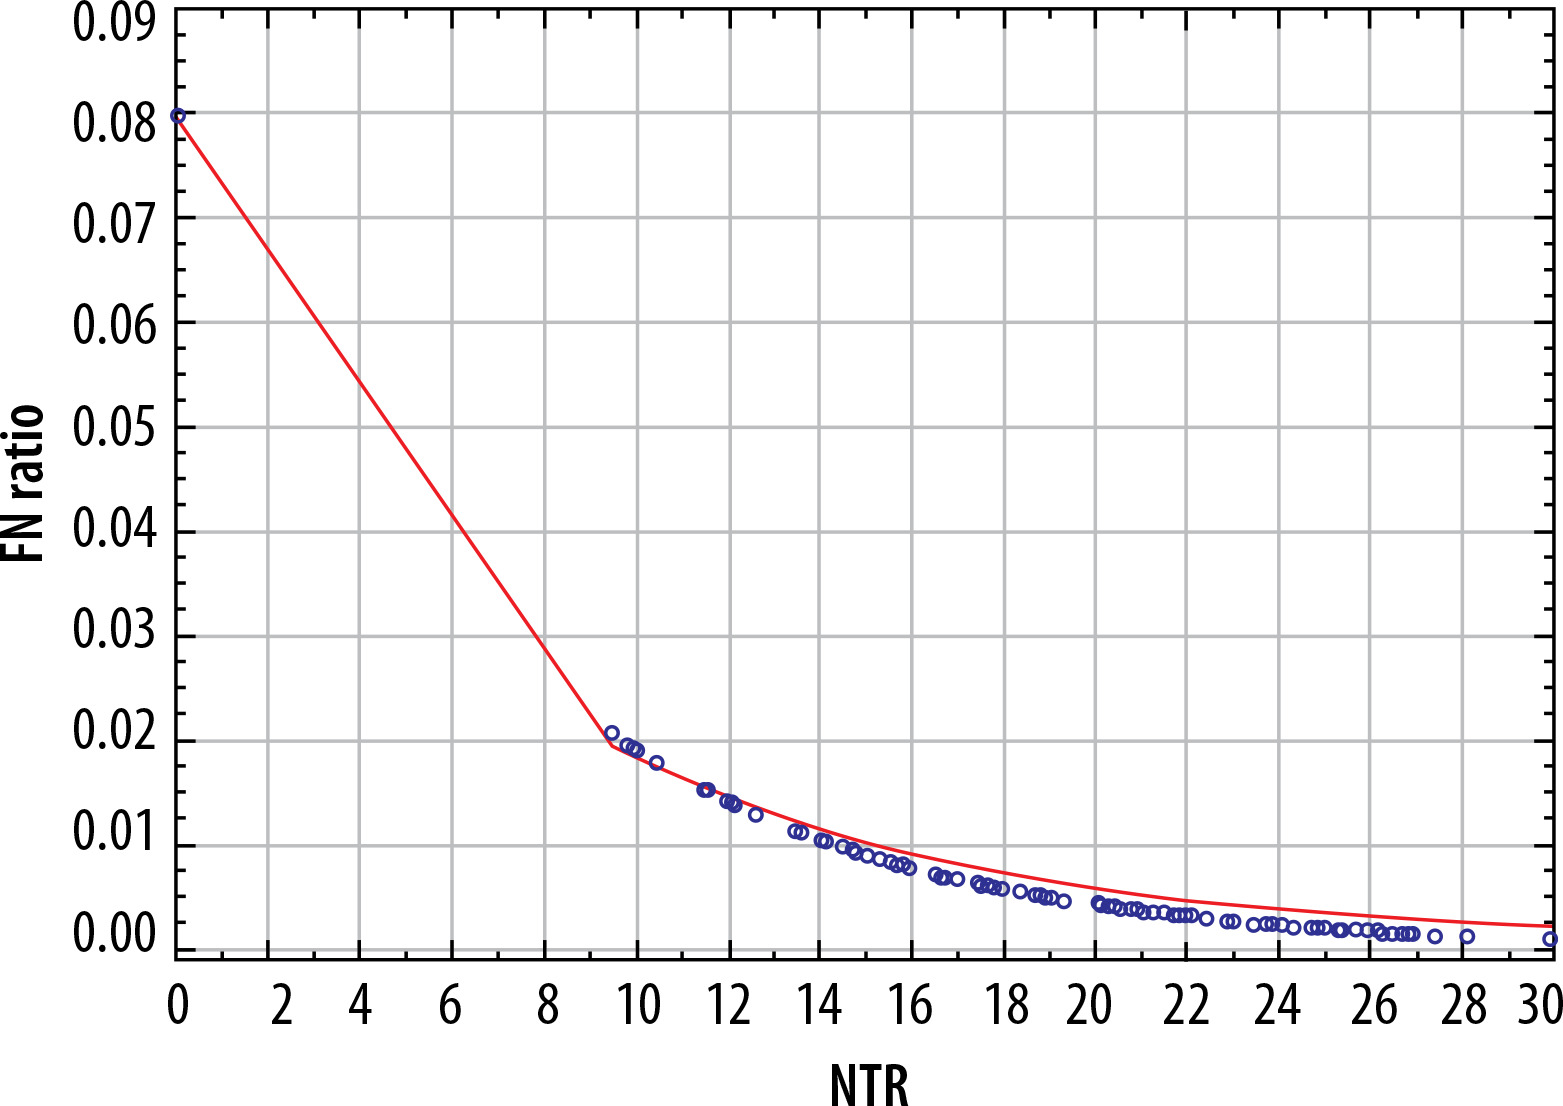
Figure 2
Relationship between sensitivity of positron-emission tomography and: A) standardised uptake value (SUV) value of mediastinal lymph nodes, and B) node-tumour ratio (NTR)
There was no significant correlation between the sensitivity of PET based on nodal SUV and the following clinical variables: age (p = 0.384), sex (p = 0.891), BMI (p = 0.370), tumour grade (p = 0.158), lobar location (p = 0.545), and histological type (p = 0.985).
Similarly, there was no significant correlation between specificity based on nodal SUV and the following clinical variables: age (p = 0.856), sex (p = 0.146), BMI (p = 0.128), tumour grade (p = 0.303), lobar location (p = 0.464), and histological type (p = 0.924).
A statistically significant correlation was observed between the PPV of PET and both the SUV of the mediastinal lymph nodes (p < 0.001) and NTR (p < 0.005). A comparison of these 2 models using the AIC showed that the PPV of N2 SUV was better than that of NTR, with AIC values of 269.355 vs. 282.040, respectively. Three factors were significantly correlated with the PPV: patient age (p = 0.021), female sex (p = 0.012), and histological type of adenocarcinoma (p = 0.036). There was no significant correlation between the PPV and BMI (p = 0.808), tumour grade (p = 0.116-0.590), and lobar location (p = 0.331).
No significant correlation was found between the SUV of the mediastinal lymph nodes (p < 0.598) and NTR (p = 0.505). There was no significant correlation between the NPV based on the nodal SUV and age (p = 0.758), sex (p = 0.375), BMI (p = 0.396), tumour grade (p = 0.929), lobar location (p = 0.468), or histological type (p = 0.563).
Discussion
Key findings
The primary finding of our study is the superior performance of NTR over nodal SUV in excluding N2 disease in patients with lung cancer. Additionally, we found that NTR was more sensitive than nodal SUV in detecting mediastinal lymph node involvement. However, in terms of the PPV of PET, N2 SUV performed better than NTR. No correlation was found between the NPV and SUV of the mediastinal lymph nodes and NTR.
The second key finding was the absence of a significant correlation between the sensitivity, specificity, and NPV of PET based on the nodal SUV and the following basic clinical variables: age, sex, BMI, tumour grade, lobar location, and histological type. However, 3 factors were significantly correlated with the PPV: patient age, female sex, and adenocarcinoma histology.
Strengths and limitations
To our knowledge, this study encompasses the largest cohort of patients reported to date, with a total of 774 patients analysed, compared to the largest cohort reported in existing literature, which included only 239 patients. Furthermore, our study is novel in evaluating the relationships between the diagnostic yield of PET in detecting N2 disease and age, sex, BMI, tumour grade, lobar location, and histological type. We included patients with NSCLC regardless of the SUV of mediastinal nodes, making our cohort more representative of the patient population typically encountered in clinical practice. Additionally, a standardised diagnostic protocol, including PET-CT, CUS, and pathological assessment of surgical specimens, was employed for all patients, enhancing the homogeneity of the data.
The main limitation of this study is its retrospective design, although selection bias was limited by including a consecutive group of patients. Future prospective trials are needed to further explore the value of SUV ratios in detecting N2 disease in lung cancer patients.
Comparison with similar research
The largest study on NTR to date includes 239 patients diagnosed at 14 centres. Only patients with a maximum SUV (SUVmax) of both the primary tumour and mediastinal lymph nodes of ≥ 2.5 were included [17]. For pathological confirmation, mediastinoscopy or EUS was utilised, depending on lymph node location. The authors employed receiver operating characteristic (ROC) curve analysis and found a higher NTR for malignant than for non-malignant nodes (p = 0.020). However, unlike our study, no data on NPV were reported, and the correlation between PET performance and clinical variables was not analysed.
Cho et al. [13] analysed PET data of 98 lung cancer patients categorising nodal stations into 3 groups based on the primary tumour SUV: low, medium, and high. ROC curve analysis showed that NTR performed significantly better than nodal SUV in the low-SUV group (p = 0.019), confirming our findings. There was no significant correlation in the medium- and high-SUV groups. Additionally, no significant difference in NTR was found between SCC and adenocarcinoma, which is consistent with our results. However, unlike our study, the techniques for pathological confirmation varied: surgical lymphadenectomy in 34 patients, EBUS-TBNA in 51 patients, and EBUS-TBNA followed by lymphadenectomy in 13 (13.2%) patients. In contrast, all patients in our study underwent EBUS, EUS, and surgical lymphadenectomy, minimising the risk of missing false-negative PET results.
Another study involving 83 patients with primary tumour SUVmax > 2.5 and nodal SUVmax 2.0-6.0 found NTR to be significantly more accurate than nodal SUV in predicting nodal malignancy [14]. The results support our findings but lacked standardised pathological confirmation, using various techniques such as transbronchial needle aspiration, EBUS, mediastinoscopy, and thoracotomy, without specifying patient numbers for each technique.
A report of 121 lung cancer patients staged with PET, followed by EBUS and surgical resection, showed that NTR was more accurate than nodal SUV (p < 0.001) and had predictive power for N2 disease with a 0.4 cutoff [16]. These results correspond with our findings.
Cirak et al. [18] analysed 99 patients with an SUV of mediastinal lymph nodes of ≥ 2.5, with PET results verified by mediastinoscopy or thoracoscopy, followed by systematic lymph node dissection at thoracotomy. They found a trend towards higher SUV and NTR for metastatic nodes, although the differences were not significant.
Nguyen et al. [15] analysed the PET data of patients with lung cancer who underwent PET-CT followed by EBUS. The initial 104 patients were included in the prediction set, and 48 patients were included in the validation set. The authors compared expert visual interpretation to nodal SUVmax and NTR, as well as the following nodal SUVmax ratios: to liver SUVmax, to liver average SUV, and to left atrial blood pool. Using all 5 of the aforementioned objective criteria, 84.8% of the lymph nodes were correctly classified, while expert visual interpretation was accurate in 93.9% of the nodes. The authors concluded that PET-based objective criteria could differentiate between malignant and benign nodes, but their performance was not superior to that of visual interpretation by expert diagnosticians.
Lee et al. [19] compared the ratio of the SUV of the lymph node to the blood pool with that of the NTR. They analysed the SUV data of 104 patients. In contrast to the study by Nguen et al. and our results, they found significant differences between malignant and benign lymph nodes in nodal SUVmax, the ratio of the SUV of the lymph node to blood pool SUV, and the size of lymph nodes (p < 0.0001), but not in the NTR (p = 0.18).
Most of the literature confirms the utility of the NTR [13,14,16-18] which corresponds to our results. However, unlike our study, none of these studies consistently utilised a protocol for pathological confirmation, including EBUS, EUS, and assessment of surgical specimens. Detailed confirmation of PET results is important because it minimises the risk of missing discrete N2 disease. Additionally, these studies did not include an analysis of the correlation between PET performance and basic clinical variables.