Introduction
Gliomas are a diverse group of primary brain tumours distinguished by their different clinical behaviour, histological characteristics, and genetic profiles. Therefore, it is crucial to make precise evaluations and descriptions of these tumours for precise diagnoses to optimise treatment approaches and enhance patient results [1]. Obtaining histopathological specimens for accurate diagnosis might be challenging in clinical situations in which surgery is not possible. To overcome these challenges, it is essential to utilise non-invasive diagnostic technologies to improve the effectiveness and precision of diagnosis.
Although traditional imaging modalities are beneficial, they often lack the information required for a full examination of tumours. This gap has generated curiosity in more sophisticated imaging methods, including diffusion-weighted imaging (DWI) and its derivative – the apparent diffusion coefficient (ADC).
DWI utilises the motion of water molecules in tissue to generate contrast in magnetic resonance images (MRI). The ADC values obtained by DWI yield quantitative assessments of water diffusion, which are inversely correlated with cellular density and the integrity of cellular structures. When studying gliomas, it has been observed that ADC levels are related to the density of tumour cells, their growth rate, and the presence of dead tissue. This method offers a more indirect way of determining the histological and genetic characteristics of the tumour, eliminating the necessity for invasive procedures [2].
Recent research has shown that ADC measures can be used to differentiate between low-grade and high-grade gliomas and to predict certain genetic alterations, such as isocitrate dehydrogenase (IDH) status [3,4]. These insights are vital because genetic alterations in glioma have a considerable impact on prognosis and therapy response. For example, gliomas with IDH mutations typically correspond to more favourable outcomes and have different metabolic pathways compared to gliomas without IDH alterations [5]. Furthermore, evaluating the status of the IDH1 gene is the initial stage in determining the accurate genetic profile of glioma, serving as an indicator for subsequent genetic analyses [6].
The present study aims to explore the relevance of diffusion imaging, specifically ADC values, in predicting glioma genetics and tumour features. Through the synthesis of current research and clinical data, we seek to clarify how modern imaging techniques might improve our understanding of glioma biology and aid in the development of individualised treatment strategies.
Material and methods
Patient cohort
The research study contains a cohort of 91 individuals who received neurosurgical treatment between August 2023 and March 2024. The inclusion criteria encompassed individuals aged 18 years and above who received preoperative MRI with DWI assessment and had accessible histopathological and genetic test findings. Patients who had incomplete datasets were not included in the study. The study obtained approval from the institutional Bioethics Committee.
Clinical data collection
The clinical data obtained encompassed demographic information, such as age and sex, along with tumour features, including location, laterality, and multiplicity. The recorded additional information included clinical symptoms, history of recurrence, Karnofsky performance status (KPS), handedness, smoking status, particular tumour diagnosis, tumour grade, and body mass index (BMI).
MRI protocol
MRI examinations were conducted using a 1.5 T MRI scanner, using a standardised protocol (Supplementary Table 1) to maintain consistency and reproducibility of imaging data. The sequences comprised pre- and post-gadolinium T1- and T2-weighted images, fluid-attenuated inversion recovery (FLAIR), DWI, and dynamic susceptibility contrast (DSC) imaging. Post-contrast images were acquired after administering a bolus injection of a gadolinium-based contrast agent at a dose of 0.1 mmol/kg body weight, followed by a saline flush.
Radiological variables
The images were examined on the analysis software Philips Intellispace Portal. The radiological characteristics assessed included components from the Vasari classification [7]. The features encompassed multifocal lesions, contrast enhancement characteristics, T2/FLAIR mismatch, intratumoural necrosis, maximal diameter, tumour volume, involvement of the corpus callosum, involvement of the cortex, extension into the ependymal layer, and invasion of the pia mater. In addition, ADC was measured in DWI, while relative cerebral blood volume (rCBV) and relative cerebral blood flow (rCBF) were analysed using DSC imaging the average. The regions of interest (ROIs) were positioned according to the method previously outlined by Xing et al. [4]. To accurately position the ROIs on the solid tumour components and avoid areas with cysts, bleeding, necrosis, or swelling around the tumour, the DWI pictures were aligned with conventional MRI scans, including T1-weighted scans before and after the injection of gadolinium and T2-weighted scans. Therefore, the average ADC values were determined by manually positioning between 3 and 5 non-overlapping ROIs positioned within the tumour regions of the visually lowest ADC values.
Histopathological and genetic analysis
The histopathological diagnosis was determined by the most recent WHO CNS5 classification [8]. The genetic indicators that were evaluated were IDH1 mutation status, O6-methylguanine-DNA methyltransferase (MGMT) methylation, epidermal growth factor receptor (EGFR) amplification, cyclin-dependent kinase inhibitor 2A (CDKN2A) deletion, TP53 deletion, platelet-derived growth factor receptor alpha gene (PDGFRA) amplification, phosphatase and tensin homologue (PTEN) deletion, 1p/19q codeletion, telomerase reverse transcriptase (TERT) pathogenic variants, and H3F3A (K27M) pathogenic variants. The markers were chosen based on their well-established significance in brain tumour pathophysiology and prognosis. Standard molecular techniques, such as polymerase chain reaction (PCR), fluorescence in situ hybridisation (FISH), and next-generation sequencing (NGS), were employed for genetic analysis.
Statistical analysis
The normality of the data was evaluated using the Shapiro-Wilk test. The selection of statistical tests, either the Mann-Whitney U test or the χ2 test, depended on whether the data were continuous or categorical. These tests were used to identify any significant differences between the 2 groups of independent variables. Instances with incomplete genetic data were omitted from the statistical analysis to ensure uniformity. The results were presented using 95% confidence intervals (95% CI), and statistical significance was determined by a p-value of less than 0.05. The statistical studies were performed using R Studio software.
Results
Demographic and clinical characteristics
Table 1 provides a comprehensive summary of the demographic and clinical characteristics of the 91 patients included in this study.
Table 1
Patients’ characteristics
The cohort comprised a slightly higher proportion of males (52.7%) than females (47.3%), with a mean age of 52 years (SD = 15 years). The malignancies were predominantly found in the temporal (35.2%) and frontal lobes (34.1%). The tumours were evenly distributed across the left and right hemispheres, with each hemisphere accounting for 46.2% of the cases. A minor fraction of tumours (7.7%) affected both hemispheres simultaneously.
The prevalent clinical symptoms were headache (27.5%), epilepsy (26.4%), and paresis (24.2%). Additional symptoms that were documented included speech difficulties (19.8%), vision disturbances (15.4%), memory disorders (11%), ataxia (9.9%), dizziness (4.4%), and paraesthesia (5.5%). A significant proportion of patients, specifically 9.9%, exhibited no symptoms.
The patients’ KPS had a mean value of 81 (SD = 12), suggesting that most patients had a relatively high level of functional ability during the examination.
Table 2 provides a comprehensive overview of the diagnosis and molecular characteristics of the study participants.
Table 2
Diagnosis and molecular characteristics
[i] IDH1 – isocitrate dehydrogenase 1, MGMT – O6-methylguanine-DNA methyltransferase; EGFR – epidermal growth factor receptor, CDKN2A – loss of cyclin-dependent kinase inhibitor 2A, PDGFRA – platelet-derived growth factor receptor alpha gene, PTEN – phosphatase and tensin homologue, TERT – telomerase reverse transcriptase
Among the 91 patients included in the study, 29.7% were diagnosed with astrocytoma, and 70.3% with glioblastoma. The tumours were graded according to the WHO classification, with 9 patients (9.9%) having grade 2 tumours, 17 patients (18.7%) having grade 3 tumours, and 65 patients (71.4%) having grade 4 tumours.
The analysis of IDH1 mutation status revealed that 71.4% of patients had IDH1-wildtype tumour, while 28.6% of patients had IDH1 mutations. Regarding MGMT promoter methylation, 37.9% of patients were found to have MGMT promoter unmethylated, whereas 62.1% of patients had MGMT promoter methylated. EGFR amplification was present in 54% of patients. CDKN2A deletion status indicated that 45.1% of patients had non-deleted CDKN2A, 30.8% of patients had heterozygous deletions, and 18.7% of patients had homozygous deletions. TP53 deletion was found in 3.3% of patients. PDGFRA amplification was observed in 15.4% of patients. PTEN deletion was detected in 38.5% of patients. Only one patient had 1p/19q codeletion, while the vast majority (98.9%) did not have this genetic feature. TERT pathogenic variants were identified in 48.4% of patients. Representative patients’ examinations are presented in Figures 1–3.
Figure 1
Representative magnetic resonance images of examined patient. A 68-year-old man with glioblastoma G4. Molecular characteristics: IDH1-wildtype, present TERT promoter pathogenic variant, CDKN2A homozygous deletion, EGFR amplification, MGMT promoter unmethylated. A) Pre-contrast T1. B) Contrast enhanced tumour on T1 post gadolinium. C) T2-weighted scan. D) Fluid-attenuated inversion recovery (FLAIR). E) Diffusion-weighted imaging (DWI). F) Reduced diffusion on apparent diffusion coefficient (ADC) map
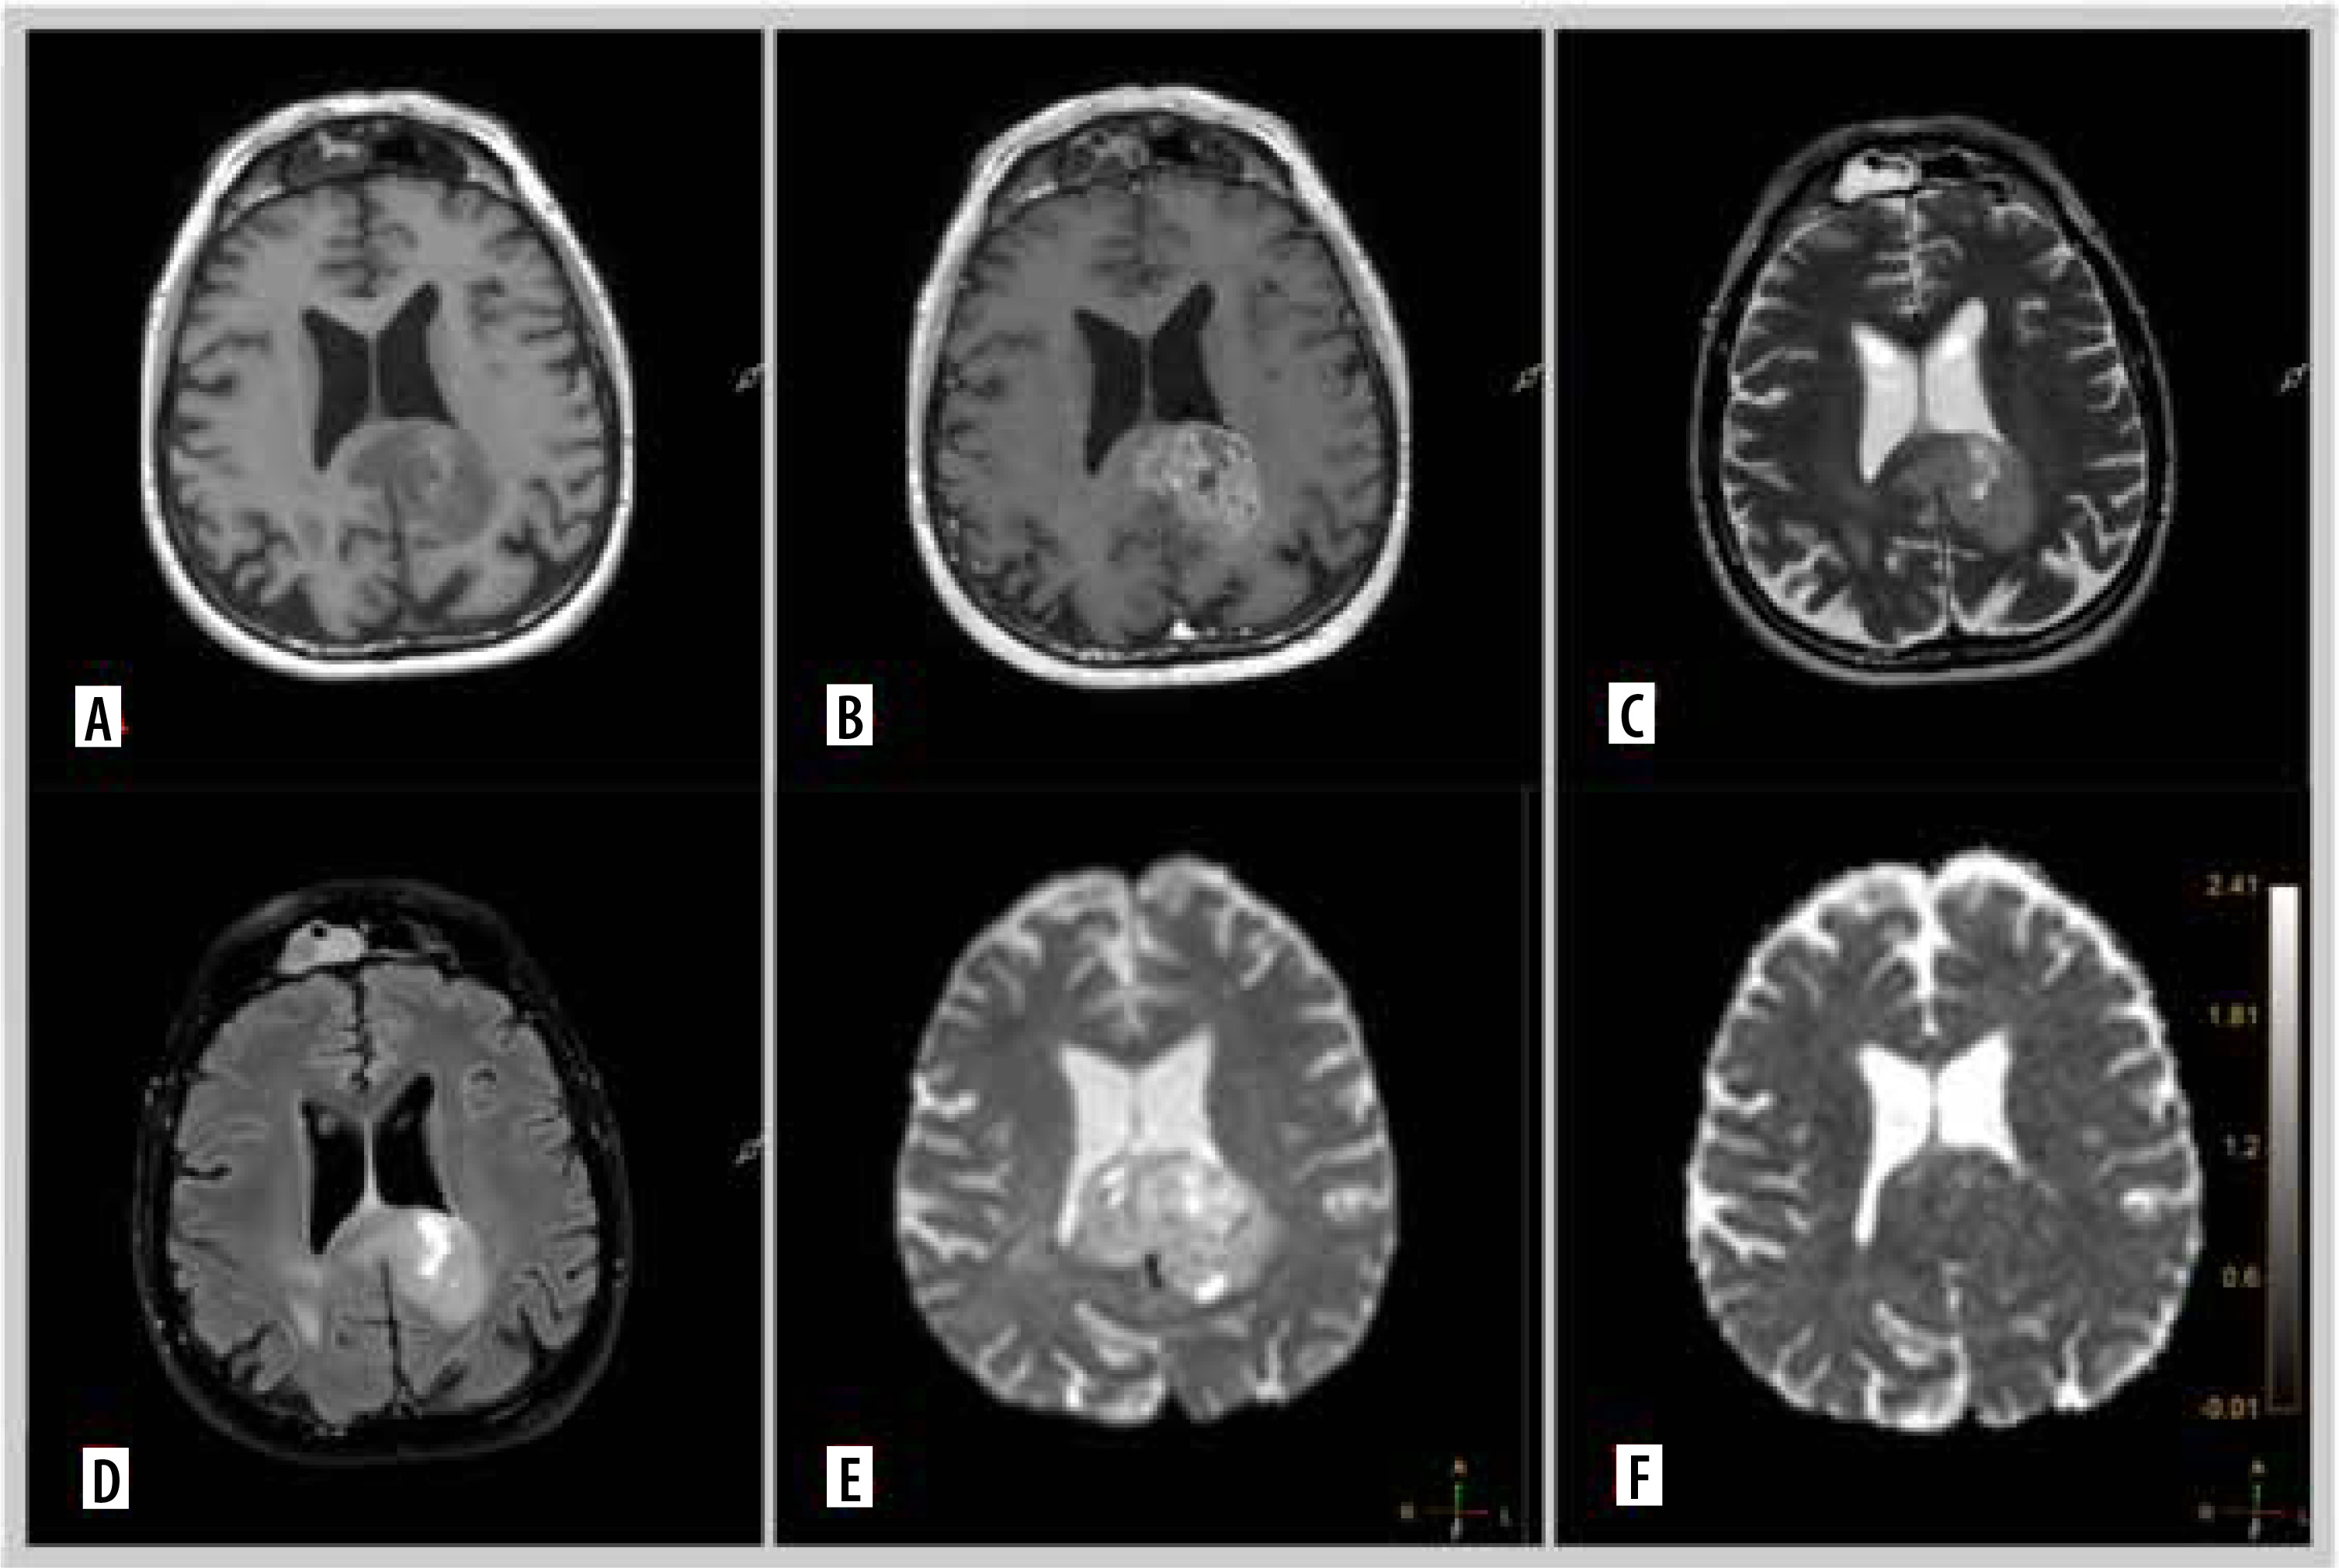
Figure 2
Representative magnetic resonance images of examined patient. A 67-year-old man with glioblastoma G4. Molecular characteristics: IDH1-wildtype, present TERT promoter pathogenic variant, CDKN2A homozygous deletion, EGFR amplification, MGMT promoter unmethylated. A) Pre-contrast T1. B) Contrast enhanced tumour on T1 post gadolinium. C) T2-weighted scan. D) Fluid-attenuated inversion recovery (FLAIR). E) Diffusion-weighted imaging (DWI). F) Apparent diffusion coefficient (ADC) map
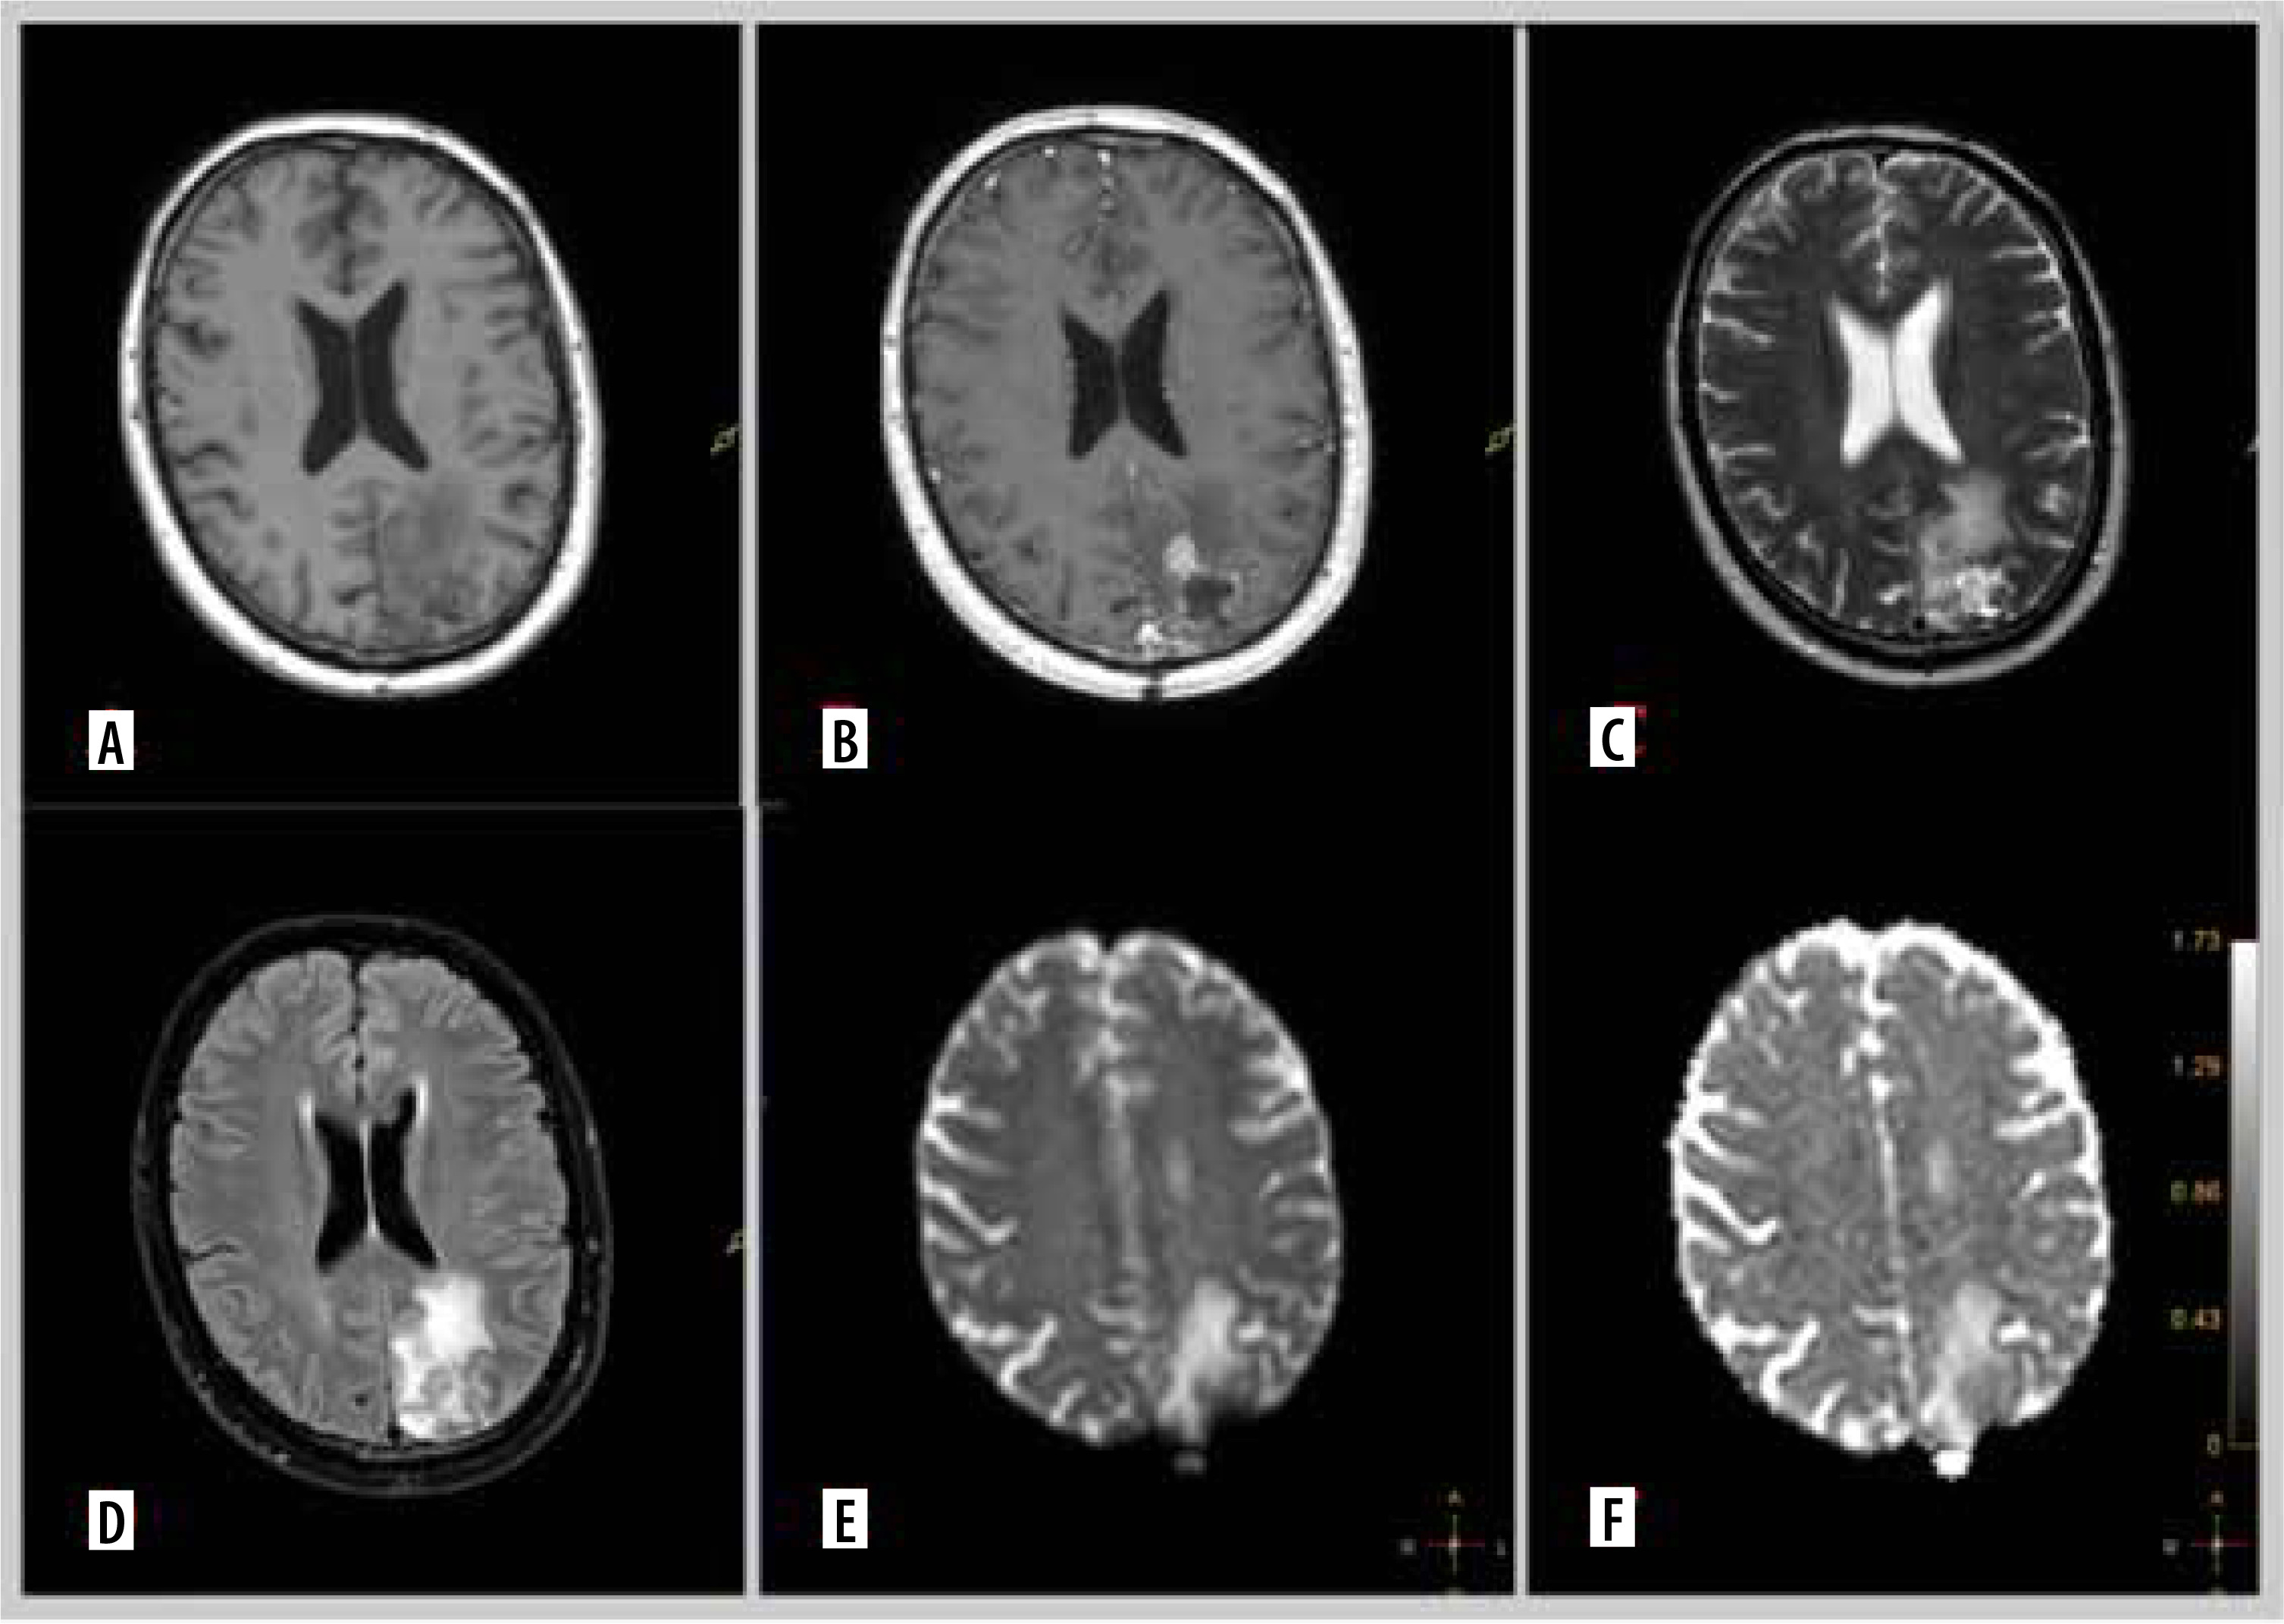
Figure 3
Representative magnetic resonance images of examined patient. A 52-year-old man with glioblastoma G4. Molecular characteristics: IDH1-wildtype, present TERT promoter pathogenic variant, CDKN2A non-deleted, EGFR non-amplification, MGMT promoter unmethylated. A) Pre-contrast T1. B) Contrast enhanced tumour on T1 post gadolinium. C) T2-weighted scan. D) Fluid-attenuated inversion recovery (FLAIR). E) Diffusion-weighted imaging (DWI).. F) ADC map
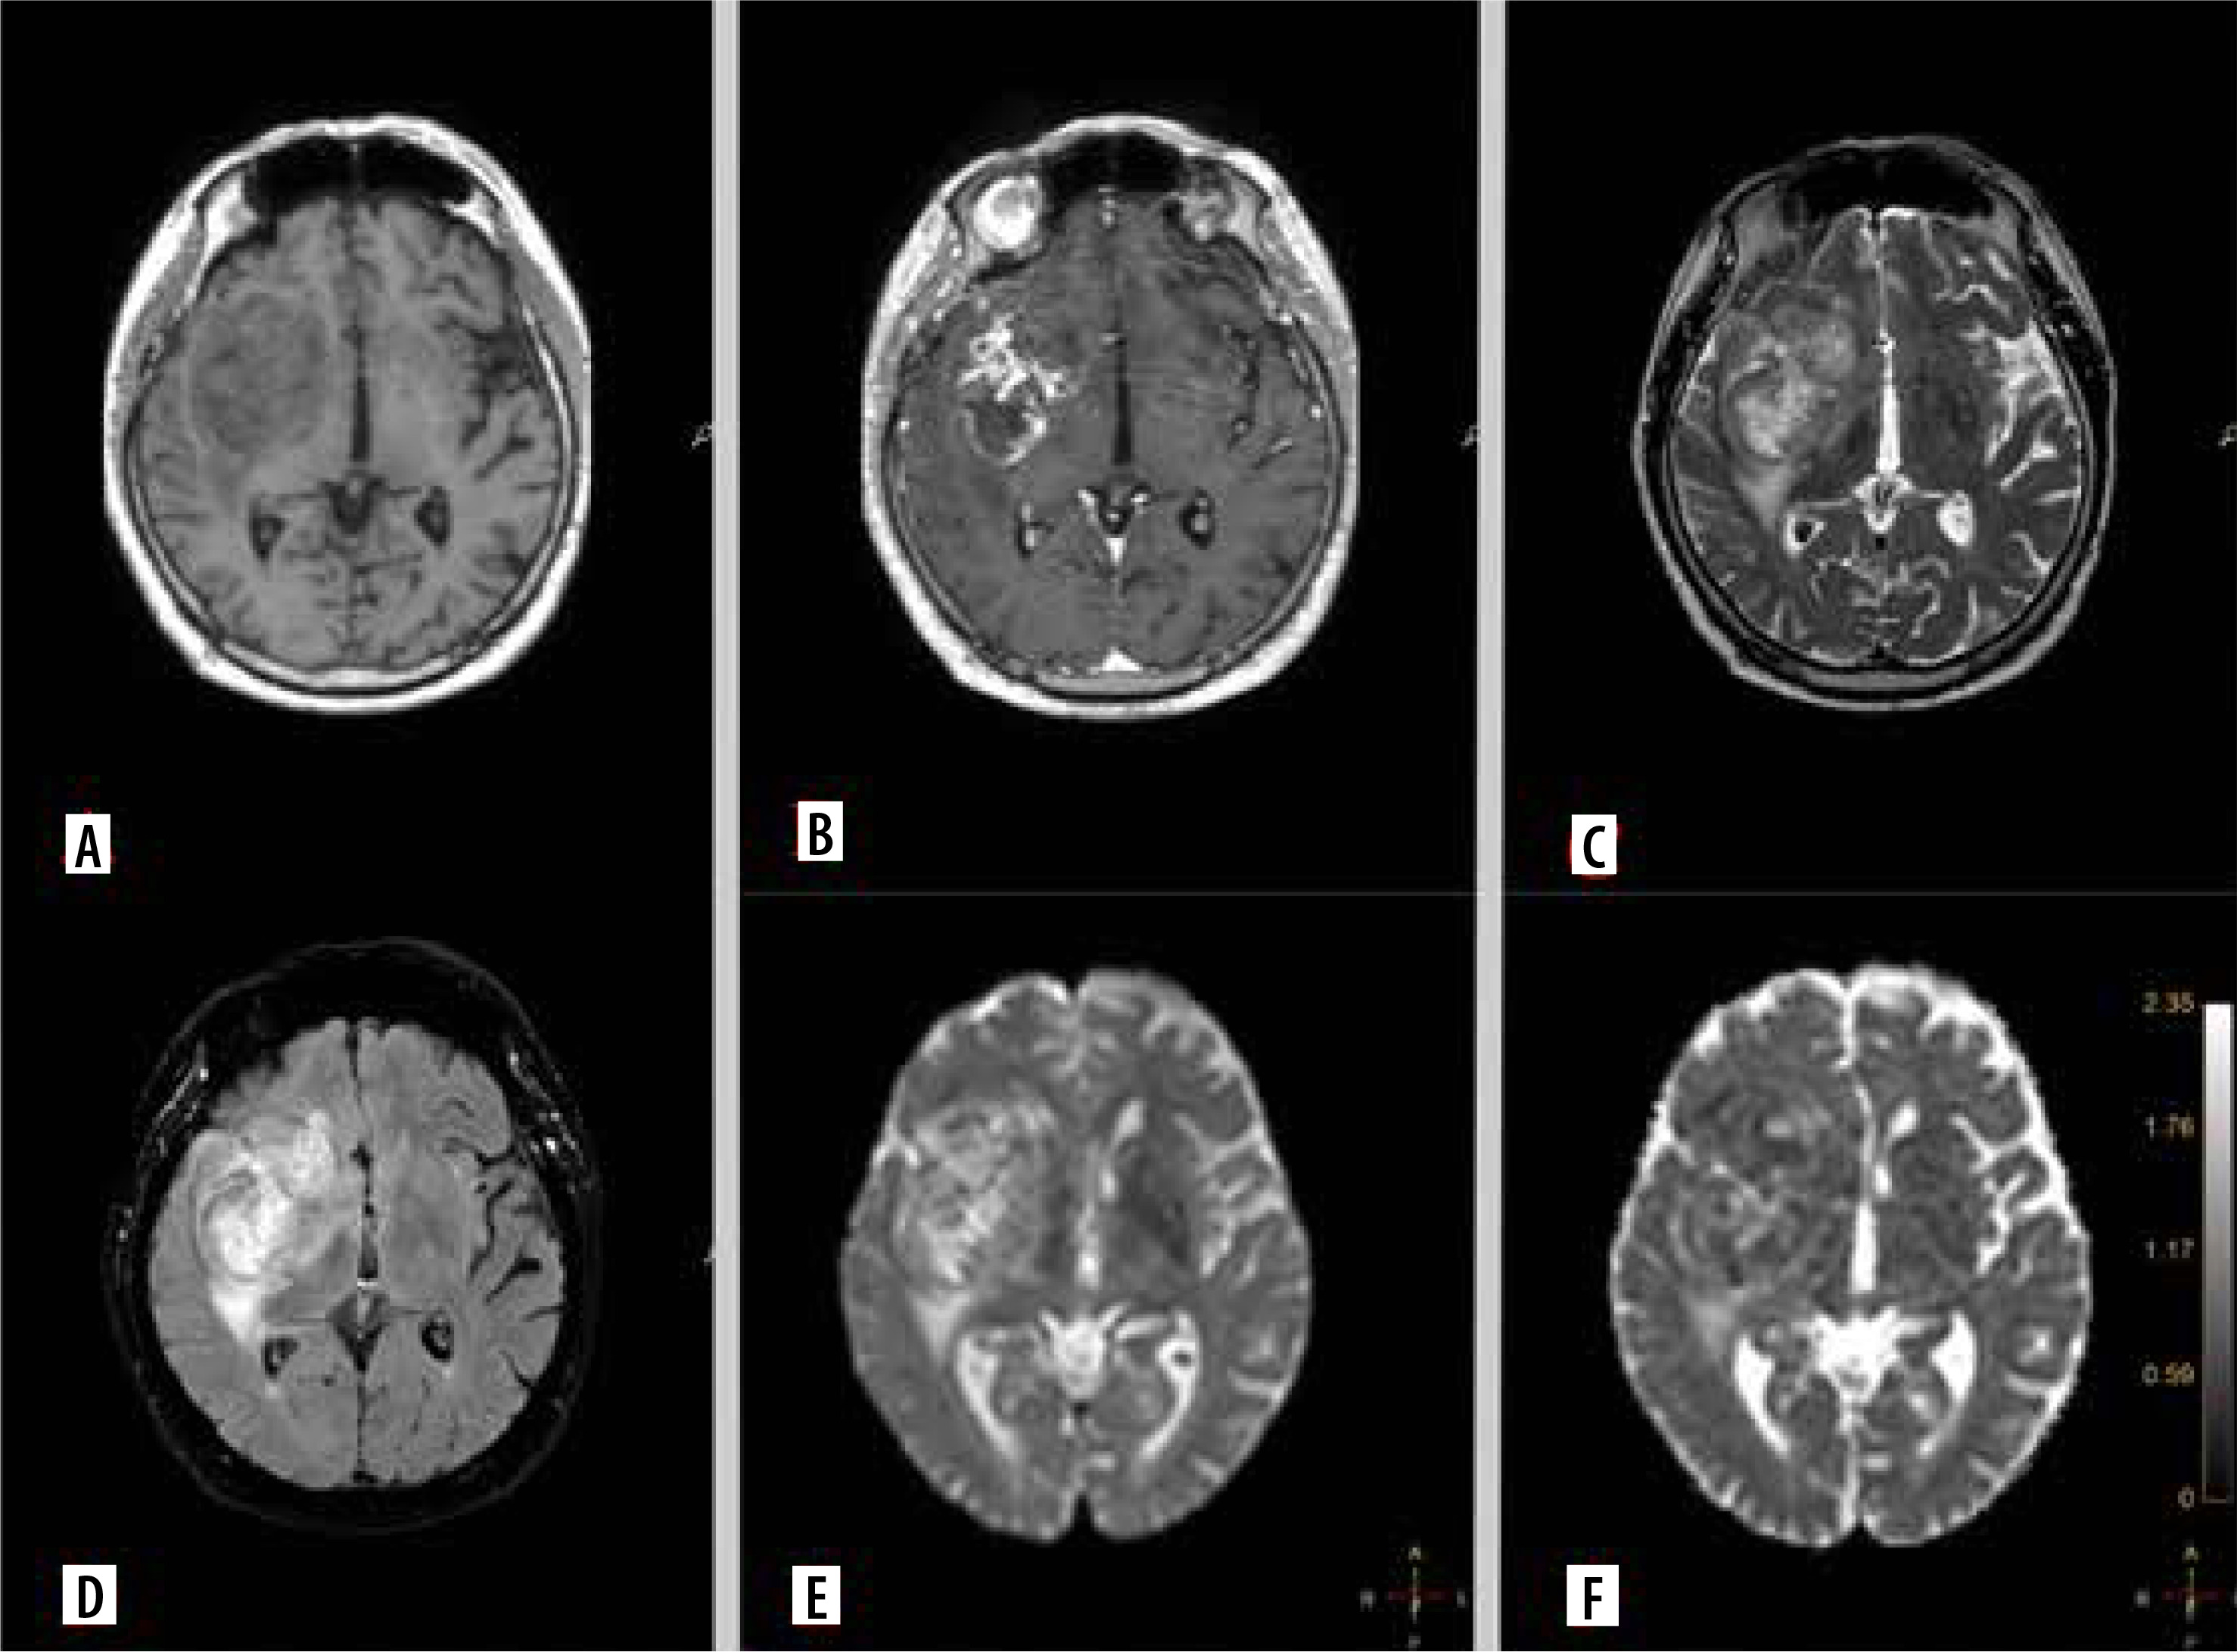
Table 3 outlines the imaging parameters assessed in the study.
Table 3
Imaging parameters
Contrast enhancement was observed in 67 patients (73.6%), while 24 patients (26.4%) showed no enhancement. The quality of enhancement was graded as follows: 0 means no enhancement (26.4%), 1 means mild/minimal enhancement (13.2%), and 2 means marked/avid enhancement (62.6%). T2/FLAIR mismatch was present in 9 patients (9.9%). The mean rCBF was 4.1, and the mean rCBV was 5.2. Intratumoural necrosis was noted in 66 patients (72.5%). The maximal diameter of the tumours had a mean of 44.6 mm, and the mean tumour volume was 31.2 cm³. The mean ADC was 1.36 × 10-³ mm²/s. Corpus callosum involvement was observed in 25 patients (27.5%), while cortical involvement was noted in 77 patients (84.6%). Ependymal extension was present in 59 patients (64.8%), and pial invasion was seen in 68 patients (74.7%).
Table 4 provides a comprehensive analysis of the relationship between various MRI perfusion parameters and genetic features in gliomas.
Table 4
Relationship between magnetic resonance imaging perfusion and genetic features
[ii] IDH1 – isocitrate dehydrogenase 1, MGMT – O6-methylguanine-DNA methyltransferase, EGFR – epidermal growth factor receptor, CDKN2A – loss of cyclin-dependent kinase inhibitor 2A, PDGFRA – platelet-derived growth factor receptor alpha gene, PTEN – phosphatase and tensin homologue, TERT – telomerase reverse transcriptase
Patients with IDH1-wildtype gliomas exhibited a significantly lower mean ADC value compared to those with IDH1 mutations (p < 0.05). Contrast enhancement was significantly more frequent in IDH1-wildtype gliomas compared to IDH1 mutant gliomas (p < 0.05). Enhancement quality, T2/FLAIR mismatch, and other variables also varied significantly between these 2 groups (p < 0.05).
Gliomas without MGMT promoter methylation had a significantly lower mean ADC value compared to MGMT promoter methylated gliomas (p < 0.05). Contrast enhancement was observed more frequently in gliomas with MGMT promoter methylation compared to unmethylated cases (p < 0.05). Similar trends were observed across other MRI parameters.
Gliomas without EGFR amplification had a higher mean ADC value compared to those with amplification (p < 0.05). Contrast enhancement was more common in EGFR-amplified gliomas compared to non-amplified cases (p < 0.05).
Gliomas with non-deleted CDKN2A exhibited a higher mean ADC value compared to heterozygous deletions and homozygous deletions (p < 0.05). Contrast enhancement was less frequent in gliomas with homozygous deletions compared to non-deleted gliomas (p < 0.05).
The mean ADC value was significantly higher in gliomas with TP53 deletion compared to non-deleted TP53 gliomas (p < 0.05).
Gliomas without PDGFRA amplification showed a higher mean ADC value compared to those with amplification, but this difference was not statistically significant.
Gliomas without PTEN deletion had a higher mean ADC value compared to those with PTEN deletion. This difference was statistically significant (p < 0.05). Contrast enhancement was more common in gliomas with PTEN deletion compared to non-deleted PTEN gliomas (p < 0.05).
Gliomas with TERT pathogenic variants exhibited a lower mean ADC value compared to those without the variant (p < 0.05). Contrast enhancement was more frequent in gliomas with TERT variants compared to those without (p < 0.05).
Discussion
The present study examines the significant relationship between DWI measures, particularly mean ADC values, and various genetic and molecular features of gliomas. The results of our research show that DWI and ADC values can be used as non-invasive indicators to predict genetic changes and tumour features. This is particularly significant in the setting of tumours where biopsy is challenging or unfeasible, providing a vital alternative for acquiring diagnostic and prognostic information without intrusive treatments.
IDH1 mutation status
Our results indicate that IDH1-wildtype gliomas exhibit significantly lower mean ADC values compared to IDH1-mutant gliomas. Mounting evidence suggests that mutations in the IDH gene family can decrease the production of α-ketoglutarate, resulting in the formation of the oncometabolite (R)-2-hydroxyglutarate. This, in turn, leads to an increase in cell proliferation or cellularity. Therefore, our findings align with previous studies suggesting that IDH1 wildtype gliomas are typically more aggressive and have higher cellularity, resulting in lower ADC values [4,9-12]. The significant association between lower ADC values and the presence of contrast enhancement further supports the aggressive nature of IDH1-wildtype gliomas. Prompt determination of the IDH1 gene status is crucial, particularly during the initial non-invasive diagnostic phase. The significance of the IDH1 gene status determines the subsequent genetic tests necessary for a comprehensive diagnosis (layered report structure) and accurate classification of the tumour, as required by the current CNS5 classification [8].
MGMT methylation
The study reveals that gliomas with unmethylated promoter of MGMT have lower mean ADC values compared to methylated MGMT gliomas. This observation corroborates existing literature indicating that MGMT methylation is associated with better prognosis and lower cellular density, reflected in higher ADC values [5]. However, it is important to note that the relationship between ADC values and MGMT status has been strongly debated in the literature. Some studies, such as those by Romano et al. [13] and Moon et al. [14], report higher ADC values in methylated MGMT tumours, supporting the notion of lower cellular density in these tumours. Conversely, Pope et al. [15] and others have found lower ADC values in unmethylated tumours, suggesting that these results may not be consistent across all cases and may vary depending on the tumour region analysed (e.g. enhancing versus peritumoral tissue). The higher frequency of contrast enhancement in methylated MGMT gliomas suggest enhanced tumour permeability and angiogenesis, characteristics often observed in these tumours [16]. Early assessment of MGMT promoter methylation is vital for optimising treatment strategies and improving prognostication in glioma patients. Specifically, patients with methylated promoters respond better to temozolomide [17]. It also aids in risk stratification, guiding clinical decision-making, and enhancing clinical trial design by selecting appropriate patient cohorts [18]. Thus, integrating MGMT methylation assessment early in the diagnostic process is crucial for effective glioma patient management.
According to the recent CNS5 and cIMPACT-NOW, specific genetic alterations change the final diagnosis. Confirming the presence of certain genetic alterations in glioma can reclassify the tumour as “molecularly” high-grade, resulting in a considerably lower survival rate compared to gliomas without mutations [19]. IDH1-wildtype lower-grade gliomas that exhibit one of three particular genetic markers (EGFR amplification, +7/–10 abnormality, or TERT promoter alterations) are classified as the most malignant type of tumour, known as WHO grade 4 [20]. In IDH1-mutant lower-grade gliomas, the mutation of the highest malignancy is CDKN2A homozygous deletion. Hence, identifying these indicators during the initial phase of diagnosis potentially influences subsequent treatment. Noninvasive assessment of molecular characteristics is primarily employed in patients for whom acquiring histopathology material is highly hazardous or unfeasible. For these patients, MRI and acquired ADC are advantageous because DWI is the typical sequence performed during initial diagnosis.
EGFR amplification
Gliomas without EGFR amplification showed higher mean ADC values compared to those with EGFR amplification. This is consistent with the notion that EGFR amplification is related to increased tumour aggressiveness and cellularity, resulting in lower ADC values [21]. The higher prevalence of contrast enhancement in EGFR amplified gliomas further underscores their aggressive phenotype.
CDKN2A deletion
In the presented study non-deleted CDKN2A gliomas exhibited higher mean ADC values compared to those with heterozygous or homozygous deletions. CDKN2A deletions are known to contribute to tumour progression and malignancy, which could be reflected in lower ADC values [22]. The relationship between CDKN2A gene status and ADC value has been investigated in several studies, which have shown contradictory findings. Indeed, certain research has shown a substantial correlation between ADC and CDKN2A, although in other studies the correlation is not statistically significant [23,24].
TERT pathogenic variants
TERT is an enzyme responsible for maintaining telomeres that safeguard genomic integrity during cell division. TERT is highly expressed in stem cells and cancer cells, playing a crucial role in cellular immortality. Mutations in promoter of TERT are a hallmark of various cancers, including glioblastoma, and they are commonly used as diagnostic and prognostic markers. Suppression of TERT by promotion mutation expression has been shown to increase cellular sensitivity to DNA damage, making TERT a promising target for novel therapeutic approaches in GBM. In our study, gliomas with TERT pathogenic variants exhibited lower mean ADC values, indicative of higher tumour cellularity and increased aggressiveness, which is in line with previous research [25]. This finding aligns with the established role of TERT mutations in promoting tumour proliferation and malignancy. Additionally, the significant association between TERT promoter mutations and increased contrast enhancement on MRI further underscores the aggressive nature of these tumours. Contrast enhancement reflects the disruption of the blood-brain barrier and neovascularisation, which are characteristic of high-grade, rapidly growing tumours. The combined observation of lower ADC values and greater contrast enhancement in TERT-mutant gliomas provides robust non-invasive indicators of tumour aggressiveness and highlights the potential utility of advanced imaging techniques in the characterisation and management of these malignancies.
In summary, this study highlights the utility of DWI and ADC values in non-invasively predicting the genetic and molecular landscape of gliomas. The significant correlations between imaging biomarkers and genetic features underscore the potential of advanced MRI techniques in guiding personalised treatment approaches.
Limitations of the study
Despite the promising findings and significant insights provided by this study, several limitations should be acknowledged to contextualise the results and guide future research.
Firstly, the study cohort, although comprehensive, was relatively small and drawn from a single institution. This limits the generalisability of the findings across broader populations and different clinical settings. Larger, multicentre studies are necessary to validate these results and account for potential variations in imaging protocols, genetic testing methods, and patient demographics. Secondly, the study’s retrospective design inherently introduces certain biases, including selection bias and information bias. The study also relied heavily on mean ADC values, which, while informative, may not capture the full complexity of tumour diffusion characteristics. ADC values can be influenced by various factors, including tumour heterogeneity, necrosis, and surrounding oedema. Advanced diffusion imaging techniques, such as diffusion tensor imaging (DTI) and diffusion kurtosis imaging (DKI), might provide more detailed insights into the microstructural properties of gliomas.
Future directions
This study reveals the potential of DWI and ADC values in glioma characterisation and treatment planning. To validate these associations, larger, multicentre cohorts are needed to account for variations in imaging protocols, genetic testing methods, and patient demographics. Longitudinal studies tracking changes in ADC values during and after treatment can provide insights into tumour response and resistance mechanisms. Moreover, further research is needed to understand the biological mechanisms driving the observed correlations between ADC values and genetic alterations. Automated analysis tools leveraging artificial intelligence and machine learning can facilitate the processing of large imaging datasets and aid in real-time clinical decision-making. Expanding research to include paediatric populations and rare glioma subtypes will ensure the benefits of advanced imaging techniques are realised across diverse patient groups.
Conclusions
This study underscores the significant potential of DWI and mean ADC values as non-invasive biomarkers for predicting genetic and molecular characteristics of gliomas. Our findings demonstrate that lower ADC values are generally associated with more aggressive tumour phenotypes and specific genetic alterations, such as IDH1-wildtype, MGMT unmethylated status, EGFR amplification, and CDKN2A homozygous deletion.
In conclusion, DWI and ADC metrics provide critical insights into the genetic and molecular landscape of gliomas, offering a non-invasive and effective tool for enhancing diagnostic precision and tailoring therapeutic interventions. This study highlights the transformative potential of advanced imaging in the era of personalised oncology, ultimately aiming to improve patient outcomes through more targeted and informed treatment strategies.