Introduction
For dental implants to be considered clinically successful, should absent pain and tenderness during function, mobility, or abscesses. It is also stated that stable, rigid implants with a pocket depth of 2 to 6 mm can be considered successful [1]. When examined radiologically, vertical marginal bone loss at the peri-implant surface should not exceed 1-2 mm in the first year after implant loading and 0.2 mm in later years [2]. Another factor that determines the success of dental implants is whether there is sufficient bone volume in the area where the implant is placed [3]. Insufficient bone in the buccolingual direction can lead to bone fenestrations and dehiscences formation, which compromise the long-term prognosis of dental implants [4]. Dehiscences is a buccal or facial alveolar bone-limited defect that exposes the roots of the dental implant or teeth from the alveolar crest to the apical. Fenestration is a window-shaped defect of 3 mm or more when the implant or tooth root is covered with gingival tissues rather than bone [5].
The determination of alveolar bone defects plays a role in determining the need for grafts before surgical procedures [6]. However, insufficient bone thickness can lead to negative consequences such as inaccurate implant placement during surgery, inflammatory biofilm, and occlusion errors. Moreover, it can lead to gingival recession, loss of alveolar bone, failing osseointegration, and implant failures [3,5,7,8].
The most common method for assessing marginal bone loss is conventional periapical radiography [1]. In implants, bone loss after the 1st placement occurs mostly on the facial or buccal side of the implant because the bone is thinner in these areas. However, periapical radiographs can detect bone loss in the mesial or distal. Because the buccal or facial area is superposed on 2-dimensional periapical radiographs, it is inadequate to show early bone destruction [9,10]. In computed tomography (CT), a 3-dimensional evaluation without superposition can be detected buccolingual or mesiodistal alveolar bone destruction [11]. Although CT has been shown to yield accurate and reliable assessments for orthodontic and maxillofacial applications, its effective dose is much higher than that of conventional radiography or cone beam CT (CBCT) [12].
As a result of technological advances in the field of dentistry, both digital imaging techniques and 3-dimensional imaging techniques have been introduced in the routine. Especially since the introduction of CBCT devices, the interest in 3D imaging has increased rapidly in the last decade [13,14].
Although CBCT is routinely using for implant planning, CT is also used in some instances where CBCT is not available. Moreover, with the introduction of modern multiple-detector computed tomography (MDCT) technology and continuing technological developments, especially iterative reconstruction algorithms, low dose CT examinations are currently employed, such as in lung and maxillofacial imaging. Various kV and mAs values have been used in MDCT with different estimated effective doses. A recent study, aimed at determining the distribution of effective dose in paranasal sinus imaging associated with a single low dose CT examination concluded that acceptable CT screening can be accomplished at an overall average computer tomography dose index (CTDI) of approximately 2.9 mGy [15].
Also, the ALARA (as low as reasonably achievable) principle, which is an underlined view in radiation safety, emphasizes that the radiation dose given to living structures is the lowest possible value without affecting diagnosis and treatment. Following this principle, the most appropriate dose protocol should be selected based on the reliability and accuracy of the clinical diagnostic result and radiation dose [16].
Moreover, no extensive data on the use of low dose CT are available, and further studies are needed to assess the usefulness of this technique for maxillofacial and dental imaging.
The purpose of this study was to evaluate the visibility of peri-implant fenestrations and dehiscences for dental implant exposures from ultra-low dose and low dose CT set-ups. The null hypothesis indicated that there was no significant difference in the detection of peri-implant defects at the 2 different dose set-ups on the detection of peri-implant defects.
Material and methods
Study design
The sample size was calculated with the GPower 3.1 software (http://www.gpower.hhu.de/); the total mean of 2 groups compared based on Student’s t-test with the power of 80% and 0.05 type 1 error was found to be at least 13 patients.
Based on the study of de-Azevedo-Vaz et al. [4], soft tissue-free ribs were used to represent the alveolar bone. Fresh beef ribs were obtained from a local butcher from slaughtered animals. A total of 20 dental implants (NTA, Pilatus Swiss Dental, Egolzwil, Switzerland) were used in diameter range, 3.7-5.1 mm; length range, 8.5-10 mm.After placement of 20 titanium implants, similarly to the literature [17], 3-mm diameter fenestrations and dehiscences were created on the rib. In the apical of 6 randomly selected implants, fenestrations were formed in elliptical form 10 mm apical to the upper edge of the rib. In the cervical of 8 implants, half-elliptical form dehiscences were formed on the alveolar crest. No defects were created around the other 6 implants, and they were evaluated as a control group.
Radiographic imaging
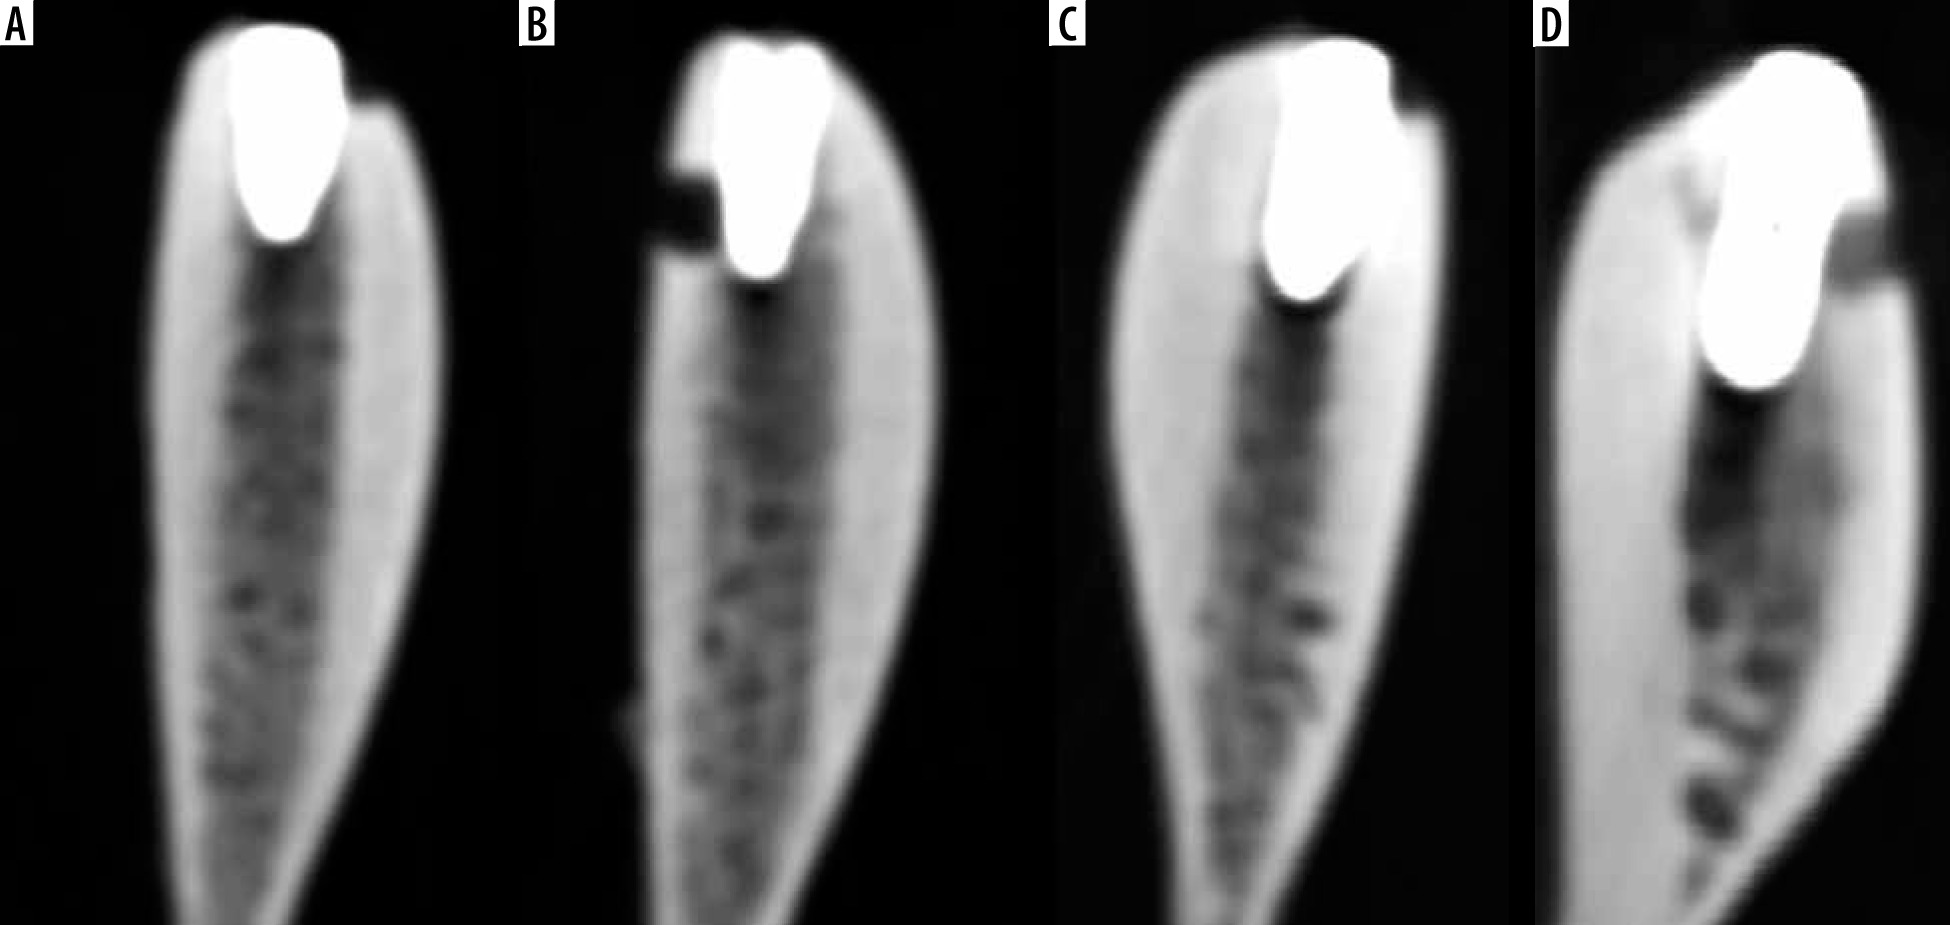
CTs were taken after the ribs were placed in a water-filled container to resemble soft-tissue attenuation. CT images were performed with a 256-slice CT scanner (Revolution CT; GE Healthcare). To evaluate the visibility of the created defects in 2 different doses, the samples were firstly taken with the ultra-low dose protocol (80 kVp, 50 mA, 1.25 mm slice thickness). Then the same samples were scanned with the low dose protocol (100 kVp, 50 mA, 1.25 mm slice thickness). The size-specific dose estimates in CT (SSDE) of the ultra-low dose protocol and low dose protocol were 6.66 mGy and 12.14 mGy, respectively. The dose length protocol (DLP) of the ultra-low dose and low dose protocol was 77.32 mGy cm and 171.57 mGy cm, respectively. The CTDI of the ultra-low dose protocol and low dose protocol was 5.95 mGy and 10.90 mGy, respectively (Figure 1).
Sample analysis
CT images were evaluated by 2 oral radiologists (C.A.B. and G.S., 5 and 6 years of clinical experience), 1 radiologist (M.S., 6 years of clinical experience), who did not know whether there were defects. A 5-point scale was used to evaluate the images (1 – defect absent; 2 – defect probably absent; 3 – uncertain; 4 – defect probably present; 5 – defect present). Macroscopic analysis of the implanted ribs was accepted as the gold standard (defect present or absent) [4]. Evaluations were made with a RadiAnt Dicom Viewer (2020.1, Medixant, Poznan, Poland). Observers were allowed to view the images in 3 planes (sagittal, axial, coronal), change the contrast or brightness of the images, and use the rotate or zoom tool.
Statistical analysis
Kappa’s a was obtained regarding compatibility among the observers’ agreement on the correct diagnosis of the defect types between the 2 protocols using SPSS 26.0. (SPSS Inc., Chicago, IL). Based on Landis and Koch [18], low agreement – 0.40; moderate agreement – 0.40-0.59; good agreement – 0.60-0.74; and excellent agreement – 0.75-1.00 were considered. The areas under receiver operating characteristic (ROC) curves (Az values) for the 2 protocols for each observer were computed from the ROC-curve and compared with the Wilcoxon-test at a 5% significance level. Also, the sensitivity (the correct identification of a defect presence), specificity (the correct identification of a defect absence), accuracy (proportion of correctness), positive predictive value (PPV: the probability that a positive evaluation is a true-positive result), and negative predictive value (NPV: the probability that a negative evaluation is a true-negative result) were calculated for each protocol. In the study, assessment of the compatibility of diagnosis between observers revealed a group of individuals in the group of people who have the case group and in the control group.
Results
The average and standard deviations of the kappa a values are shown in Table 1. The inter-observer agreement of the ultra-low dose protocol was good, and the inter-observer agreement of the low dose protocol was excellent.
Table 1
Values of kappa’s α for inter-observer agreement
| Fenestration, mean (SD) | Dehiscences, mean (SD) | |
|---|---|---|
| Ultra-low dose | 0.64 (0.03) | 0.62 (0.11) |
| Low dose | 0.72 (0.17) | 0.75 (0.14) |
The Az values and p-values for the diagnosis of peri-implant defects are shown in Table 2. The diagnosis of observers was equal at both dose protocol for fenestration and dehiscence diagnosis without a significant difference. Also, there was also no significant difference between Az values of the ultra-low dose and low dose protocol in both defects.
Table 2
Value of the area under the receiver operating characteristic (ROC) curve (Az values) and p-value for each observer and protocols
Of all implants, 6 had fenestrations, 8 had dehiscences, and 6 had no defect. The sensitivity (the correct identification of a defect presence), specificity (the correct identification of a defect absence), accuracy (proportion of correctness), PPV, and NPV for the studied protocols are shown in Table 3. Comparison of both defects showed that values were higher for fenestrations than for dehiscences, but they were similar across protocols.
Discussion
Peri-implantitis is defects that can develop due to poor oral hygiene, history of periodontitis, bacteria, systemic diseases such as diabetes, smoking, or technical issues such as implant surface, type, structure, and osseointegration degree [19,20]. Peri-implant defects such as fenestrations and dehiscences are factors that decrease the success of the implant [1]. In addition to decreasing implant success, undiagnosed alveolar bone defects can also lead to a relapse of orthodontic treatment [21] or gingival recession that will result in an unaesthetic ending of orthodontic treatment [22]. Also, cases of peri-implantitis associated with endodontic problems have been reported in the literature [23].
Jeffcoat et al. [24] reported that 2-dimensional imaging is strongly affected by vertical and horizontal angulation errors during film exposure. Therefore, 3-dimensional imaging is recommended for the visualization of periodontal defects [25]. Radiation can cause carcinogenesis genetic damage to irradiated tissues [26]. Radiation is known to cause DNA damage with a low probability of ionization effect [27]. Therefore, radiography should be taken with the lowest radiation dose that will not affect the diagnosis and treatment, without damaging the biological structure in the area of interest [28].
In the present study, the effectiveness of the 2 different dose protocols invisibility of peri-implant defects were compared. As a result of this study, it was observed that there was no statistically significant difference between ultra-low dose and low dose protocols. Although in the literature there are studies visibility of peri-implant defects according to voxel size, the field of view, and the use of various algorithms and filters, there are few articles about dose-related [6,17,29-31]. Values from Misch et al. [30] (47.7 mA, 120 kVp) and Pinsky et al. [31] (98 mA, 120 kVp) were used as the scan protocol for the detection of fenestrations and dehiscences. In both studies, it was stated that artificially created fenestrations and dehiscences were identified and the measurement accuracy was high. In our study, 2 different scan protocols, 50 mA 100 kVp and 50 mA 80 kVp, were used. Although a lower rate of mA and kVp was used than the work of both Misch et al. [30] and Pinsky et al. [31], defects were detected and there was no statistically significant difference between them. Bayrak et al. [17] evaluated the visibility of peri-implant defects with the metal artifact reduction algorithm and the adaptive image noise optimizer filter. As a result, they stated that the use of both filters together would be useful in detecting defects. In another study [29], 2 different voxel sizes (0.2 mm3 and 0.12 mm3), and two different scan modes (180° and 360°), were used to detect defects. It was stated that the voxel size did not affect the visibility of defects, but dehiscences were seen more clearly with a 360° scan mode. Kamburoglu et al. [6] investigated the effectiveness of the field of view in detecting peri-implant defects and stated that there was no relationship between the field of view and defect visibility. Interobserver agreement was good to excellent for the 2 different doses protocols in the present study. In this study, the inter-observer agreement of the ultra-low dose protocol was good, and the inter-observer agreement of the low dose protocol was excellent. However, de-Azevedo-Vaz et al. [4] found that inter-observer agreement was moderate to excellent in their study. The reason for this may be that the imaging techniques used in both studies are different.
Limitations of the study
This study has some limitations. The first is that the number of samples is low. It is thought that studies carried out on larger samples will yield more realistic results. Another is that the bone structure in which defects are formed did not belong to human bone. Although it is supported by the literature that cow ribs are similar to the human mandible bone in terms of bone density and cortical-cancellous bone relationship [32-34], the ribs do not mimic the human bone. Another limitation is the use of implants of different sizes and diameters. Whether different sizes and diameters of implants will change the result of the study may be the subject of another study.
Conclusions
In this study, it was found that there was no difference between the ultra-low dose protocol and the low dose protocol in imaging bone defects. In the radiological examination of cases with peri-implantitis defects, it is thought that a lower dose protocol can be applied to patients following the ALARA principle.