Introduction
Malignant diseases are a significant contributor to global mortality rates. Breast cancer stands out as the most prevalent form of cancer among women across the world [1]. Timely detection of these conditions is crucial for successful treatment outcomes. Consequently, advanced imaging techniques have been introduced to enhance the prospects of early breast cancer diagnosis. A range of modalities, such as ultrasonography (US), mammography, and magnetic resonance imaging (MRI) are employed to identify breast cancer [2]. From these, mammography stands out as a relatively cost-effective, straightforward, expedient, and widely utilised screening tool for the early identification of breast cancer. This is because mammographic imaging can reveal even subtle alterations within the breast that might not be detectable through physical examination [3].
Minuscule calcium deposits, known as microcalcifications, are among the earliest indicators of breast cancer that can be identified through screening modalities [2]. However, these formations within breast tissues often pose diagnostic challenges when using mammography because they tend to exhibit low contrast. Additionally, the images can be compromised by random distortions, referred to as noise, stemming from environmental factors or the imaging equipment itself. Numerous algorithms have been devised to eliminate these undesirable artifacts from the original images, thereby enhancing their quality. Computer-aided systems (CAD) employing various medical image processing techniques have been instrumental in this image enhancement process [4]. Currently, medical image processing stands out as one of the most rapidly evolving domains within the healthcare sector.
The fundamental aim of image processing in the medical field is to render diagnostic and treatment-related imagery more comprehensible and reliable. In the context of breast cancer diagnosis, CAD systems, incorporating diverse image processing algorithms and statistical methodologies, can prove invaluable in ascertaining the presence of abnormal growths and differentiating between malignant and benign lesions [2].
The discipline of image processing revolves around transforming an image from one format to another. This process involves applying various operations to digital images, facilitated by the utilisation of mathematical algorithms executed through dedicated computer software. In essence, image processing entails deriving numerical values suitable for the intended application by applying an array of computer-based algorithms to the acquired imagery. The overarching goal of these operations is to enhance the quality of the image. However, the image source may introduce systematic or random errors and noise, which can compromise the integrity of the individual pixels. Consequently, pre-processing algorithms are employed to mitigate these undesirable artifacts, rendering the images more comprehensible and practical for use. The image processing workflow can be broadly divided into 5 distinct stages: segmentation, image pre-processing, feature selection, classification, and feature extraction.
Prior to the application of any image processing techniques, the implementation of pre-processing algorithms holds paramount significance in enhancing the quality of the obtained results [5]. The existing body of research has proposed a myriad of pre-processing algorithms aimed at mitigating the risk of misdiagnosis in mammographic images [5-10]. These techniques encompass a diverse range of methods, including Wiener filtering, Gaussian filtering, median filtering, mean filtering, image resizing, unsharp masking, histogram equalisation, anisotropic diffusion, and contrast-limited adaptive histogram equalisation (CLAHE). Notably, these studies have underscored the notion that the choice of pre-processing algorithms can significantly impact the overall classification performance [6-8].
In a study conducted by Ganvir et al. [6] the researchers explored the efficacy of various pre-processing techniques, including median filtering, Wiener filtering, anisotropic filtering, and wavelet-based filtering, in addressing the challenges of low contrast and unwanted noise encountered in mammographic images. These filtering methods were comparatively evaluated using several performance metrics, such as root mean square error (RMSE), selfsimilarity index measure (SSIM), signal-to-noise ratio (SNR), standard deviation (SD), and peak signal-to-noise ratio (PSNR). The findings of this study indicated that the combination of anisotropic diffusion and waveletbased filtering outperformed the other pre-processing approaches examined.
In a study conducted by Ramani et al. [7], the researchers investigated the performance of various pre-processing techniques, including mean filtering, median filtering, adaptive median filtering, and Wiener filtering, in improving the quality of mammographic images. These filtering methods were evaluated using a set of objective image quality metrics, such as mean square error, peak signal-to-noise ratio, average distance, and maximum difference. Based on the assessment, the researchers concluded that the application of the adaptive median filter yielded superior image quality compared to the other filtering approaches examined.
The existing body of research has explored the individual and combined application of various pre-processing techniques, such as those involving double and triple algorithm combinations [6-8]. These pre-processing methods have been shown to have a direct impact on the subsequent steps of feature extraction and segmentation. However, there is a lack of comprehensive studies that have systematically investigated the classification performance of different step-wise combinations of these pre-processing approaches using machine learning algorithms. In the current study, 3 specific pre-processing techniques are focused on: median filtering (MF) as an image smoothing filter, unsharp masking (USM) utilised as a filter for enhancing image sharpness, and CLAHE to enhance image contrast.
The primary objective of this study is to examine the impact of employing diverse combinations of image enhancement algorithms on the classification performance of machine learning methods, with the aim of improving the contrast and reducing the noise in mammographic images. The study follows a comprehensive approach, encompassing various stages, including region of interest (ROI) extraction, segmentation, image pre-processing, feature selection, feature extraction, and classification. In the image pre-processing stage, the efficacy of different algorithms in distinguishing between normal and abnormal tissue types was investigated and compared. Subsequently, the study delved into the effects of these pre-processing algorithms on the separation of malignant and benign tissue classifications.
Material and methods
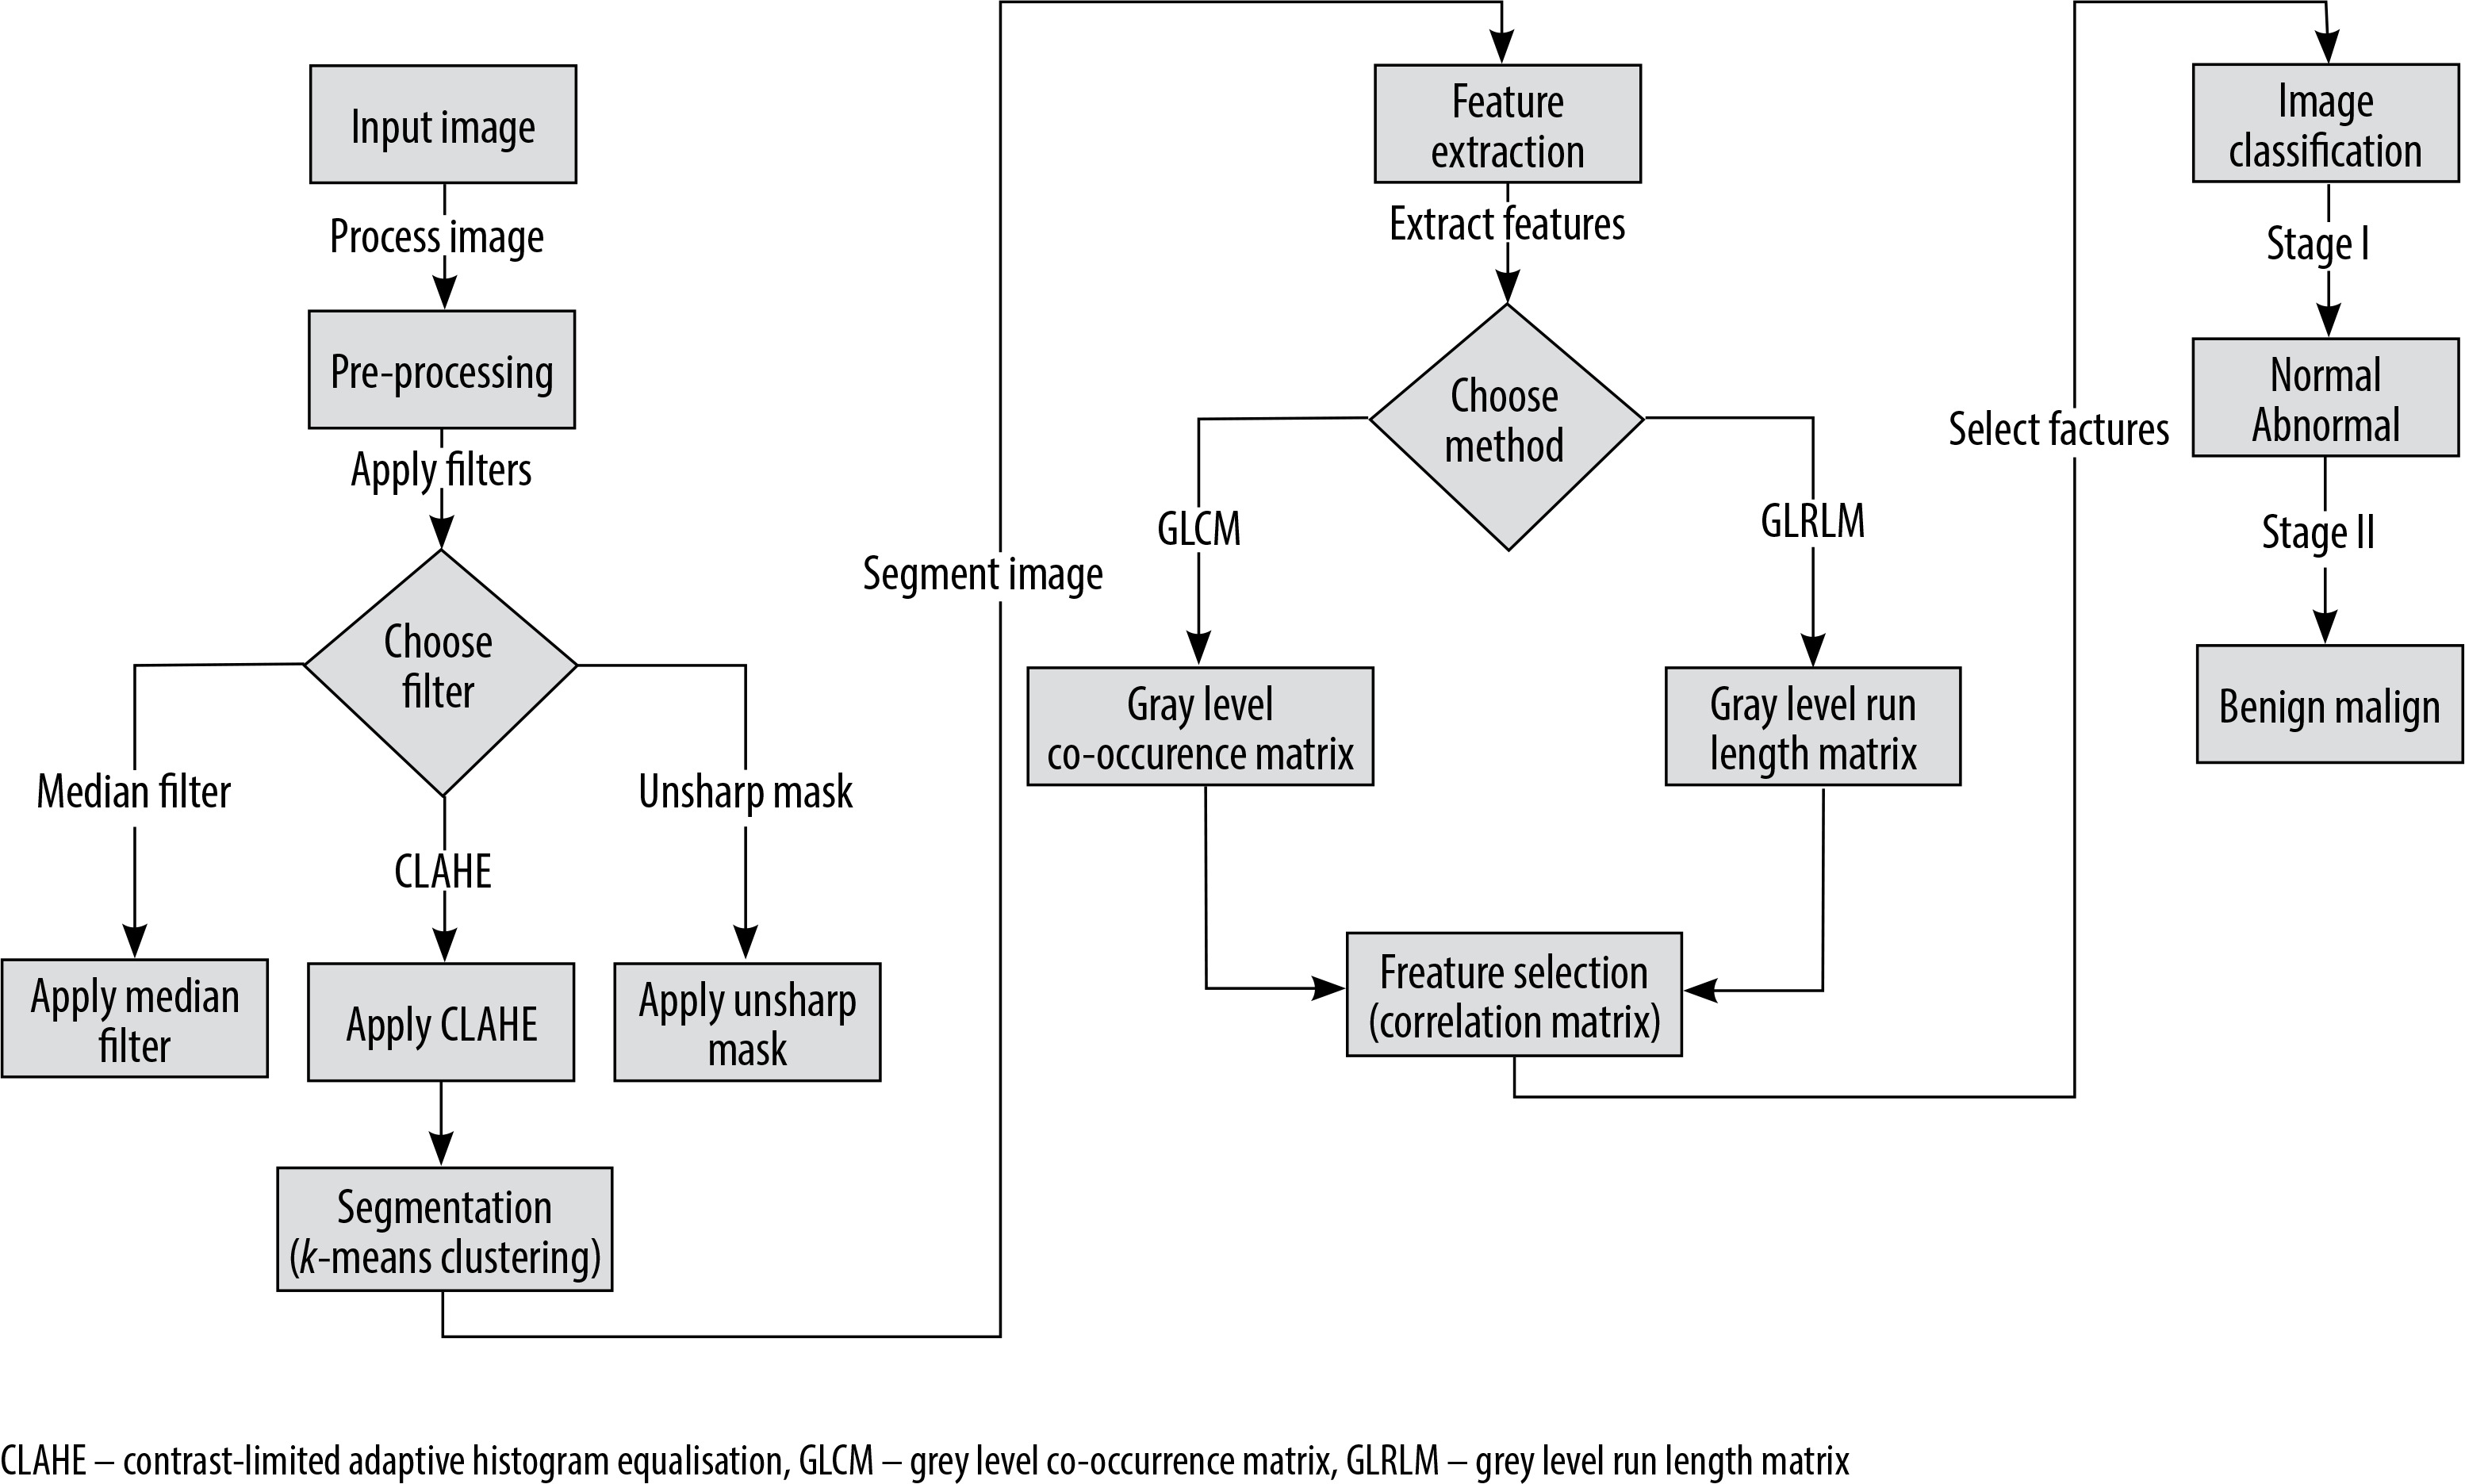
This study made use of an openly available database as its data source. Figure 1 provides a flow diagram illustrating the steps undertaken to prepare the dataset utilised in the study. The study leveraged several software tools for image processing, including MATLAB R2017b, MedPic, and Fiji-ImageJ [11-13]. Additionally, the R Studio [14] software was utilised to evaluate the performance of the classification methods. The visualisations presented in the figures were generated using the “ggplot2” package [15] within the RStudio environment.
Description of dataset
For the purposes of this study, the openly available mini-MIAS database [16] was utilised. Although this dataset is considered relatively dated, it remains widely used in the existing literature [5-7,9,10,17,18]. The mammography dataset employed in this research encompasses a total of 322 digitised images, corresponding to the left and right breast scans of 161 patients. The database includes all available mediolateral oblique (MLO) views of the left and right breasts. The images are provided in the Portable Gray Map (PGM) format. Each image has a greyscale spectrum ranging from 0 to 255 and a size of 1024 × 1024 pixels.
Pre-processing
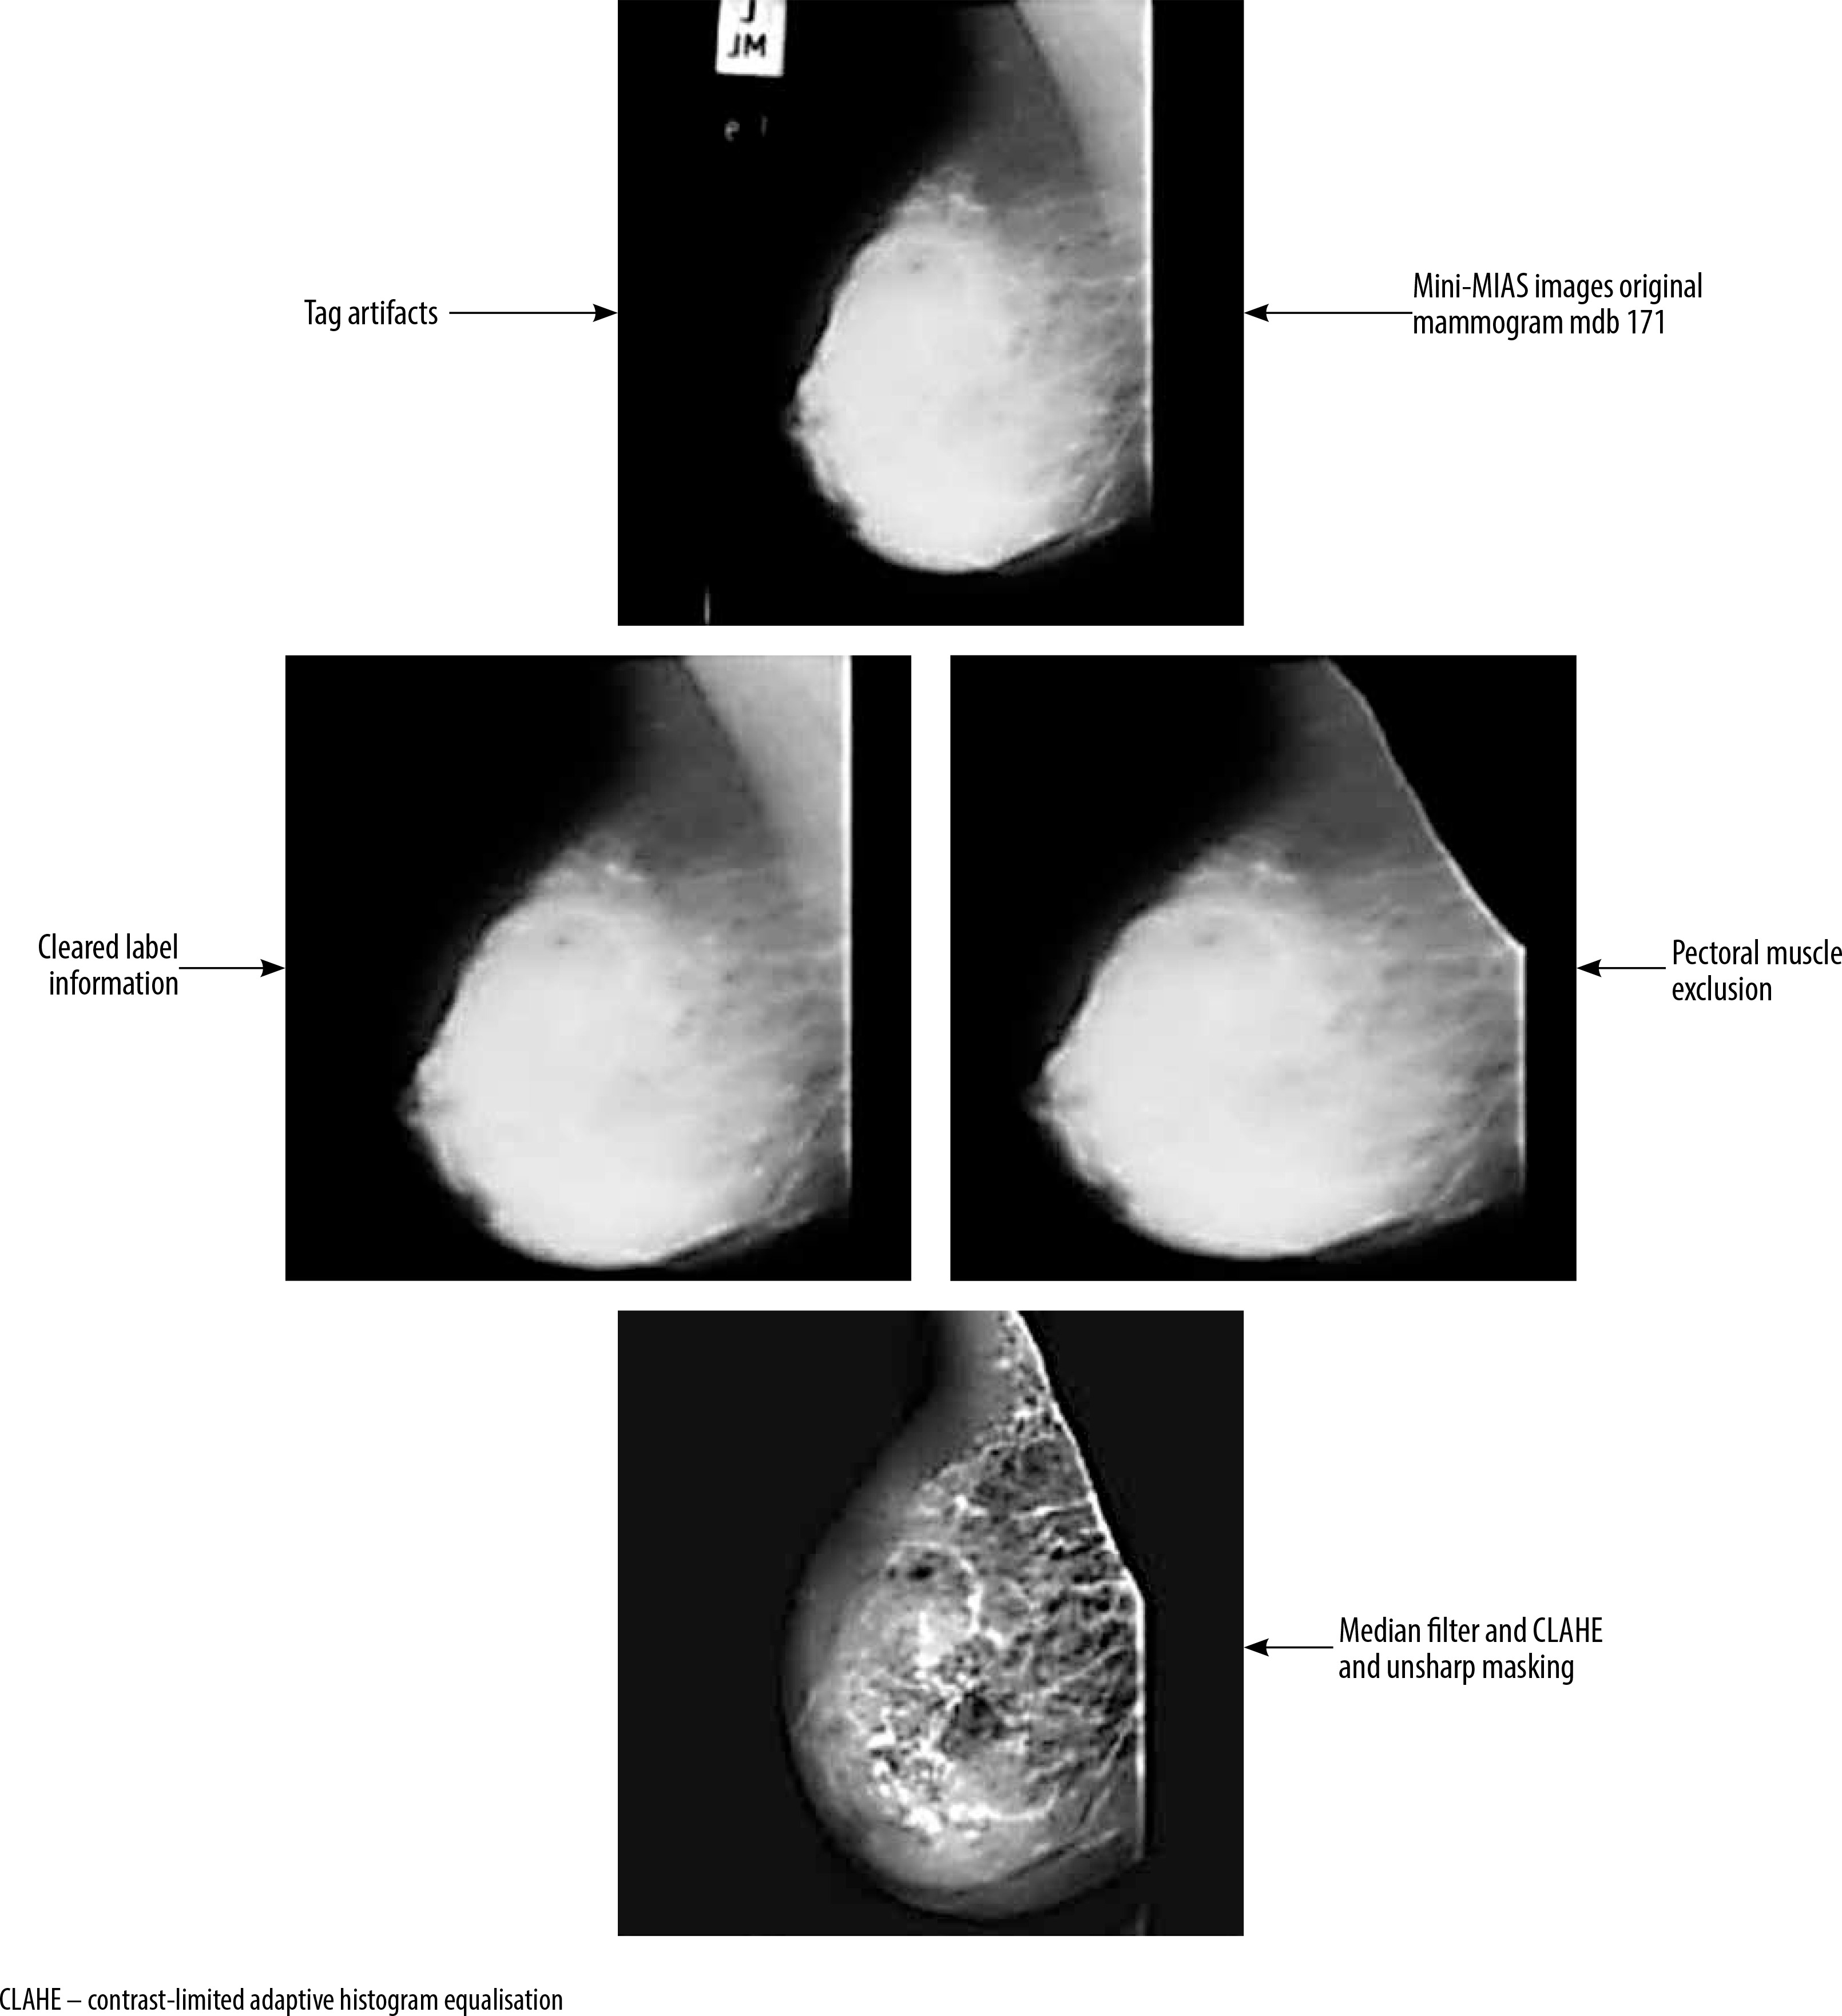
The mini-MIAS database contains certain mammographic images that include label information. These labels, which are generated by the mammography device, have high-density values that may lead to inaccurate results during the image analysis process. Consequently, it is necessary to remove these labels from the mammographic images. To achieve this, a combination of thresholding, morphological operations, and filtering methods as part of the pre-processing stage [19-21] was employed.
The mammography images were initially transformed into a binary (black and white) format by applying a thresholding method. This procedure involved setting pixels with values above the threshold to white, and those below the threshold to black. Subsequently, they performed morphological operations of dilation and erosion on the black and white images, with the aim of removing any regions containing labels and numbers. The resulting black and white images were then used as a mask on the original images, enabling the elimination of areas outside the breast region.
Next, various filtering methods were employed as part of the pre-processing stage to improve the segmentation results and enhance the image quality. They tested different combinations of algorithms, including CLAHE (contrast limited adaptive histogram equalisation), median filter, and unsharp masking. These combinations included CLAHE applied individually, as well as CLAHE and median filter, unsharp masking and median filter, unsharp masking and CLAHE, and unsharp masking + CLAHE + median. Each of these combinations was applied to the mammographic images.
As shown in Figure 2, the mdb171 mammographic image, containing a malignant mass, was processed using the unsharp masking, CLAHE, and median filter algorithms.
Region of interest and segmentation
The segmentation of the pectoral muscle from the mammographic images using an appropriate segmentation method [21,22] is a crucial next step after preprocessing to remove any label information because it allows the extraction of the ROIs. In the context of image processing, it is essential to emphasise the ROIs because these are the specific areas of the image that will be analysed, filtered, or manipulated. Characteristics such as colour, shape, texture, and contrast can be extracted from these ROI regions, and computer-aided diagnostic systems can then be employed to classify the images based on the extracted features.
In this research, the segmentation procedure employed the k-means clustering algorithm, a widely accepted method in the field, owing to its ability to effectively partition the data without relying on any prior knowledge about the data, and its superior performance compared to alternative region-growing techniques.
The k-means algorithm is frequently applied for segmenting images in numerous image processing tasks [17,21,23]. This method, a prominent unsupervised clustering technique [21], effectively divides an image into distinct regions by specifying a set number of clusters. It begins by choosing an initial pixel or region and then groups neighbouring pixels into clusters, thereby determining their regional association.
In the context of mammographic images, this segmentation method can typically be used to divide the image into 3 main clusters: the breast tissue, the pectoral muscle, and the background. By applying this clustering algorithm, the image can be effectively segmented into these key regions of interest.
To utilise the segmentation technique of k-means clustering, the process begins by defining K centroids, which serve as the initial starting points for each cluster. Then, a feature region is determined for each centroid, with the aim of grouping together pixels with similar characteristics.
The underlying principle of the k-means clustering segmentation method can be expressed using the following equation (1):
To begin the k-means clustering process, the initial cluster centroids are determined using random methods, based on the desired number of clusters. In this context, the distance from point
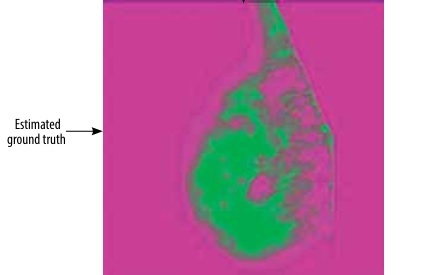
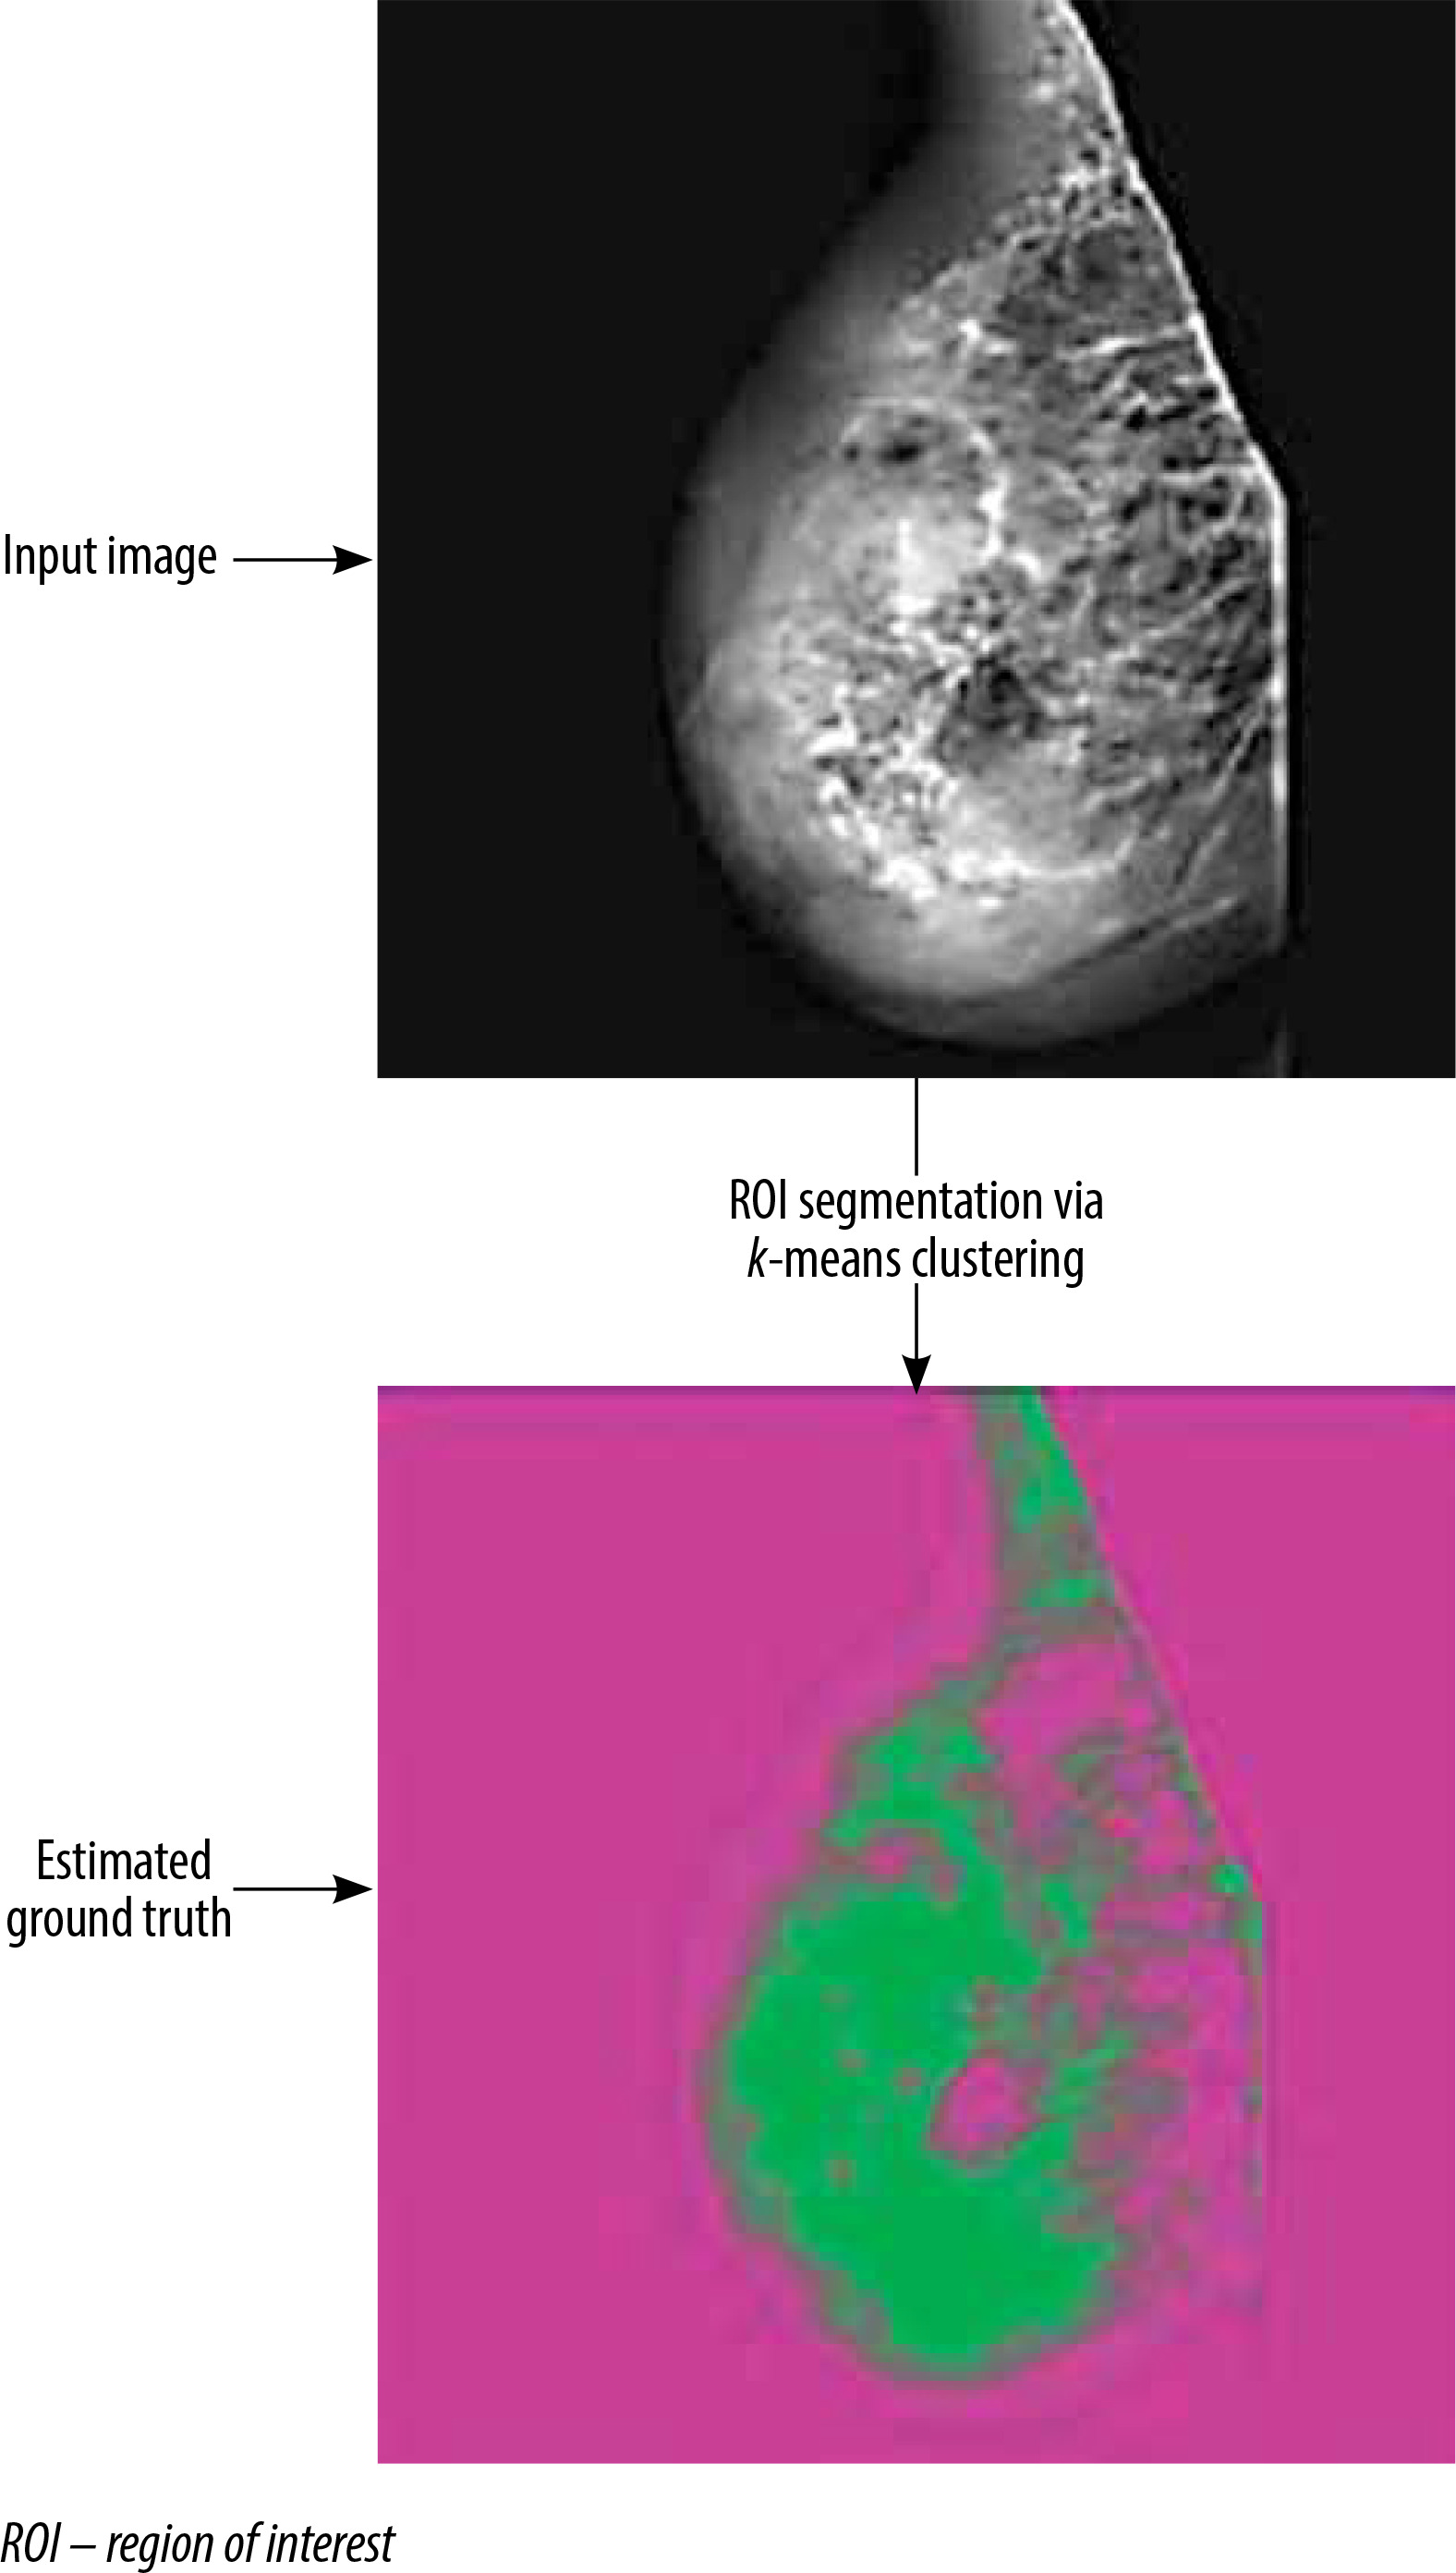
Once the segmentation process using the k-means clustering method has been completed, the resulting segmented images can be overlaid as a mask on the original mammographic images. This step generates the ground truth images, which serve as the reference for the segmentation results.
Figure 3 showcases an illustrative example of the output generated by the k-means clustering segmentation algorithm.
Selection and feature extraction
Numerical information (features) can be extracted from medical images through the application of appropriate statistical algorithms, which is a crucial step in the field of image processing, as it allows for the extraction of data that may not be readily observable through visual inspection alone.
For this purpose, various types of features can be extracted, including statistical, textural, morphological, and shape-based features. In the current study, textural features were focused on being extracted using the grey level run length matrix (GLRLM) and grey level co-occurrence matrix (GLCM) methods, which are extensively utilised in the analysis of textures.
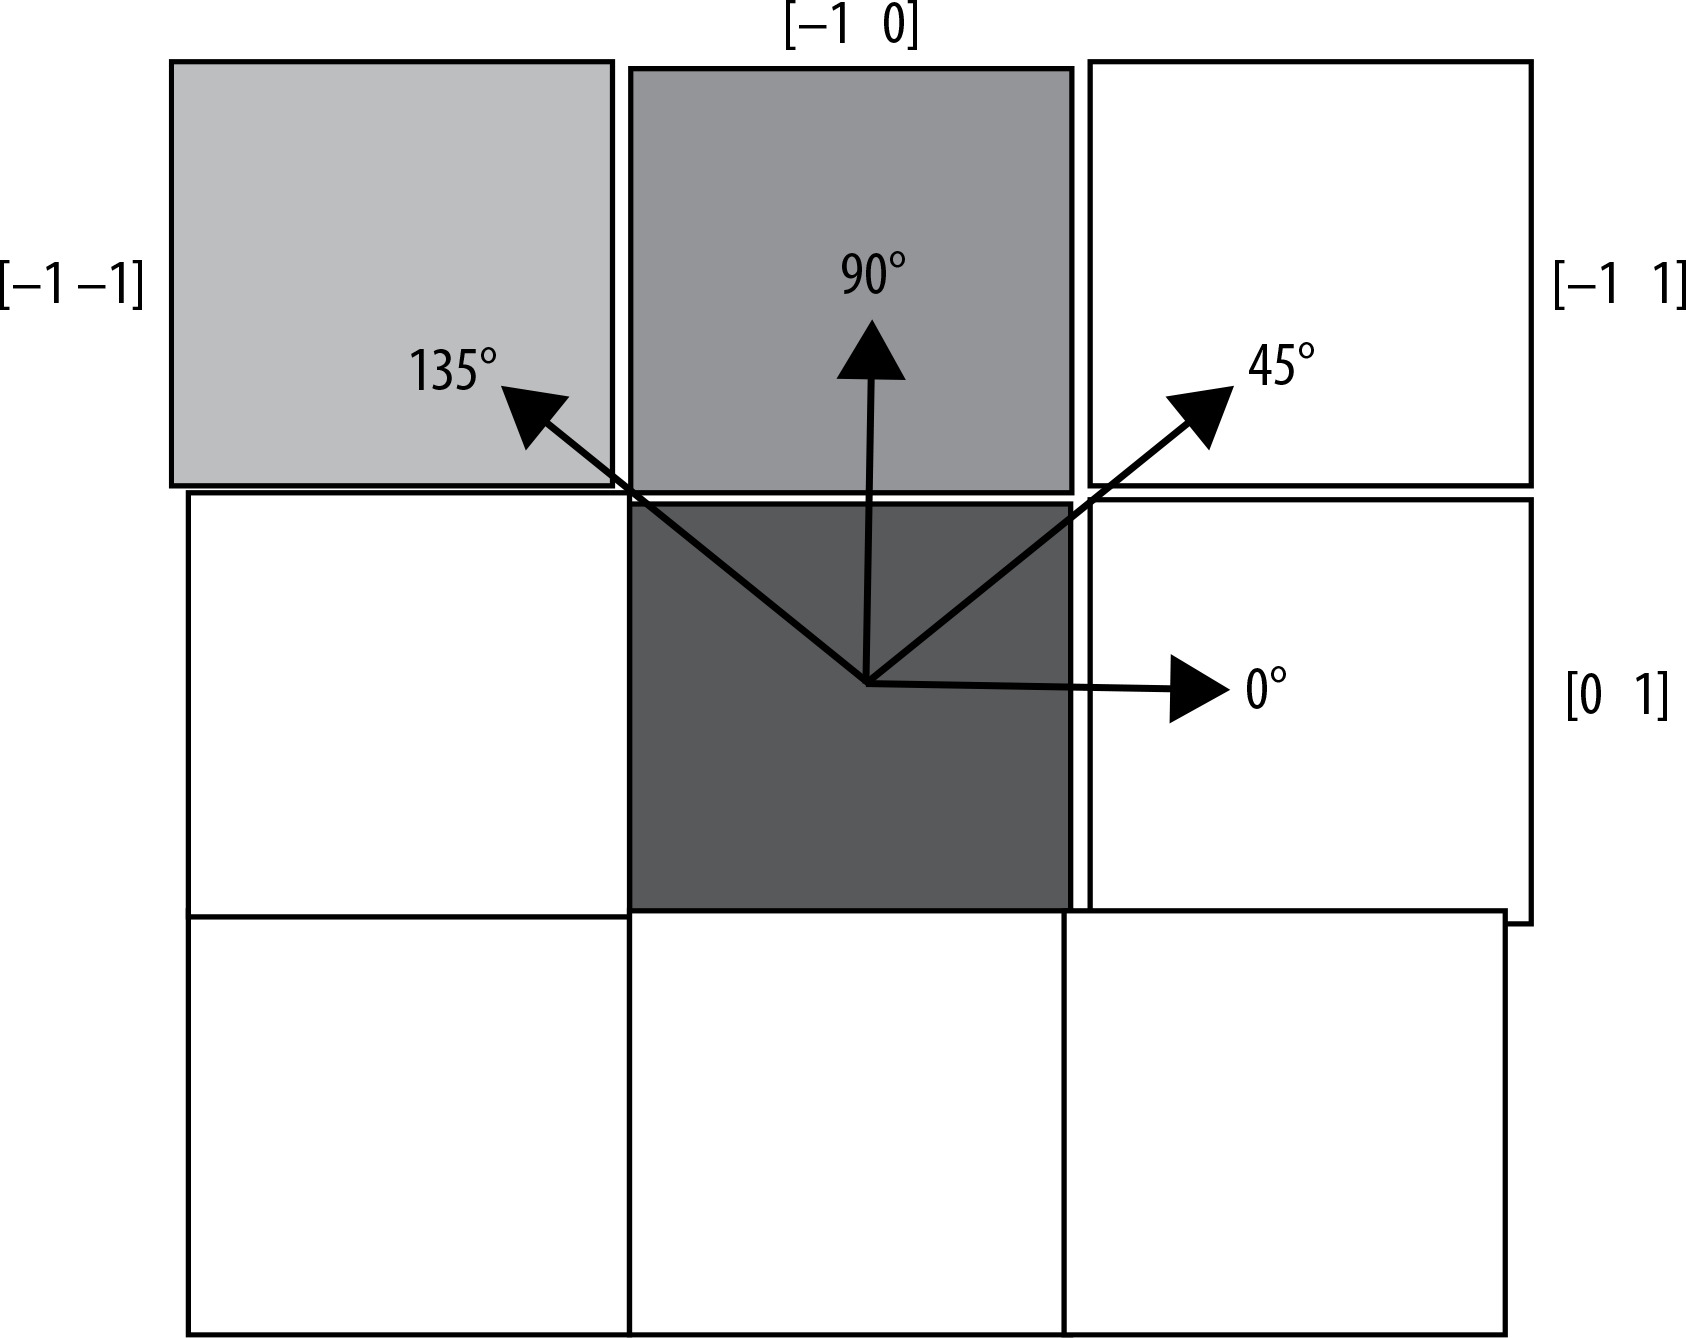
Following the preprocessing and segmentation of the mammographic images, feature extraction was carried out. From the regions of interest (ROIs), a total of 22 GLCM features and 11 GLRLM features were extracted, with calculations performed across 4 angular orientations: 0°, 45°, 90°, and 135°. The final feature matrix was compiled by averaging these extracted features [9].
This feature matrix transformation allowed the mammographic images to be converted into numerical data, which can be further utilised for subsequent analysis and classification tasks.
To refine the feature set, the correlation matrix was examined and features with a correlation above 0.90 were eliminated, ensuring that the selected features were not highly correlated. This process of feature selection was based on the principle of avoiding redundant or highly correlated variables.
The classification performance of each selected feature was then evaluated using the area under the curve (AUC) metric obtained from receiver operating characteristic (ROC) analysis. This step allowed the most informative features for training the classifier models to be identified.
For training the classifier methods, a set of 9 features was ultimately selected. Figure 4 provides a summary of the 4 different angular directions (0°, 45°, 90°, and 135°) used for the GLCM and GLRLM matrix calculations.
Classification
The numerical data obtained from the image processing and feature extraction steps were utilised as input variables for various classification methods in this study. A two-stage classification process was conducted. In the first stage, the lesion images were classified as either normal or abnormal tissue. In the second stage, the abnormal tissues were further classified as either malignant or benign.
For the classification tasks, a dataset of 322 images from the left and right breasts, obtained from the mini-MIAS database, was employed. The dataset was divided into 70% for training and 30% for testing purposes. The classification models were developed using the following techniques: random forest (RF), k-nearest neighbour (k-NN), support vector machine (SVM), artificial neural network (ANN), decision tree (DT), and naive Bayes (NB). The models were trained and evaluated using the leave-one-out cross-validation (LOOCV) procedure. The performance of the classification models was assessed based on various evaluation metrics, including specificity, sensitivity, accuracy, the area under the ROC, AUC, and the F1 score [24].
Results
A dataset of 322 mammography images from 161 patients, obtained from the mini-MIAS database, was utilised in this study. To prepare the images for further analysis, various preprocessing techniques were applied. This process involved eliminating extraneous information like tag data, digitisation artifacts (e.g. straight lines), and noise that were present in the original MIAS database images.
The specific preprocessing methods employed were a combination of image sharpening with an unsharp masking filter, image smoothing using a median filter, and contrast enhancement using the CLAHE algorithm.
After the preprocessing step, the k-means clustering algorithm was then applied to extract the regions of interest (ROIs) from the mammography images. A total of 33 features were extracted from the ROI samples using the GLRLM and GLCM techniques. To refine the feature set, the correlation matrix of these features was examined, and any variables with a correlation of 0.90 or above were eliminated because this indicated a high degree of redundancy among the features.
The selected features are summarised in Table 1. The average AUC values for all features across different preprocessing algorithms, including CLAHE, MF combined with CLAHE, MF combined USM, CLAHE combined with USM, and MF combined with CLAHE and USM, were also calculated. The average AUC values ranged from 0.746 to 1.000, indicating that some individual features performed very well on their own in terms of classification performance.
Table 1
Compilation of nine features identified through correlation coefficient analysis
The classification results of normal and abnormal tissue, using the analysed dataset, are shown in Table 2. When the CLAHE algorithm was employed as the sole preprocessing method, it had a relatively low impact on the classification performance. In contrast, the combination of MF and CLAHE algorithm improved the classification performances. Comparing the CLAHE + MF and USM + MF (unsharp masking) combinations, the CLAHE + MF approach demonstrated higher AUC values, except for the k-NN classification method. Furthermore, the USM + CLAHE preprocessing combination achieved higher classification performances compared to the single and other double combinations.
Table 2
Evaluation of classification techniques based on pre-processing algorithms for distinguishing abnormal and normal cases
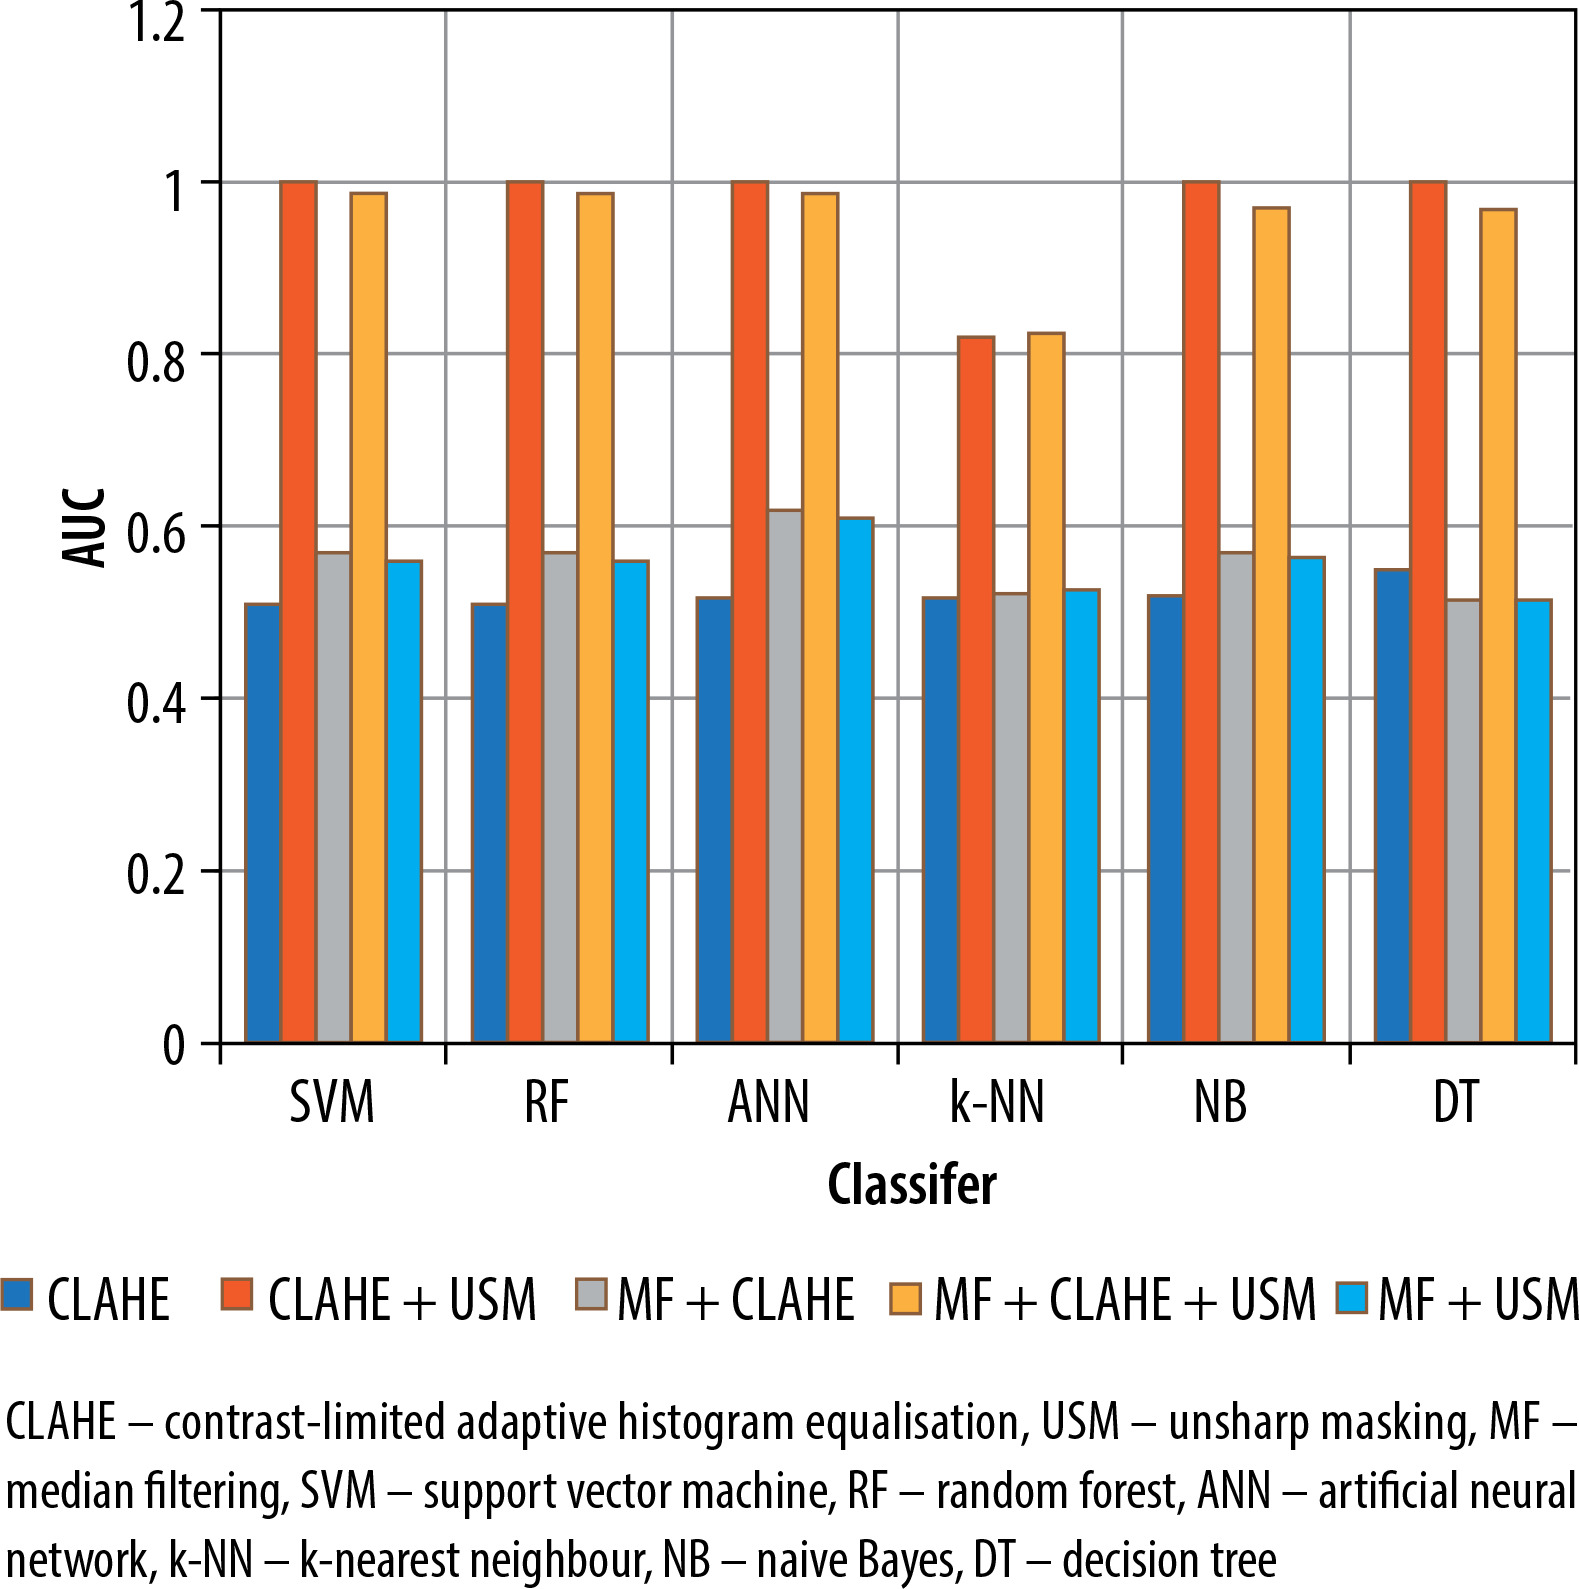
When all 3 preprocessing methods (MF, CLAHE, and USM) were used together in the USM + CLAHE + MF combination, the classification performances were comparable to those obtained with the USM + CLAHE preprocessing approach. Regarding the overall sensitivity, accuracy, F-measure, and AUC, the NB, RF, ANN, SVM, and DT classification techniques demonstrated superior performance compared to the k-NN method. Additionally, Figure 5 displays a graph illustrating the AUC values for the 6 classification methods across 5 different preprocessing combinations.
Figure 5
Contrasting the effectiveness of classification methods using AUC values across various pre-processing combinations for distinguishing abnormal and normal categories
The results of the malignant and benign tissue classification were shown in Table 3. Similar to the abnormal/normal classification, the employment of the CLAHE algorithm solely as a preprocessing step led to poor performance of the classification methods.
Table 3
Assessment of classification techniques based on pre-processing algorithms for discriminating between malignant and benign classifications
However, when the MF was combined with CLAHE (CLAHE + MF) for the malignant/benign classification, the performance of the classification methods improved compared to using CLAHE alone.
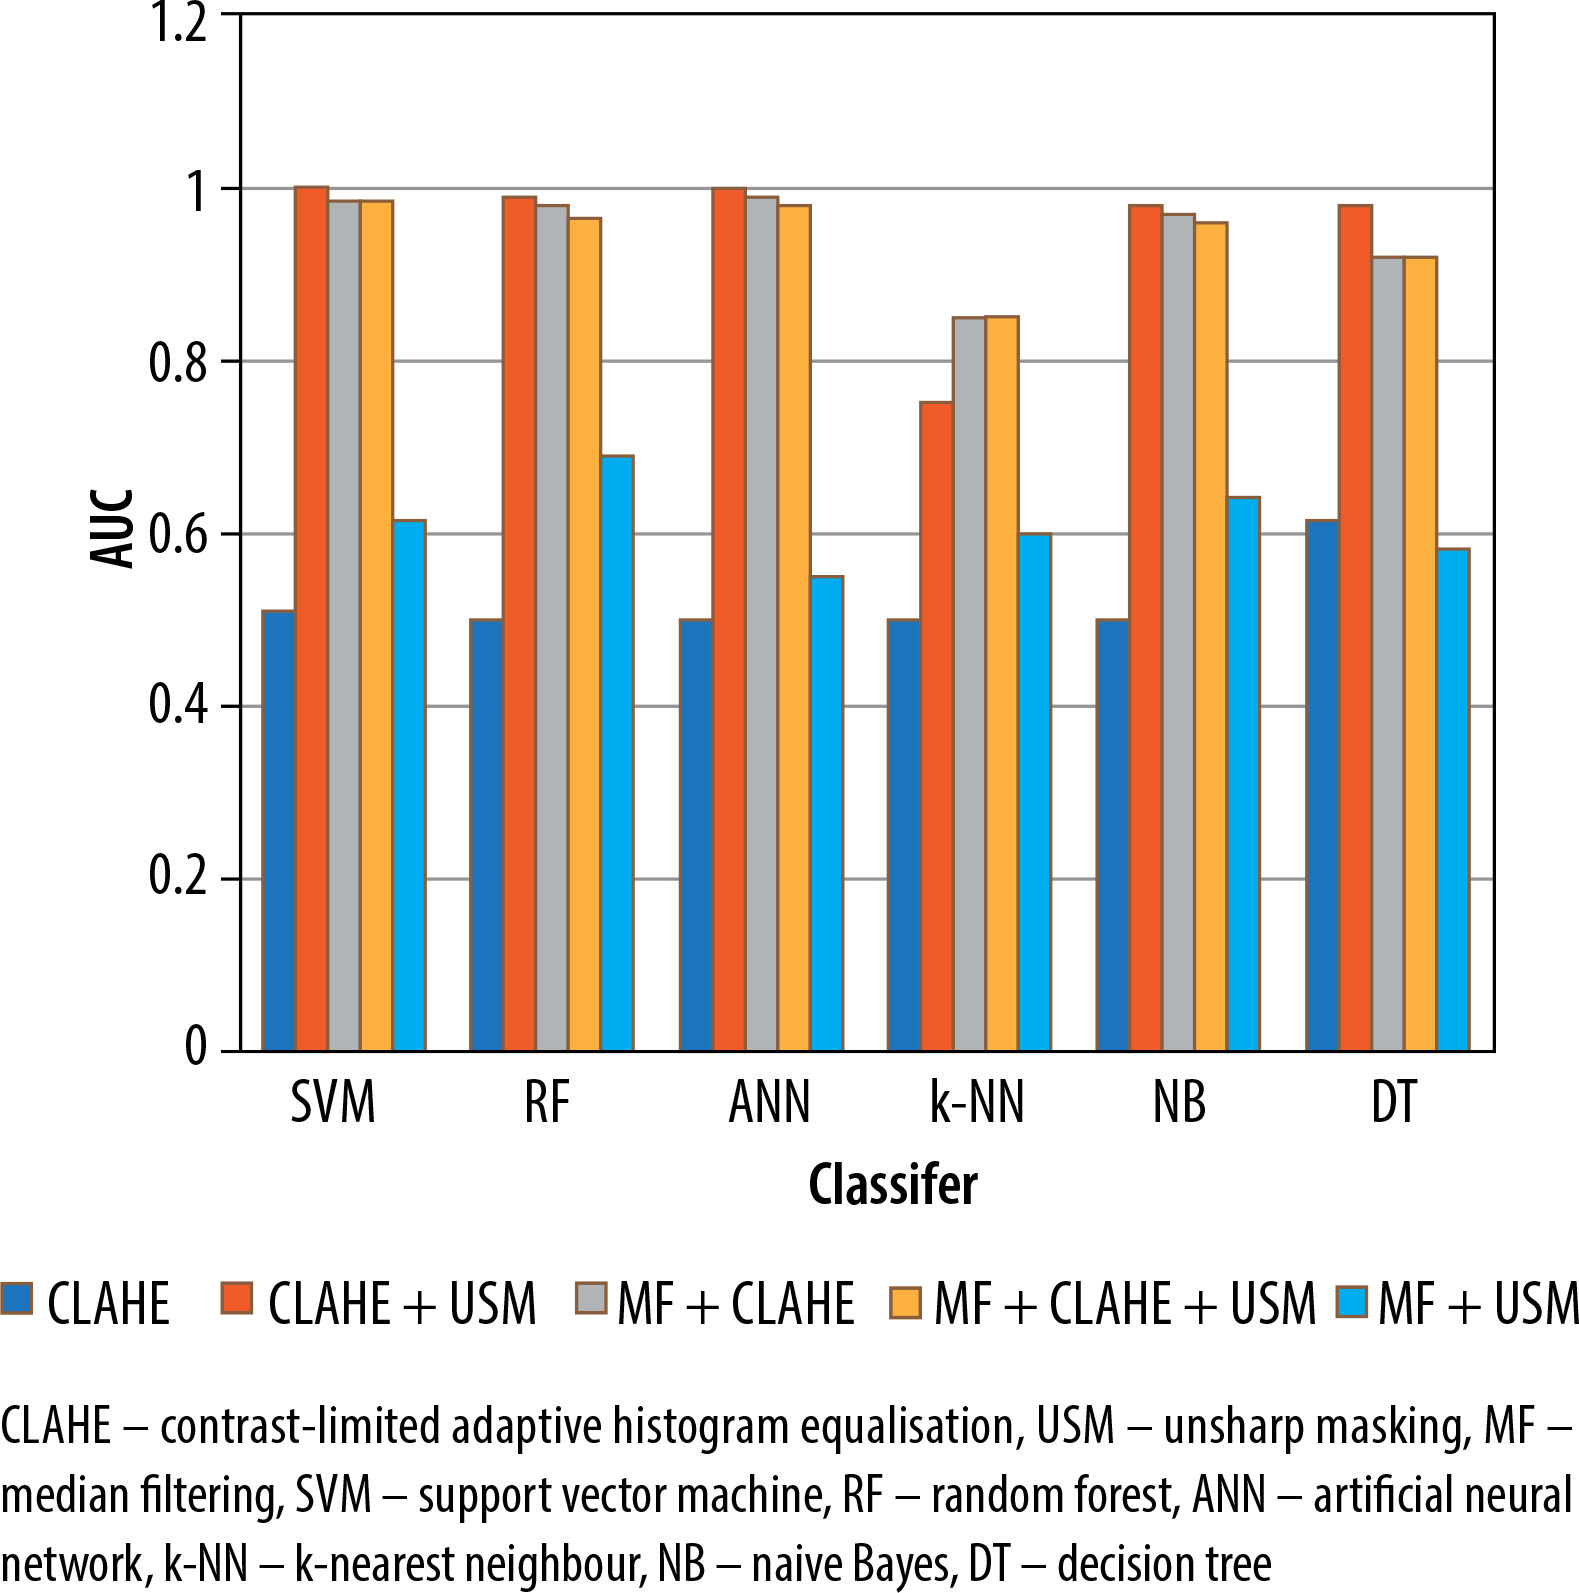
Compared to using CLAHE alone, the performance of the classification methods improved when the preprocessing combinations were employed. Among the preprocessing approaches, the USM + CLAHE combination provided the best classification results. The CLAHE + MF combination yielded the highest classification performances, outperforming the USM + MF combination. When all 3 preprocessing methods (MF, CLAHE, and USM) were utilised in the USM + CLAHE + MF combination, the classification results were slightly lower than those achieved with the USM + CLAHE approach.
In terms of overall accuracy, sensitivity, AUC, and F-measure, the classification methods NB, ANN, RF, SVM, and DT outperformed the k-NN method. Figure 6 presents a graph illustrating the AUC values across 5 distinct preprocessing combinations and 6 classification techniques used for malignant/benign classification.
Discussion
The use of computer-aided systems for the detection of suspicious areas in mammography images has been extensively investigated over the past 2 decades. The existing literature emphasises the crucial importance of the preprocessing step in the segmentation and feature extraction processes for identifying suspicious regions.
Among the commonly used preprocessing methods are unsharp masking, CLAHE (contrast limited adaptive histogram equalisation), and median filtering [7,8,17]. Occasionally, other techniques such as mean filtering, Sobel gradient, and Gaussian filtering have also been employed as preprocessing algorithms [22].
In most previous studies, preprocessing algorithms have been used either individually or in pairs. However, the specific scenarios explored in the current study do not have any direct parallels in the existing literature. This study was designed to investigate the effects of using different combinations of preprocessing methods on the performance of various classification algorithms.
In a previous study, Al-Najdawi et al. [8] used Gaussian filtering, median filtering, and CLAHE as preprocessing methods. They applied these 3 filtering techniques, both individually and in pair-wise combinations, to mammography images acquired using MLO and craniocaudal (CC) views. Their performance measures included a specificity of 94.4% and a sensitivity of 96.2%. In the current study, in addition to the median filter and CLAHE preprocessing algorithms, the effects of incorporating unsharp masking as a preprocessing method were explored. This was a departure from the approaches taken in the existing literature.
In a previous study, Tiedeu et al. [25] developed a contrast enhancement algorithm called CEI (i, j) and used Gaussian filtering to smooth the original mammography images. They then applied adaptive thresholding segmentation to extract ROI samples and computed moment-based geometric features. This approach resulted in a sensitivity of 100% and a specificity of 87.77%. Nineteen features were extracted by Mohanty et al. [26] using GLRLM and GLCM techniques, and they classified them using the C5.DT algorithm. They achieved an accuracy of 93.6% and an AUC of 99.5%. Punitha et al. [10] extracted 45 features using GLRLM and GLCM and classified them using a feed-forward backpropagation neural network. They reported a sensitivity of 98.1% and a specificity of 97.8%. In the current study, it was found that when using the USM + CLAHE + MF and USM + CLAHE algorithms for abnormal/normal tissue classification, and the USM + CLAHE + MF, USM + CLAHE, and CLAHE + MF algorithms for malignant/benign tissue classification, the highest AUC value of 1.00, a sensitivity of 1.00, and a specificity of 1.00 were achieved for the 9 features obtained using GLCM and GLRLM techniques.
While the previous studies primarily reported sensitivity and specificity, the AUC values, which provide a combined measure of the classification performance, were also chosen to be interpreted in the current study.
The existing literature suggests that the SVM algorithm often yields strong performance results [9,18]. In the current study, it was found that the SVM, RF, and ANN methods generally outperformed k-NN, NB, and DT algorithms, particularly when using the USM + CLAHE + MF and USM + CLAHE preprocessing combinations.
In the current study, it was found that for the abnormal/normal tissue classification task, the USM + MF, CLAHE + MF, and CLAHE preprocessing combinations resulted in relatively low performance measures. In contrast, for the malignant/benign tissue classification task, the USM + MF and CLAHE preprocessing combinations showed higher performance.
Notably, the USM + CLAHE + MF and USM + CLAHE algorithms exhibited exceptionally high classification performance measures. This high performance is not considered to be an overfitting issue because it was observed that the GLRLM-based features, such as long-run emphasis, long-run low grey level, and short-run emphasis characteristics, also had very high AUC values.
In general, the obtained features demonstrated high performance. According to the existing literature, it is uncommon but possible to achieve extremely high-performance results from image processing techniques [27].
Existing research has shown that the median filtering method is particularly effective at reducing salt and pepper noise in heavily distorted images [8]. Therefore, in future studies, it is suggested that salt and pepper noise should be added to normal images and then the CLAHE MF preprocessing method should be applied. This would allow the investigation of the classification performance for distinguishing abnormal and normal tissue textures, as the choice of preprocessing technique can vary depending on the type of noise present in the images [28].
The current study utilised a dataset of 322 mammography images obtained from 161 individuals, which was sourced from an open-access database. The proposed algorithms could potentially be applied to larger datasets as well. Additionally, it is suggested that future studies could compare the classification performance of various deep learning models, such as DenseNet, AlexNet, and VGG 16, when working with a greater number of mammography images [29].
The specific type of breast cancer can be influenced by the particular cells within the breast that undergo the cancerous transformation [30]. In the current study, access to information about the breast cancer types or phenotypes in the mini-MIAS dataset utilised was not available. However, it is suggested that in future studies the classification performance of the algorithms could be investigated for different breast cancer subtypes, provided that the necessary data and information are available.
Conclusions
The appearance of masses on mammography images can be indicative of malignant, benign, or normal conditions, based on the cells’ morphology. Before applying image processing algorithms to identify potentially suspicious areas in mammography images, it is necessary to improve the overall quality of the images.
This research involved applying multiple preprocessing techniques to eliminate extraneous elements and noise, including tag information, from mammography images. Furthermore, the study assessed the effectiveness of different data mining methods by comparing their classification performance with the various preprocessing strategies employed.
The findings indicated that using the CLAHE algorithm on its own for preprocessing led to poorer classification results than various other preprocessing combinations. Nevertheless, for the task of distinguishing abnormal from normal tissues, the USM + CLAHE and USM + CLAHE + MF methods outperformed the other preprocessing combinations. Likewise, in the task of classifying malignant versus benign tissues, the CLAHE + MF, USM + CLAHE, and USM + CLAHE + MF methods exhibited superior classification performance compared to the other preprocessing strategies.
Based on the results of the study, it appears that the classification methods of artificial neural network, random forest, SVM, decision tree, and naive Bayes generally outperformed the k-NN algorithm in both the normal/abnormal and malignant/benign tissue classification tasks. This suggests that these machine learning models were more successful in accurately categorising the mammography image data compared to the k-NN approach.
The findings of this study have led to the identification of the most suitable preprocessing algorithm combination that achieves high classification performance for mammography images. This optimal preprocessing approach is proposed because it is found to have a significant influence on the overall effectiveness of the subsequent image processing steps.