Introduction
The recent pandemic outbreak of the novel severe acute respiratory syndrome coronavirus 2 (SARS-CoV-2) poses an increasing challenge to healthcare systems worldwide. Apart from an early detection of the resulting coronavirus disease 2019 (COVID-19), efficient and fast identification of patients at risk of severe disease progression is crucial for triage and successful patient treatment. In many hospitals, computed tomography (CT) is used to quickly identify patients with suspected COVID-19 [1,2]. Although CT is not as accurate as reverse transcription polymerase chain reaction (RT-PCR) of throat or deep nasal swaps, it may enable faster results than RT-PCR and might thus help to detect affected patients earlier, isolate them in time, and initiate further treatment. Furthermore, CT is also important for disease follow-up [3]. In addition to the detection of pulmonary infiltrates, CT also allows for an evaluation of the unaffected lung parenchyma and identification of additional comorbidities such as emphysema or fibrosis.
Several studies have recently been conducted to identify risk factors for severe progression of COVID-19 with treatment in the intensive care unit (ICU) and the potential need for invasive ventilation and/or even extracorporeal membrane oxygenation [4-7]. Among those risk factors, emphysema, and chronic obstructive lung disease were described as particularly relevant [4,8,9].
The use of CT for lung density analysis is already established and superior to subjective visual assessment [10,11]. Early quantification of reduced lung density as a correlate of emphysema based on routinely acquired chest CT images could therefore be useful in identifying patients at risk of severe disease progression. Therefore, this study aims to investigate the association between CT-based measurements of lung density and COVID-19 severity.
Material and methods
Data for this retrospective study were collected from non-contrast low-dose chest CTs, routinely acquired between March 2020 and April 2020. We included patients who presented at the emergency department of our institution and in whom SARS-CoV-2 was confirmed by RT-PCR. This study was approved by the institutional review board (EA 4/140/17).
Computed tomography imaging protocol
Patients were positioned in supine position and asked to hold their breath in deep inspiration during image acquisition. Two different types of scanners were used at our institution, an 80-slice scanner (Aquilion Prime, Canon Medical Systems Cooperation, Otawara, Japan) and a 64-slice scanner (Lightspeed VCT, General Electric, Boston, Massachusetts, United States), to perform a low-dose examination of the chest in patients with suspected SARS-CoV-2 infection. The imaging protocol for the Canon Aquilion Prime was as follows: 0.27 s rotation time, 100 kV tube voltage, automatic modulation of tube current between 10 and 100 mA, a noise index of 27, pitch factor of 1.388, and a reconstructed slice thickness of 0.5 mm. For the GE Lightspeed VCT, rotation time was 0.35 s, 100 kV tube voltage, automatic tube current modulation between 10 and 100 mA, noise index of 30, pitch factor of 1.375, and a reconstructed slice thickness of 0.625 mm. Image reconstruction was performed using a lung- and soft-tissue kernel (Canon Aquilion Prime: Fc01 and Fc85, GE Lightspeed VCT “standard” and “lung”) and moderate iterative reconstruction.
Data acquisition
Lung density measurements were performed using Vital’s Vitrea™ Advanced Visualisation applications (Canon Medical Systems Cooperation, Otawara, Japan). The whole lung was quantified based on predefined thresholds: Lung tissue with densities between –1024 and –920 Hounsfield units (HU) was defined as low density, between –920 and –720 HU as medium density, and lung tissue between –720 and 0 HU as high density. Data were then exported as structured text files for further analysis.
Follow-up chest radiographs were used to obtain clinical outcome data. By identifying the referring ward in our radiology information system, we identified patients requiring ICU treatment; the need of invasive mechanical ventilation was assessed through interpretation of chest radiographs. Further patient characteristics such as weight or height, sex, or age were stored in tabular form as comma- separated values.
Statistical analysis
Statistical analysis was performed with the “R” statistical programming language and the “tidyverse” library [12,13]. Due to the small sample size, all variables were expressed as median and interquartile range (IQR). The Wilcoxon rank sum test was used to compare two groups of variables. A multivariate linear regression analysis, corrected for age and sex, was conducted to calculate odds ratios for lung density measurements with mechanical ventilation and ICU treatment as outcome parameters. A p-value of < 0.05 was considered statistically significant.
Results
In this retrospective study, 30 chest CT images of patients with COVID-19, confirmed by RT-PCR, were analysed. The average age was 67.85 IQR: 14.73 years. 57% of the patients (n = 17) were male (average age 67.2 IQR: 15.6 years) and 43% (n = 13) were female (70.6 IQR: 15.5 years). During treatment at our site, 43% (n = 13) of patients had to be transferred to the ICU. 23% of all patients (n = 7) also required mechanical ventilation at some point during their stay in the hospital. None of the patients was mechanically ventilated at the time of the CT scan. Table 1 gives an overview of the patient characteristics.
Table 1
Distribution of patient characteristics
Lung density and requirement of intensive care treatment
Patients requiring treatment on the ICU had significantly lower overall lung volume compared to patients on the normal ward (22.22 IQR: 13.98 dl vs. 31.16 IQR: 9.99 dl) (p = 0.003). Surprisingly, patients on the ICU showed a lower proportion of medium- and low-density lung volume compared to patients on the normal ward (medium-density volume: 18.13 IQR: 6.76 dl vs. 27.92 IQR: 10.4 dl, p = 0.012; low-density volume: 3.14 IQR: 5.73 dl vs. 6.92 IQR: 2.61 dl, p = 0.014). Regarding high-density lung volume, patients on the ICU showed a significantly higher proportion of high-density lung volume compared to patients on the normal ward (11.96 IQR: 3.62 dl vs. 7.21 IQR: 4.4 dl, p = 0.007). There was no sex-specific difference between low-, medium-, or high-density volume (p-values 0.45 and 0.89). The photodiode (PD) 15 (15th percentile of lung density) was lower for normal ward patients (62 IQR: 52 g/l) compared to ICU patients (93 IQR: 22 g/l), indicating an overall lower lung density of patients on the normal ward. Figure 1 and Table 2 give an overview of lung density and requirement of ICU treatment.
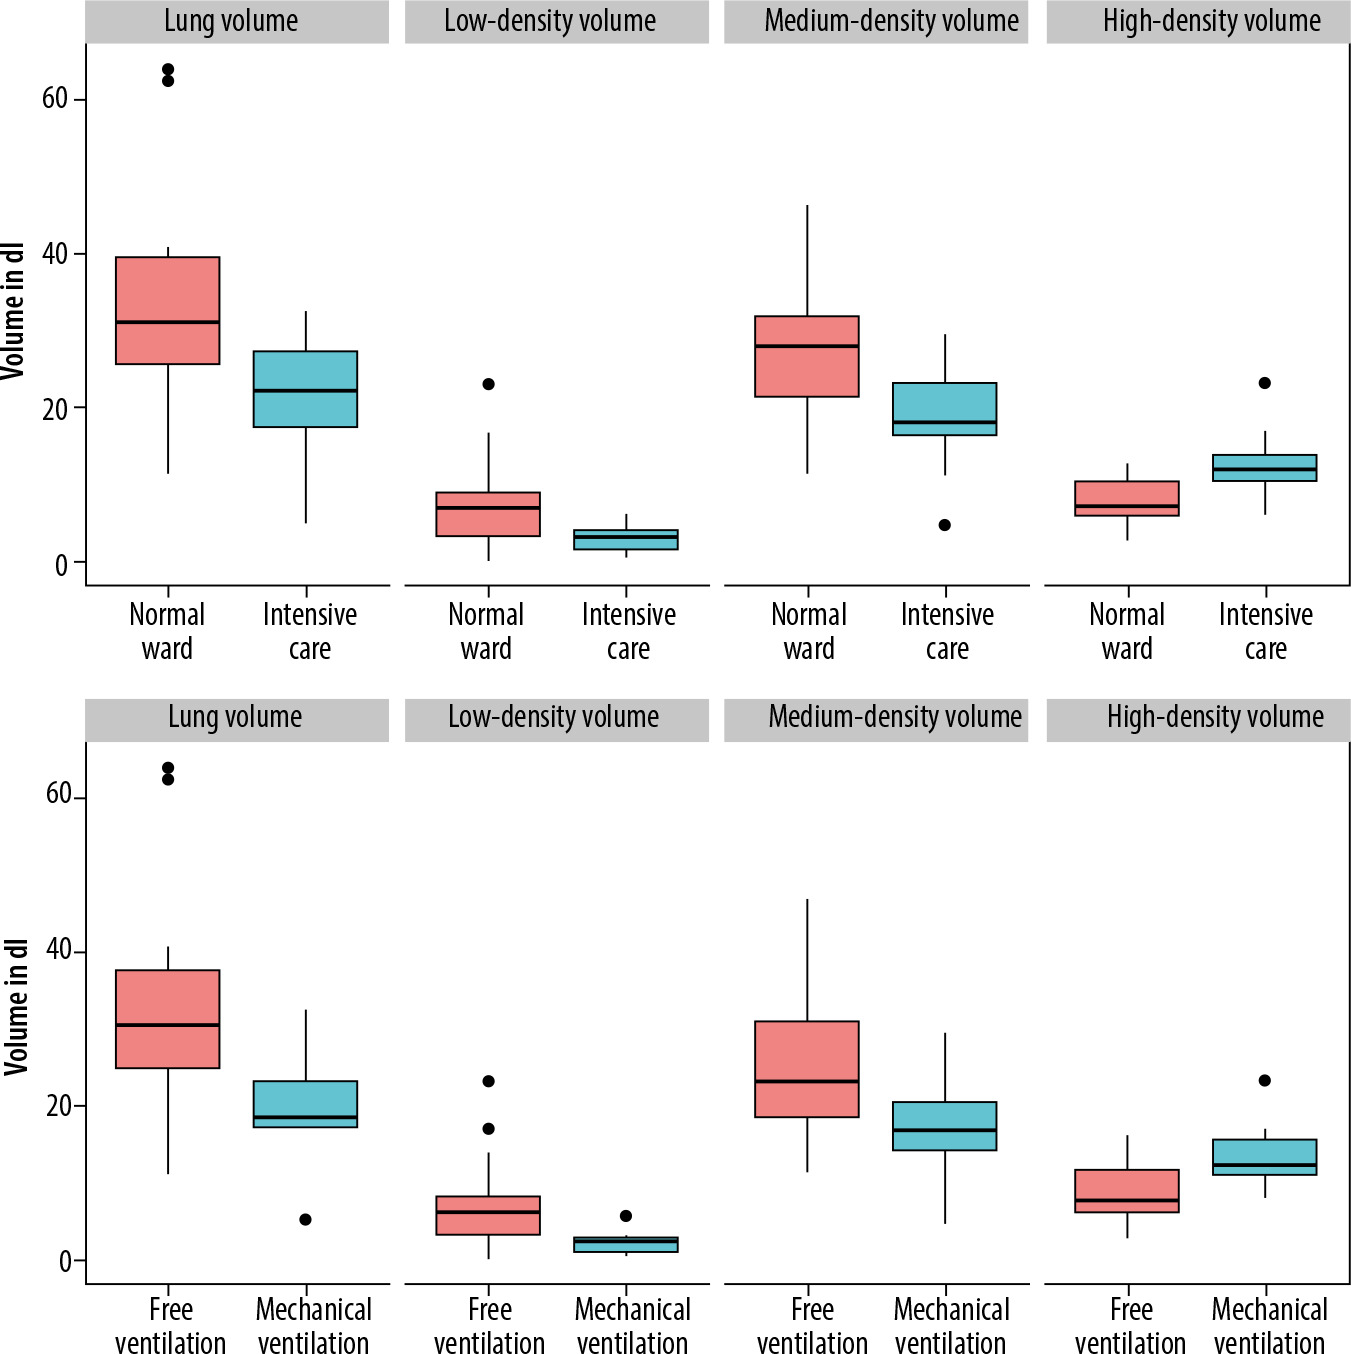
Table 2
Distribution of lung density measurements in normal ward and intensive care unit
Lung density and requirement of mechanical ventilation
Out of 11 patients requiring invasive ventilation during treatment of COVID-19, only one patient was female. Therefore, no subgroup analysis was performed to compare male and female patients. Patients who later required mechanical ventilation had a lower initial total lung volume of 18.42 IQR: 12.6 dl compared to patients breathing freely (30.4 IQR: 5.96 dl, p = 0.012). There was also a significant difference in low-density volume between the two groups (5.98 IQR: 1.7 dl vs. 2.22 IQR: 5.01 dl, p = 0.019); however, the percentage of low-density volume in relation to overall lung volume was not significantly different (19% vs. 12%, p = 0.13). The high-density volume was significantly larger in patients who required invasive ventilation during hospitalisation (7.51 IQR: 5.39 dl vs. 12.26 IQR: 4.65 dl, p = 0.039). PD15 was lower in freely breathing patients (71 IQR: 33.5 g/l) than in mechanically ventilated patients (96 IQR: 20.5 g/l), but this difference did not reach the predefined significance level (p = 0.41). Figure 1 and Table 3 give an overview on lung-density and the requirement of ICU treatment.
Table 3
Distribution of lung volumes in freely breathing and mechanically ventilated patients
Influence of lung-density on requiring intensive care treatment or invasive ventilation
In a multivariate regression analysis, adjusted for age and sex, different measurements for lung density were analysed to determine how they affect the probability of a patient requiring treatment in the ICU and/or mechanical ventilation. Because patients on the ICU showed a lower overall lung volume, an increase of lung volume from 20 dl to 30 dl would be associated with a 26% lower risk for requiring intensive care treatment. On the other hand, an increase in high-density volume from 10 dl to 20 dl led to a 48% increased risk for treatment on the ICU. However, the 95% CI for all measurements except high-density volume showed odds below and above 1; hence, no clear positive or negative influence of the measured values could be determined with certainty. Table 4 gives an overview of odds ratios derived from logistic regression analysis.
Table 4
Overview of the calculated odds ratios
Discussion
In this study, we investigated whether quantification of lung density based on CT images would correlate with the severity of COVID-19. Our hypothesis was that patients with emphysema and subsequently reduced lung density were at increased risk of developing a more serious infection and would therefore require treatment on the ICU and/or invasive ventilation. However, this hypothesis could not be confirmed. Instead, only higher lung density was associated with severe COVID-19, probably resulting from an increased proportion of pulmonary infiltrates.
It is likely that patients with chronic obstructive pulmonary disease (COPD) might suffer from more severe disease progression. Leung et al. stated that this might be due to poor lung reserves in the case of infection and an overexpression of the ACE-2 receptor, which plays an important role as an entry receptor for the fusion of SARS-CoV-2 and airway epithelia [14,15]. A recent meta-analysis by Zhao et al. found a fourfold higher risk of developing severe COVID-19 in COPD patients, and an even more elevated risk for COPD patients remaining active smokers [16]. In addition, earlier studies have shown that acute exacerbation comes with an increased risk of cardiovascular events, further deteriorating the patients’ prognosis, which might be another important risk factor in specific COPD phenotypes with frequent exacerbations [17]. However, further research regarding the association between COVID-19 progression and COPD-phenotypes (e.g. with predominant emphysema or asthma overlap) are needed because the currently available literature is sparse.
Previous studies aimed to identify patients with emphysema and COPD, at risk for severe COVID, using CT. Lyu et al. previously investigated the performance of chest CT for the identification of critical cases [18]. They observed 51 patients and found both a higher lung density (defined by > 779 HU) and a reduced volume of the medium-density lung in critically ill patients (n = 24) [18]. While we also observed a higher lung density in critically ill patients (defined by 720–0 HU), we found an increased volume of medium-density lung in severely affected patients. Colombi et al. demonstrated that a decrease in well aired lung tissue corresponded to a higher likelihood of transmission to the ICU or death [19]. Yu et al. analysed the distribution, size, and density of ground glass opacities in patients affected with COVID-19 [20]. They were able to show that an increase in the size and density of infiltrations corresponded to a worse clinical outcome [20]. This is also consistent with our observations that larger areas of opacification lead to an overall increase in the volume of high-density lung tissue. Ground class opacities are a typical CT sign of viral infection, including COVID-19 [21]. The pathophysiological correlation with ground glass opacities is either interstitial oedema and/or incomplete filling of the alveolar space with fluid [22]. As a result, the overall density of the lung tissue increases.
Compared to lung-density values reported in literature for lung-healthy patients, the population of this study showed a normal distribution of low-density lung percentage and no higher prevalence of emphysema compared to the normal population. Cheng et al. analysed 2351 lung-healthy patients for lung density on CT and found a low-density percentage of 17–19% [23], comparable to the values reported in Table 1. It is therefore possible that in a patient population with lung disease and a significantly higher proportion of emphysema, CT-based quantification and analysis of low-density lung-volume could still be useful to model the severity of COVID-19. Another confounder and thus limitation of the present study results from the fact that patients severely affected by COVID-19 were unable to hold their breath properly and/or breathe in deeply during the CT examination, possibly causing the lower overall lung volume of patients in the ICU and/or with mechanical ventilation. It is also possible that a larger lung volume allowed patients to tolerate larger areas of pulmonary infiltrates, before the lung volume required for gas exchange became too small. Furthermore, other factors, such as increased intra-abdominal pressure in obese patients, might also have contributed to the reduction in lung volume.
If the lung parenchyma expands during deep inspiration, the overall lung density decreases [24,25]. This could also explain why, contrary to our previous assumptions, the lung density as well as the percentage of low-density lung in less severely ill patients tended to be lower. In line with this, PD15 did not change between both groups, suggesting different depth of inspiration.
Furthermore, it is possible, that patients with severe emphysema, but also with severe infection and large pulmonary infiltrates, may have shown falsely high lung density values. The inclusion of confirmatory spirometry for assessing lung volume would have been desirable for validation of the measurements obtained from CT. However, having all patients with COVID-19 undergo spirometry was not possible because of hygiene regulations and the often poor condition of the patients.
Additional limitations of the present work include the retrospective design and the small sample size. Finally, because many patients were still hospitalised at the time of analysis, further endpoints such as the duration of ICU treatment or intubation could not be evaluated. It should also be emphasised that lung density is not the only risk factor for severe COVID-19, but rather one of many risk factors, some of which have been identified as particularly important. One of these risk factors is obesity; it was shown that an increased body mass index or increased areas of visceral fatty tissue was associated with more severe COVID-19 [26,27]. Another important risk factor is ethnicity; it was observed that especially Black and Indigenous Americans were at higher risk for COVID-19 infection, severe disease progression, and death [28]. This underlines that more attention needs to be paid to associations between COVID-19 progression and ethnicity [29]. However, because the population in the present study was predominantly white and the sample size was small, it was not possible to take ethnicity into account.
Conclusions
Contrary to our expectations and to previous research, larger proportions of medium- and low-density lung tissue showed no association with severe course of COVID-19. Only high-density lung was identified as a possible predictor of severe COVID-19, probably due to the higher proportion of pulmonary infiltrates in critically ill patients.