Introduction
Hepatocellular carcinoma (HCC) is a major health problem as it is the fifth most common cancer and the third cause of cancer-related mortality in the world [1]. According to the World Health Organization, it accounts for 80% of all cases of primary liver cancers [2]. It is strongly associated with liver cirrhosis and the most frequent risk factors for its occurrence include chronic viral B and C hepatitis, alcohol intake, and aflatoxin exposure [3].
HCC is a unique tumor in that in high-risk patients its diagnosis may be conducted noninvasively, without performing biopsy, by fulfilling imaging criteria.
To standardize image interpretation, worldwide organizations created strict guidelines for HCC imaging. The American Association for the Study of Liver Diseases uses the Liver Reporting and Data System (LI-RADS) as the method of categorizing liver findings.
The first version of LI-RADS was introduced in 2011 to be later refined in multiple updates [4]. The 2014 LI-RADS update introduced gadolinium based hepatobiliary contrast agents (HBAs) into the diagnostic algorithm [5], namely: gadoxetic acid (GA) (GD-EOB-DTPA, gadolinium ethoxybenzyl diethylenetriaminepentaacetic acid known as Primovist, Eovist) and gadobenate dimeglumine (GD) (Gd-BOPTA, gadolinium benzyloxypropionictetra-acetate, known as MultiHance). These contrast agents act similarly but somewhat differently than conventional extracellular contrast agents (ECAs) in the dynamic phases of imaging. Since ECAs and GD have similar kinetic properties, they produce similar temporal enhancement characteristics over the first few minutes after injection. Compared to the latter, the vascular enhancement of GA declines more rapidly due to its rapid hepatobiliary uptake and excretion [6].
This is why the major LI-RADS criteria differ between these contrast agents. In the case of ECAs and GD the criteria include arterial phase hyperenhancement and non-peripheral washout in the portal venous phase or delayed phase. For GA the criteria include arterial phase hyperenhancement and wash-out in the portal venous phase only [7].
The hepatobiliary phase (HBP) is unique for HBAs. It is obtained approximately 20 min after injection of GA, and 90-120 min after injection of GD [8]. In this phase HBAs are actively absorbed by the OATP1 transporters (polypeptide adenosine triphosphate – dependent organic anion transporters) located on the hepatocyte, which is the same transporter as the one for bilirubin, and are subsequently excreted into the bile [9,10]. In this way, the enhancement of lesions in the HBP depends on the activity of these transporters, i.e. on the presence or absence of functioning, or – in other words – healthy hepatocytes [11].
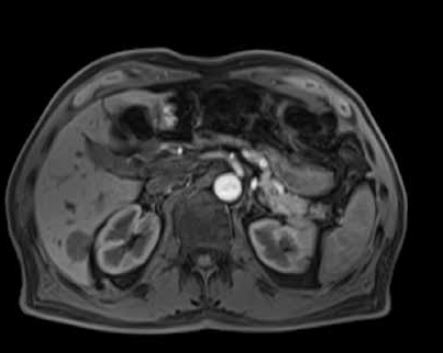
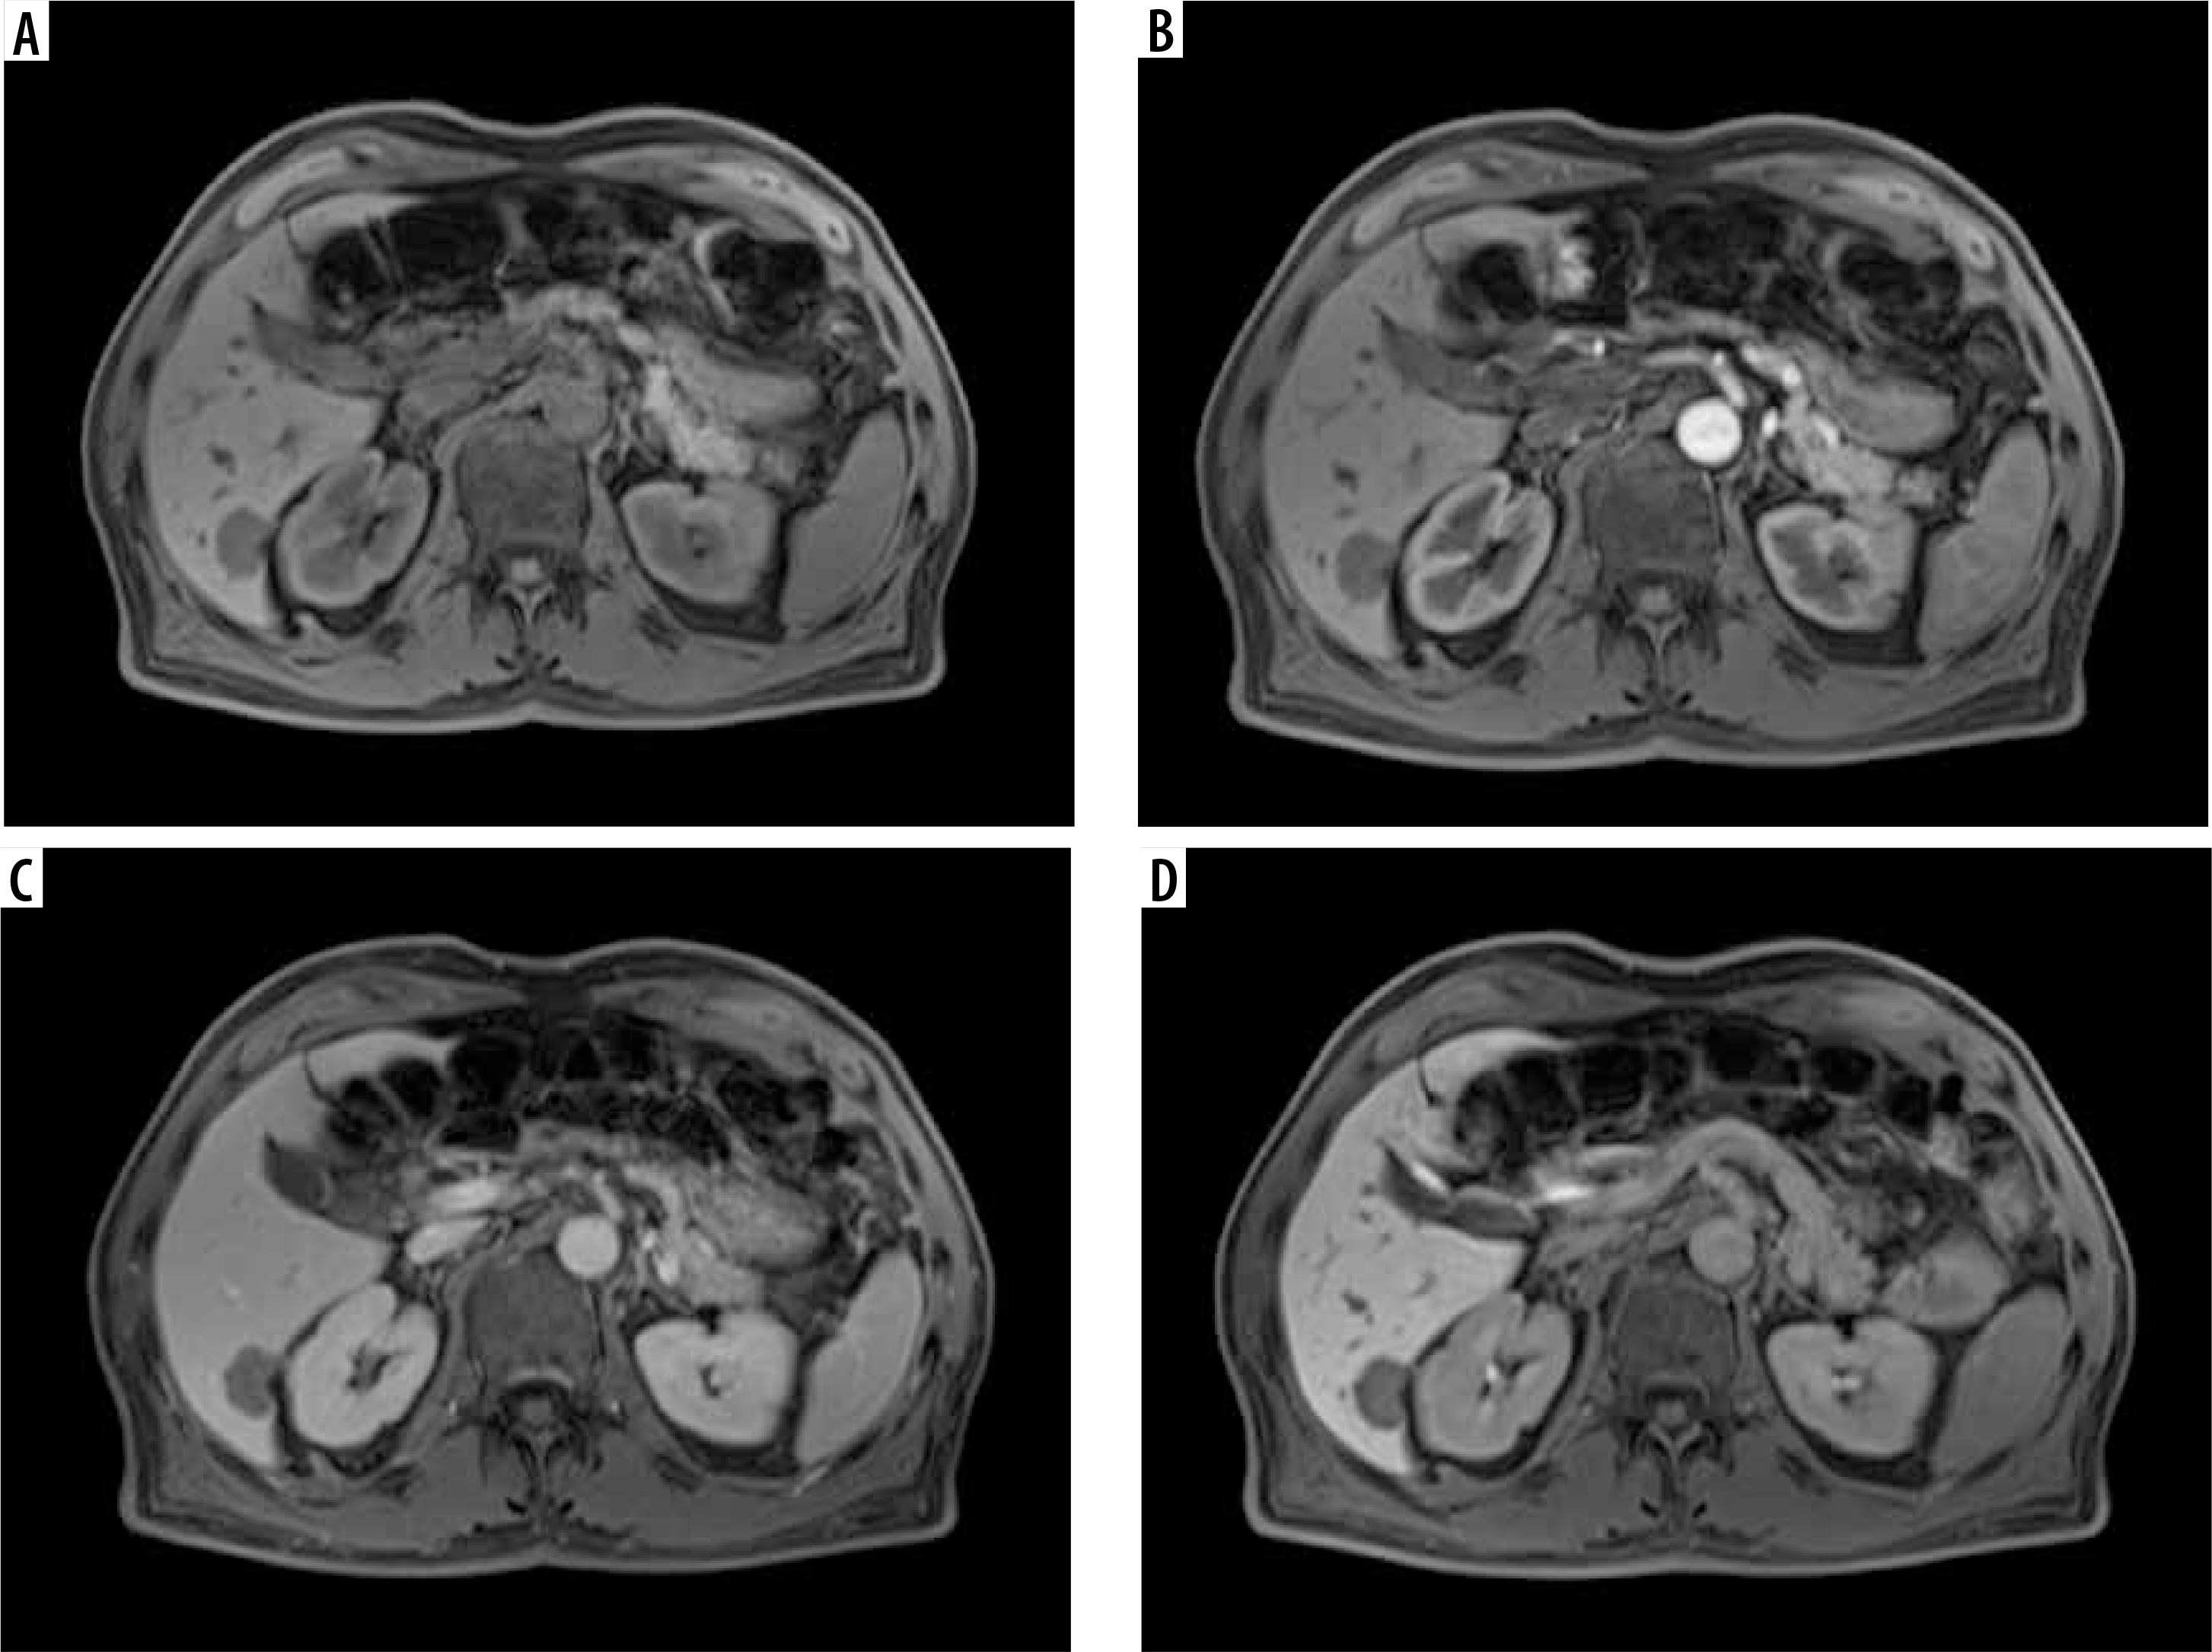
Figures 1-3 present examples of different hepatic tumors in the arterial phase, venous phase and HBP of GA enhanced MRI.
Figure 1
An example of a hypervascular tumor, hepatocellular carcinoma, in gadoxetic acid enhanced magnetic resonance imaging, in the native phase (A), arterial phase (B), venous phase (C), and hepatobiliary phase (HBP) (D). One can see features of enhancement in the arterial phase and features of wash-out in the portal venous phase. No accumulation of contrast is observed in the HBP, which reflects the lack of functional hepatocytes
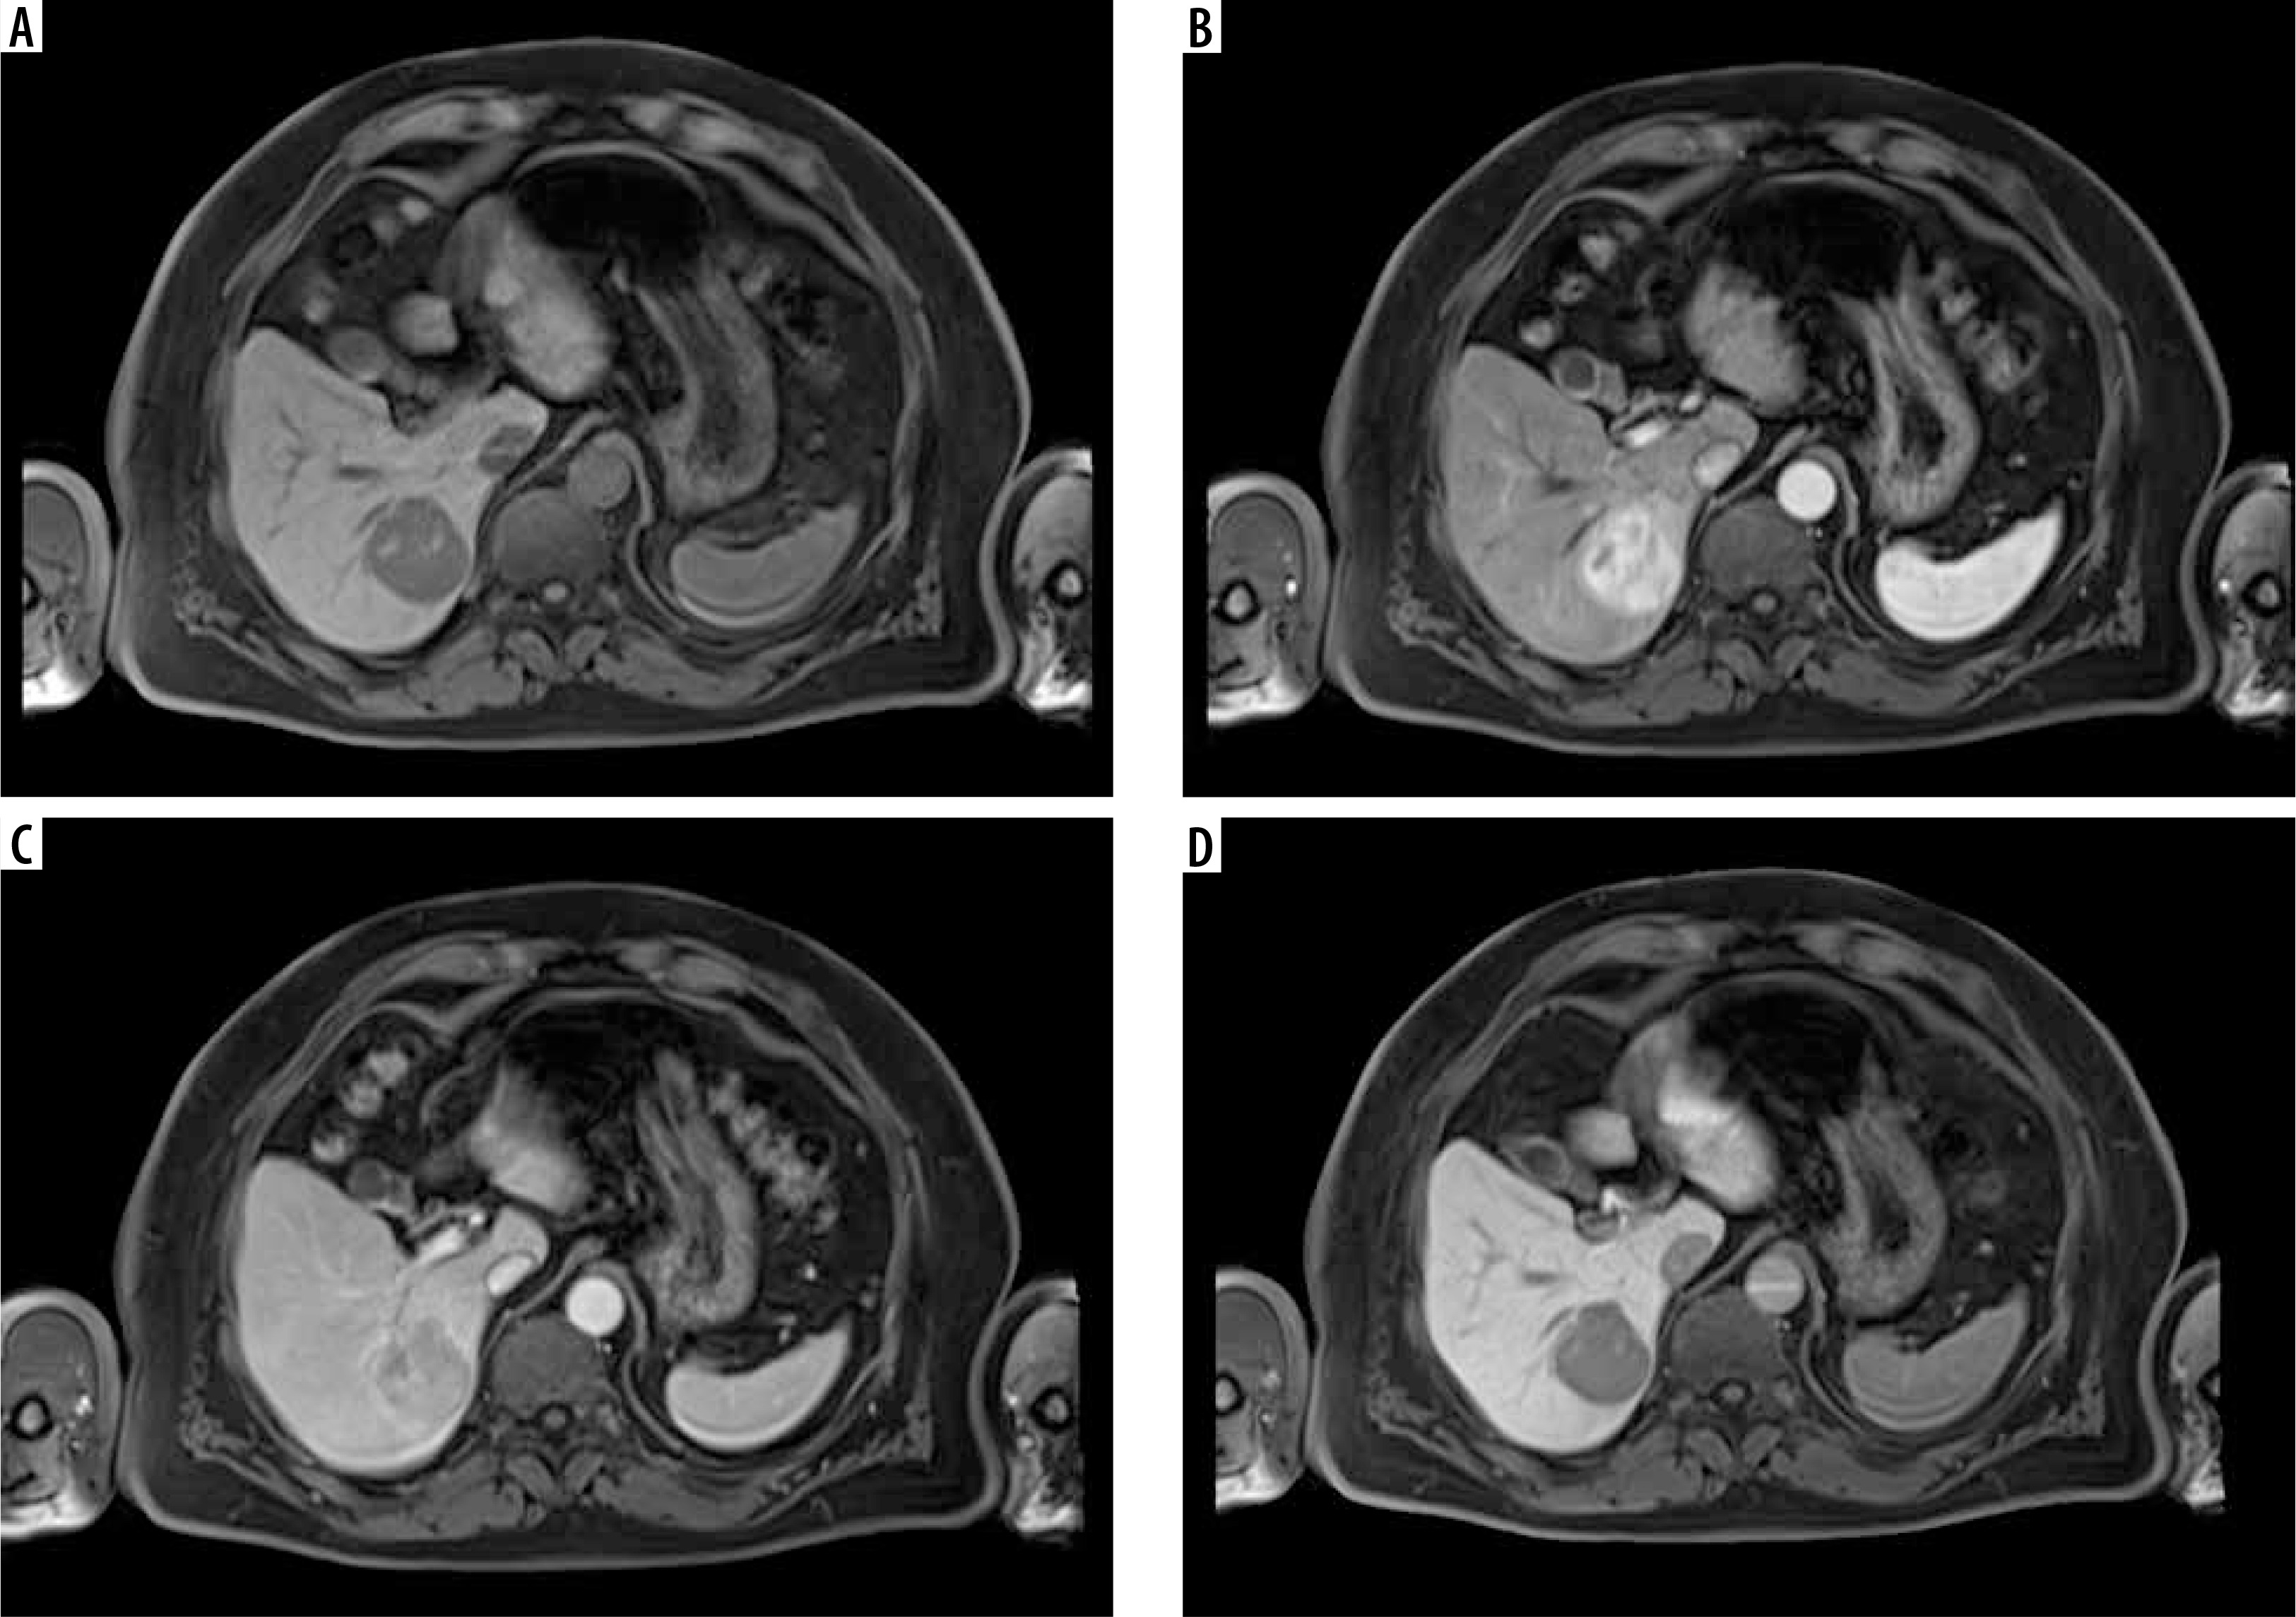
Figure 2
An example of a hypervascular tumor, focal nodular hyperplasia, in gadoxetic acid enhanced magnetic resonance imaging, in the native phase (A), arterial phase (B), venous phase (C), and hepatobiliary phase (HBP) (D). One can see features of enhancement in the arterial phase and no wash-out in the portal venous phase. In the HBP the tumor is hyperintense compared to the liver parenchyma, which is a sign of contrast accumulation by functional hepatocytes
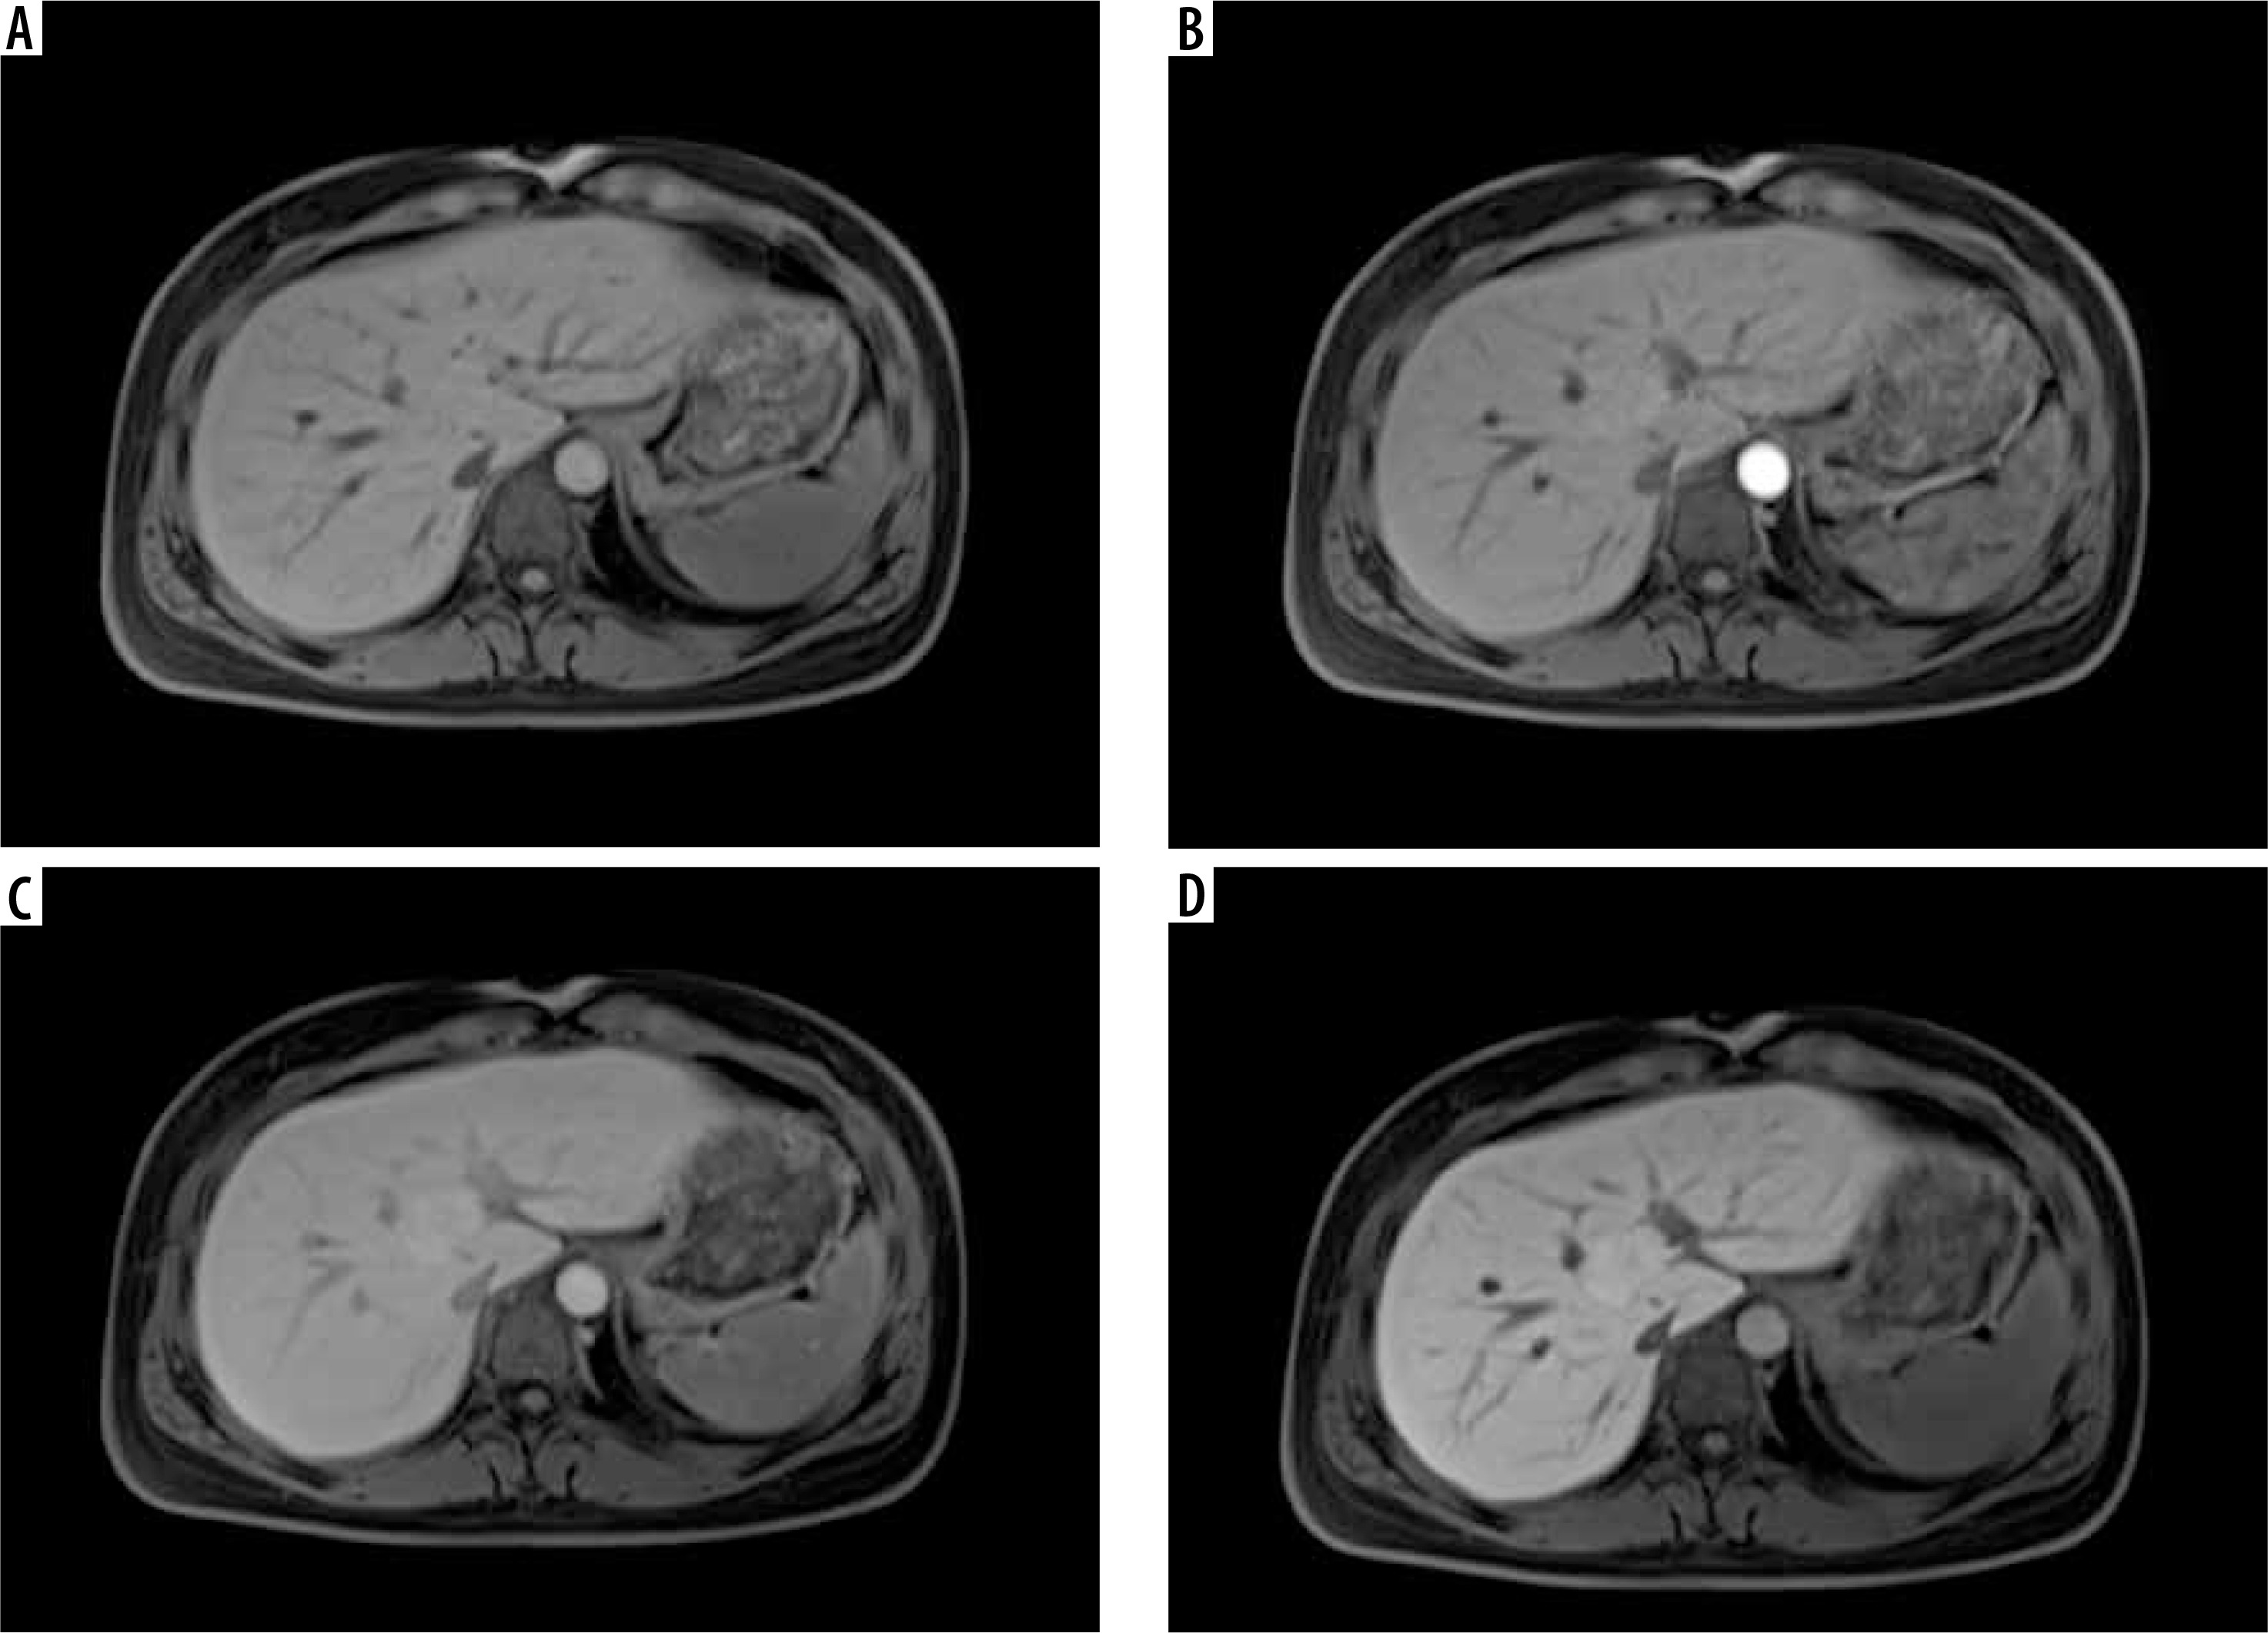
Figure 3
An example of a hypovascular tumor, metastasis, from colorectal carcinoma in gadoxetic acid enhanced magnetic resonance imaging in the native phase (A), arterial phase (B), venous phase (C), and hepatobiliary phase (HBP) (D). One can see no signs of enhancement either in the arterial or in the venous phase. In the HBP, the tumor remains hypointense, which reflects no contrast accumulation due to the lack of functional hepatocytes
Alongside their unique features observed in the HBP, HBAs also demonstrate disadvantages compared to the ECAs. Due to different kinetics the enhancement produced by GA in lesions with large extracellular volume or with large interstitial spaces decreases rapidly compared to enhancement produced by ECAs. This phenomenon is referred to as “pseudo-wash-out” [5] and can be observed in the transitional phase of GA enhanced studies. This is why lesions such as high flow hemangiomas, fibrous parts of a cholangiocarcinoma, or other lesions containing no hepatocytes cannot be determined reliably in the transitional phase with GA [12,13].
Other disadvantages of HBAs include safety issues which are easier to reduce while choosing from the wide variety of ECAs [14] and the phenomenon of acute transient dyspnea, which develops after GA administration in 8-14% of cases, and less commonly after GD administration [15,16] and causes transient motion artifacts, mainly in the arterial phase of imaging, which may impair the quality of imaging.
LI-RADS guidelines do not recommend any of the discussed contrast agents over any other.
So far, there have been published several meta-analyses which focused on HCC detection with HBP contrast agents. Among them there are studies devoted to establishing whether there is any added value of the HBP for HCC diagnosis; however, their results are not fully concordant with the results of our study.
Material and methods
A systematic literature search was performed on November 22, 2023 in the PubMed, and Scopus databases with the time limit set at 2010. In both databases the entered key words were: “liver, tumor, MRI”. In PubMed, the article language was limited to “English”, and the chosen species was “Humans”. Additional applied filters included: “Books and documents”, “Clinical Study”, “Comparative Study”, “Legal case”, “Observational Study”, “Randomized Controlled Trial”, “Validation Study”. In Scopus the “Subject area” was “Limited to Medicine”, the “Document type” was “Limited to Article”, and “Limited to Review”, the “Source type” was “Limited to Journal”, and the “Language” was “Limited to English”.
References were screened first by their titles and abstracts, and subsequently by full texts.
Studies were included if: 1) Subjects were patients with cirrhosis or chronic liver disease; the objective of the research focused on HCC detection or diagnosis in magnetic resonance imaging (MRI) studies with hepatobiliary phase contrast agents; 2) the studies were based on original research, not on review, case report, letter, comment, guideline or meta-analysis; 3) studies were performed in a single center; 4) the reference standard was pathological proof or pathological proof and/or follow-up in computed tomography (CT) or MRI in at least 3 months and/or lipiodol uptake after transhepatic arterial chemoembolization; 5) the HCC criteria included arterial hypervascularity, portal venous phase washout, and HBP hypointensity; in case of additional criteria, we chose the ones with the highest diagnostic values for studies both with and without the HBP; 6) original data of at least true positive (TP) and false negative (FN) indicators for calculating sensitivity and at least false positive (FP) and true negative (TN) indicators for calculating specificity could be extracted.
Only per lesion records were taken into consideration.
Studies were excluded if: 1) any of the inclusion criteria were not met; 2) articles were based on the same study population in which case the most detailed and/or most recent publication was included; 3) data were based on per patient records; 4) the study object suffered from other malignant lesions, not HCC; 5) based on recurrent HCC lesions; 6) they used experimental or abbreviated MRI protocols.
The results of the search were screened by two investigators by titles and abstracts so to extract studies potentially meeting the selection criteria. The chosen studies were retrieved for detailed evaluation by two investigators who rejected articles that did not meet the inclusion criteria. The investigators abstracted data from each included study to obtain information on the publication year, author, study design, magnet strength, reference standard, contrast agent, number of patients, number and size of HCC lesions, and values of the indicators TP, FP, FN, and TN. If a study had more than one observer evaluating the image sets, the highest TP, FP, FN, and TN values were taken into consideration. Any disagreements between the investigators were resolved by consensus. In selecting articles, the authors followed the Preferred Reporting Items for Systematic Reviews and Meta-Analysis (PRISMA) statement.
The current version of the Quality Assessment of Diagnostic Studies (QUADAS-2) was used to evaluate the quality of the included studies in four domains: flow and timing, reference standard, index test, and patient selection. Each domain was classified with a low, high, or unclear risk of bias by two investigators.
Statistical analysis
TIBCO Software Inc. (2017). Statistica (data analysis software system), version 13 (http://statistica.io) was used for all calculations. Chi-square statistics were used to estimate the statistical heterogeneity among the included studies. I2 statistics were used to describe the proportion of the variation among the studies compared to the total variation. From the TP, FP, FN, TN values polled sensitivities and specificities were calculated for records with and without the HBP. From the sensitivities and specificities the summary receiver operating characteristics curves (SROC) were constructed, and AUC values (area under the SROC curve) were used to further assess the diagnostic accuracy of studies with and without the HBP. The p-value < 0.05 was considered statistically significant.
Results
Study selection
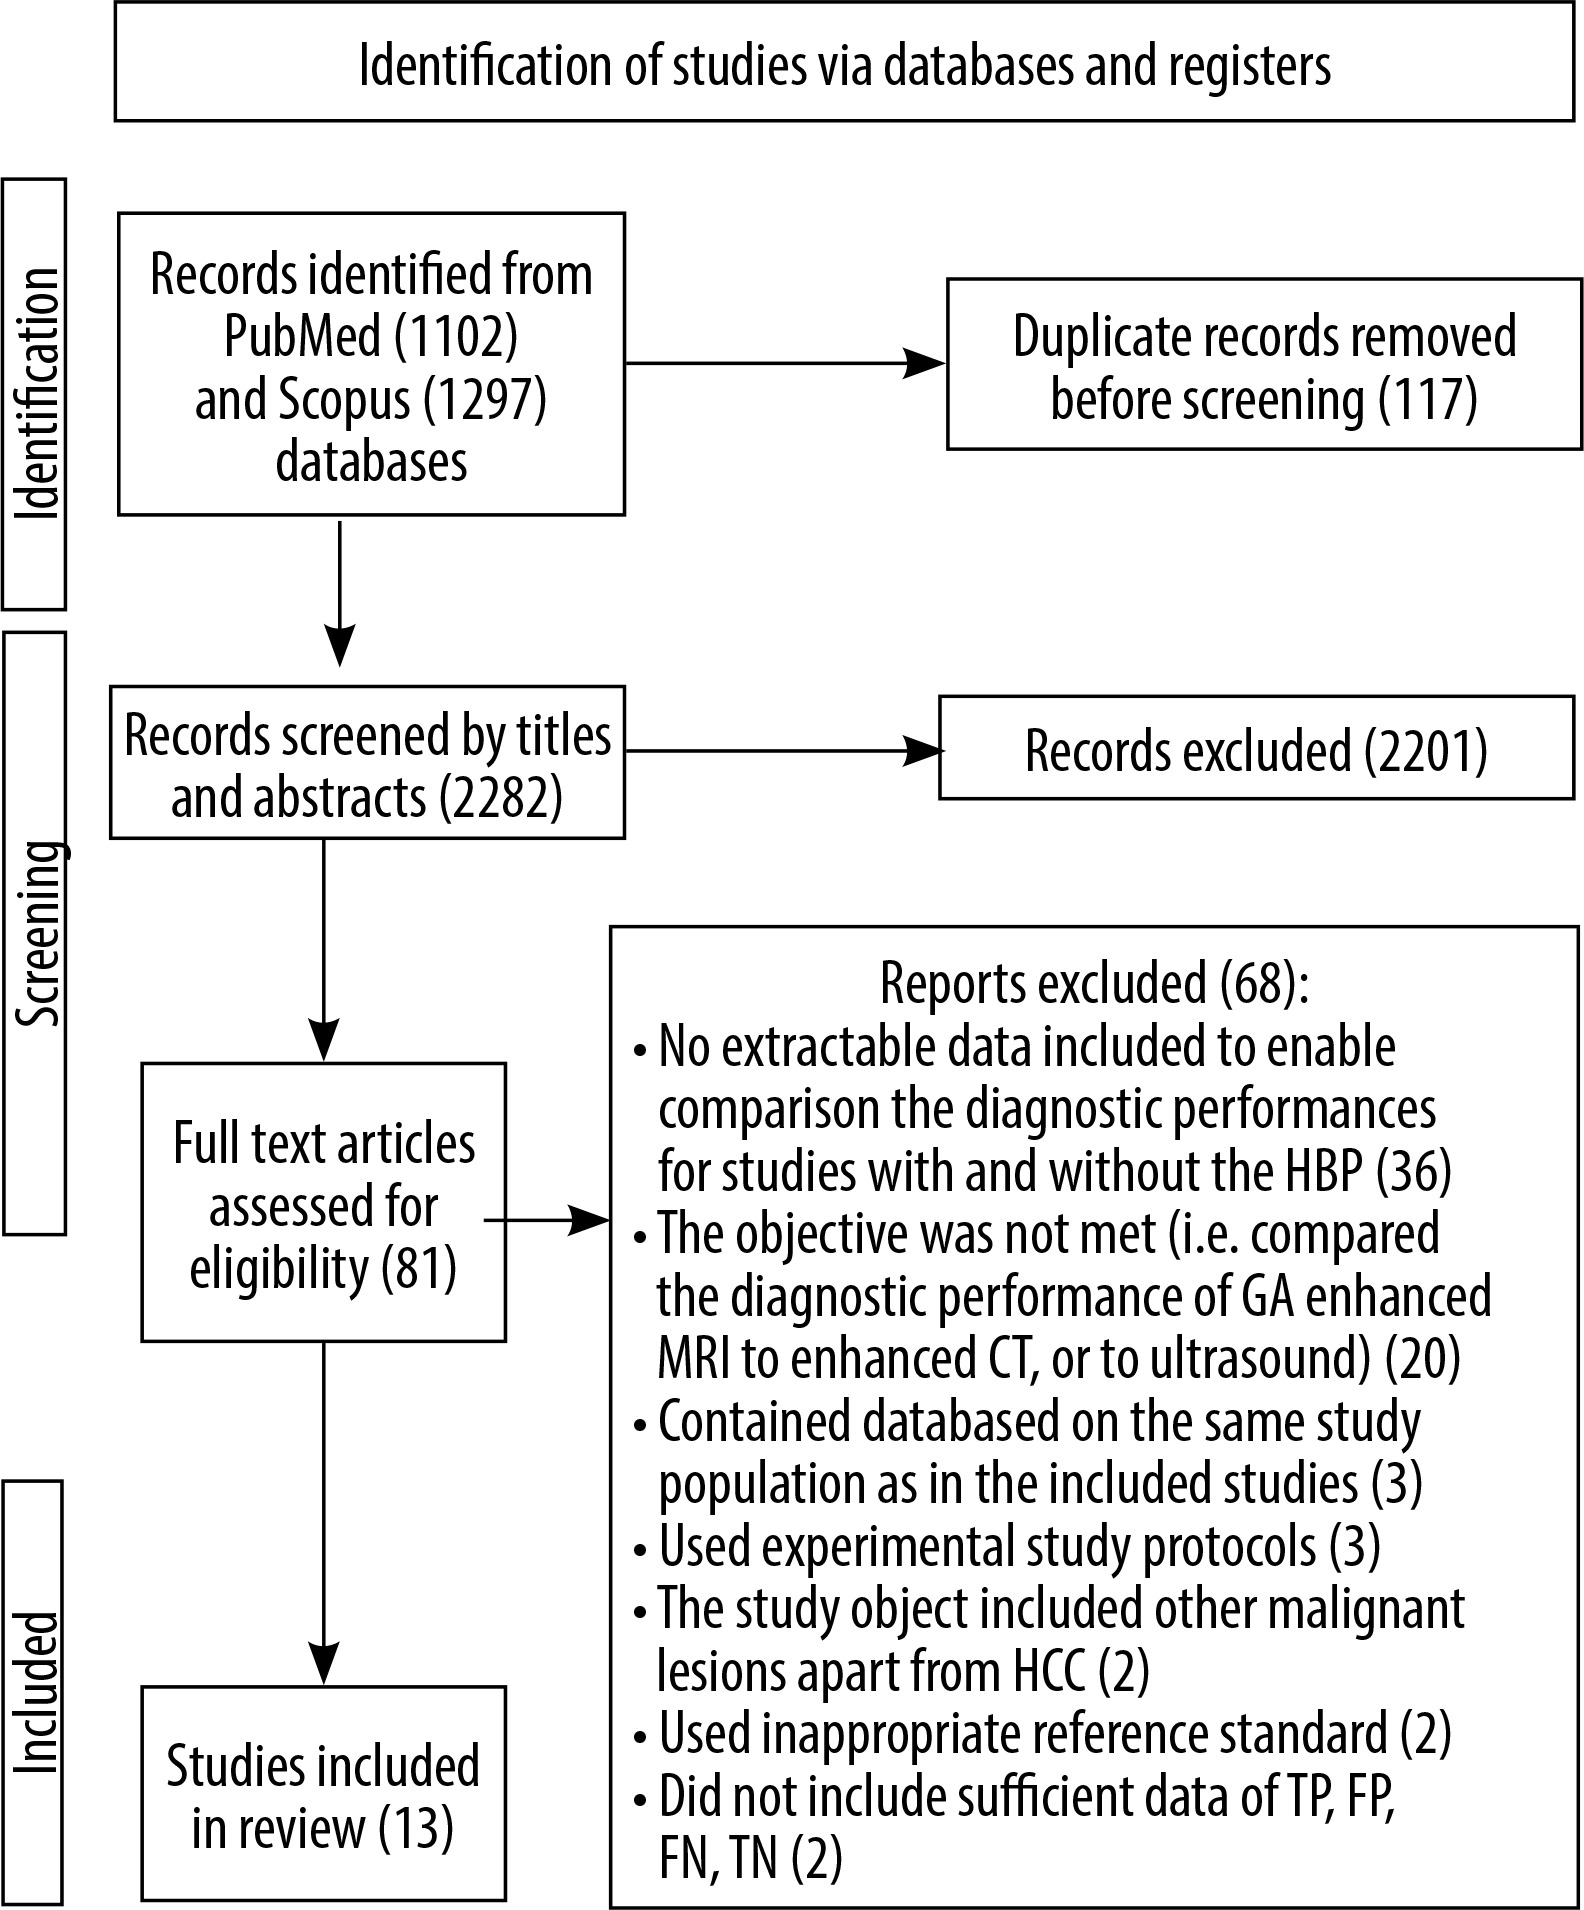
In the process of literature selection, the authors followed the Preferred Reporting Items for Systematic Reviews and Meta-Analysis (PRISMA) statement. With the applied filters, 2399 records were found, of which 81 were potentially relevant according to their titles and abstracts. Full-paper review excluded 66 articles. From the remaining 15 studies, two were excluded as sufficient data of TP, FP, FN, TN data were not found, therefore the sensitivities and – consequently – specificities could not be counted. In this way, 13 articles were finally included in the meta-analysis, involving 13 studies without the HBP, and 1014 HCC cases, and 13 studies including the HBP with 1102 lesions.
Figure 4 shows the details of the study selection process in the PRISMA Flow chart.
Study characteristics
The demographics and baseline information concerning the included studies are shown in Table 1 [17-29]. The extracted records of the indicators TP, FP, TN, TN with and without the HBP are shown in Tables 2 and 3.
Table 1
Demographics and baseline information
| PubMed ID | Year | Author, reference | Study design | Magnet | Reference standard | Contrast agent | No. of patients | HCC number | HCC size (cm) |
|---|---|---|---|---|---|---|---|---|---|
| 20413759 | 2010 | Ahn [17] | Retrospective | 1.5 or 3 T | 1, 3, 4 | GA | 59 | 84 | 0.4-11 |
| 20882620 | 2010 | Chou [18] | Prospective | 1.5 T | 1 | GA | 38 | 51 | 1.3-5.5 |
| 21598343 | 2011 | Haradome [19] | Retrospective | 1.5 T | 1 | GA | 75 | 60 | 0.5-2.8 |
| 22986351 | 2012 | Gatto [20] | Retrospective | 1.5 T | 1 | GD | 25 | 16 | 1-3 |
| 21920517 | 2012 | Baek [21] | Retrospective | 3 T | 1, 2 | GA | 51 | 73 | 0.2-10 |
| 24363528 | 2013 | Phongkitkarun [22] | Retrospective | 1.5 or 3 T | 1, 2, 5 | GA | 100 | 59 | 1-12 |
| 23011874 | 2013 | Bashir [23] | Prospective | 1.5 T | 1, 6 | GA | 100 | 70 | ND |
| 27100719 | 2016 | Orlacchio [24] | Retrospective | 1.5 T | 1 | GA | 17 | 37 | 0.5-5.6 |
| 27835984 | 2016 | Di Martino [25] | Prospective | 3 T | 1 | GA | 73 | 71 | 0.5-2 |
| 26104079 | 2016 | Chen [26] | Retrospective | 1.5 T | 1 | GA | 139 | 111 | > 0.5 |
| 28217239 | 2017 | Imbriaco [27] | Prospective | 3 T | 1, 2 | GA | 73 | 74 | 0.6-4.2 |
| 30255250 | 2019 | Joo [28] | Retrospective | 1.5 or 3 T | 1 | GA | 288 | 292 | 1-21 |
| 30990381 | 2019 | Kim [29] | Retrospective | 1.5 T | 1 | GA | 178 | 186 | 1-3 |
[ii] Reference standard: 1 – pathological proof, 2 – follow-up in MR or CT, 3 – typical clinical history and tumor marker levels in combination with lipiodol uptake after transhepatic arterial chemoembolization (TACE), 4 – typical clinical history and tumor marker levels in combination with follow-up CT or MR imaging, 5 – lipiodol uptake after TACE, 6 – HCC diagnosis posed by imaging on an earlier or follow-up CT or MRI with an extracellular contrast agent.
Table 2
The extracted indicators TP, FP, FN, TN in records including the HBP
| Study | Year | TP | FP | FN | TN | No. |
|---|---|---|---|---|---|---|
| Ahn [17] | 2010 | 77 | 2 | 7 | 27 | 113 |
| Chou [18] | 2010 | 50 | ND | 1 | ND | 51 |
| Haradome [19] | 2011 | 52 | 3 | 8 | 36 | 60 |
| Gatto [20] | 2012 | 11 | 4 | 5 | 10 | 30 |
| Baek [21] | 2012 | 67 | 10 | 4 | 36 | 73 |
| Phongkitkarun [22] | 2013 | 55 | 1 | 4 | 45 | 105 |
| Bashir [23] | 2013 | 67 | 8 | 3 | 47 | 125 |
| Orlacchio [24] | 2016 | 36 | 1 | 1 | 9 | 47 |
| Di Martino [25] | 2016 | 59 | 2 | 12 | 45 | 118 |
| Chen [26] | 2016 | 107 | 1 | 4 | 27 | 111 |
| Imbriaco [27] | 2017 | 70 | 0 | 4 | 51 | 125 |
| Joo [28] | 2019 | 274 | 44 | 18 | 46 | 292 |
| Kim [29] | 2019 | 177 | 9 | 3 | 14 | 186 |
Table 3
The extracted indicators TP, FP, FN, TN in records without the hepatobiliary phase
| Study | Year | TP | FP | FN | TN | No. |
|---|---|---|---|---|---|---|
| Ahn [17] | 2010 | 72 | 2 | 12 | 27 | 113 |
| Chou [18] | 2010 | 43 | ND | 8 | ND | 51 |
| Haradome [19] | 2011 | 46 | 2 | 14 | 37 | 60 |
| Gatto [20] | 2012 | 11 | 5 | 5 | 9 | 30 |
| Baek [21] | 2012 | 67 | 11 | 3 | 36 | 73 |
| Phongkitkarun [22] | 2013 | 47 | 1 | 12 | 45 | 105 |
| Bashir [23] | 2013 | 66 | ND | 4 | ND | 70 |
| Orlacchio [24] | 2016 | 28 | 1 | 9 | 9 | 47 |
| Di Martino [25] | 2016 | 47 | 4 | 24 | 43 | 118 |
| Chen [26] | 2016 | 96 | 0 | 15 | 28 | 111 |
| Imbriaco [27] | 2017 | 69 | 0 | 5 | 51 | 125 |
| Joo [28] | 2019 | 253 | 13 | 39 | 82 | 292 |
| Kim [29] | 2019 | 169 | 17 | 3 | 14 | 186 |
Quality assessment
With the help of the QUADAS-2 tool, the quality of each included study was assessed by evaluating the possibility of bias in four different categories. Most studies gave a clear description of participants, index test, reference standard, and flow and timing. The quality assessment based on QUADAS-2 is presented in Table 4.
Table 4
Tabular presentation of the Quality Assessment of Diagnostic Studies (QUADAS-2)
| Study | Risk of bias | Applicability concerns | |||||
|---|---|---|---|---|---|---|---|
| Patient selection | Index test | Reference standard | Flow and timing | Patient selection | Index test | Reference standard | |
| Ahn [17] |  | | | ? | | | |
| Chou [18] | | ? | | | ? | | ? |
| Haradome [19] | | | | ? | | | |
| Gatto [20] | | | ? | ? | | | ? |
| Baek [21] | | | | | | ? | |
| Phongkitkarun [22] | | | | ? | | | ? |
| Bashir [23] | | ? | ? | | ? | ? |  |
| Orlacchio [24] | | | | | ? | ? | |
| Di Martino [25] | | | | | | ? | |
| Chen [26] | | ? | | ? | | | ? |
| Imbriaco [27] | ? | | ? | | | | |
| Joo [28] | | | | | ? | | ? |
| Kim [29] | | | | | | ? | |
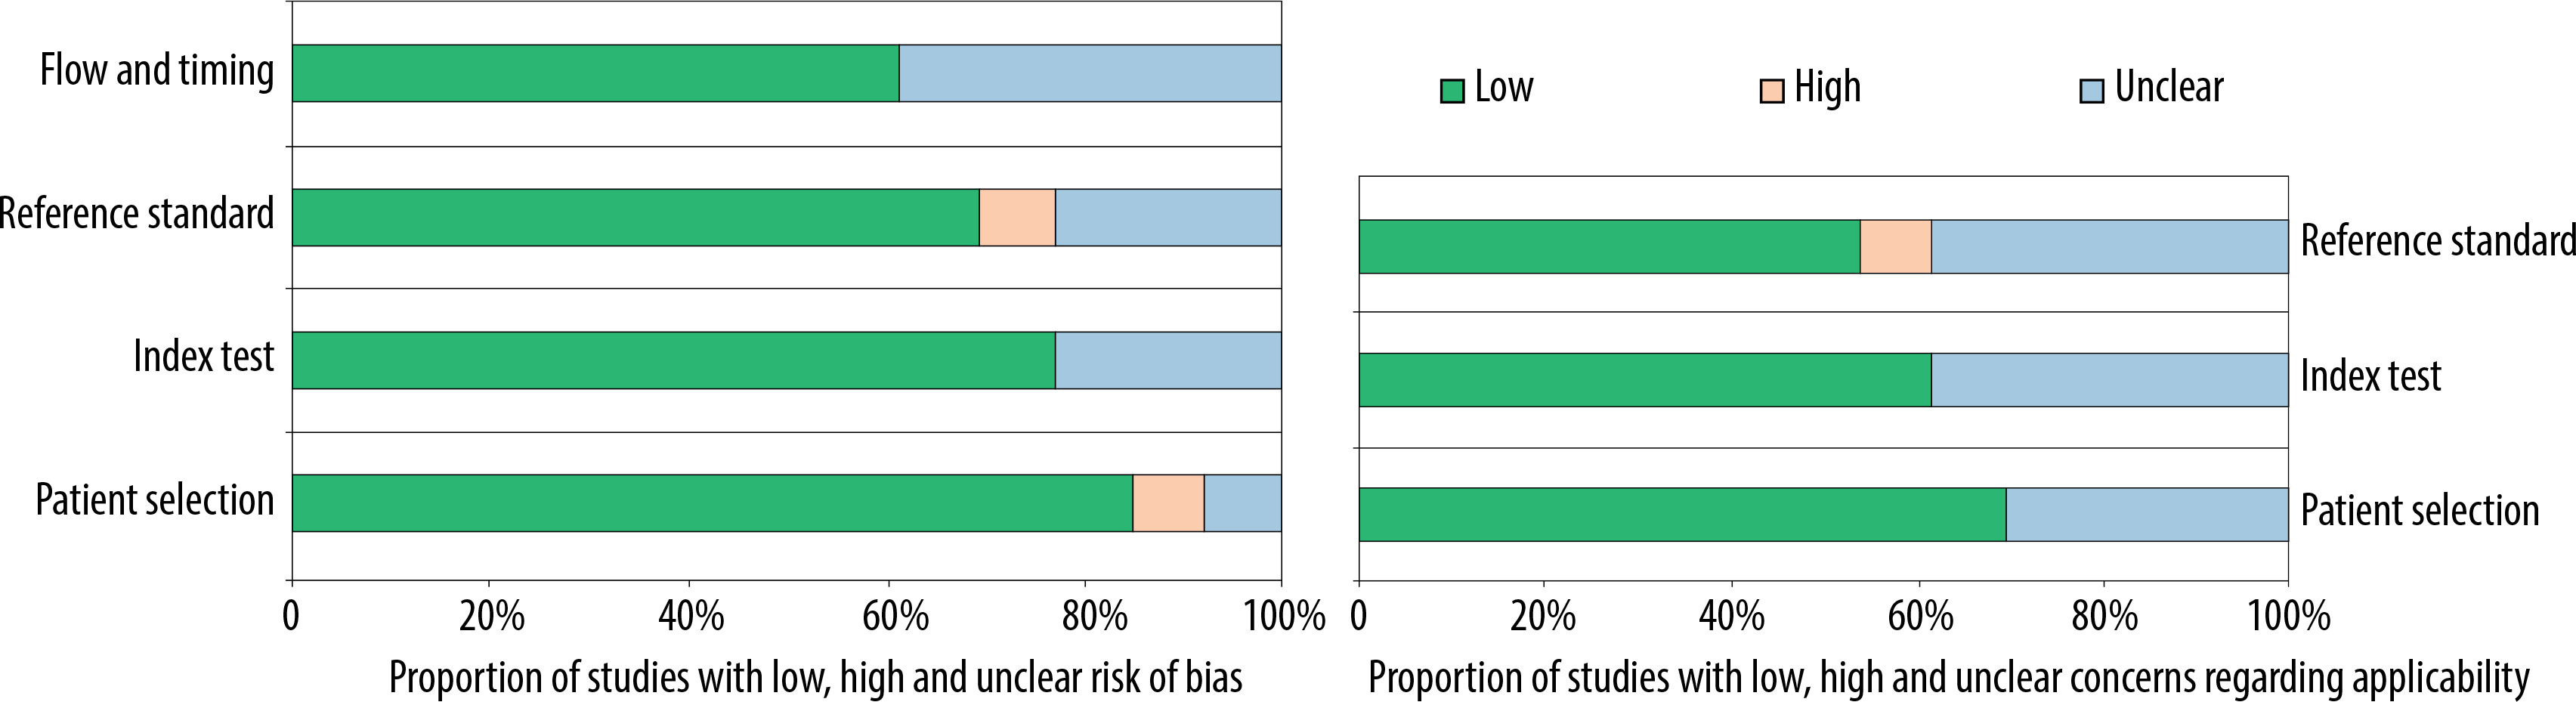
The graphical display of the QUADAS-2 results is shown in Figure 5, which provides a representation of the QUADAS-2 findings against the percentage of research included for each topic. Most questions, from patient selection to explained withdrawals, received overall high marks.
Figure 5
The proportion of studies with low, high, or unclear risk of bias, and the proportion of studies with low, high, or unclear concerns regarding applicability
Diagnostic performances
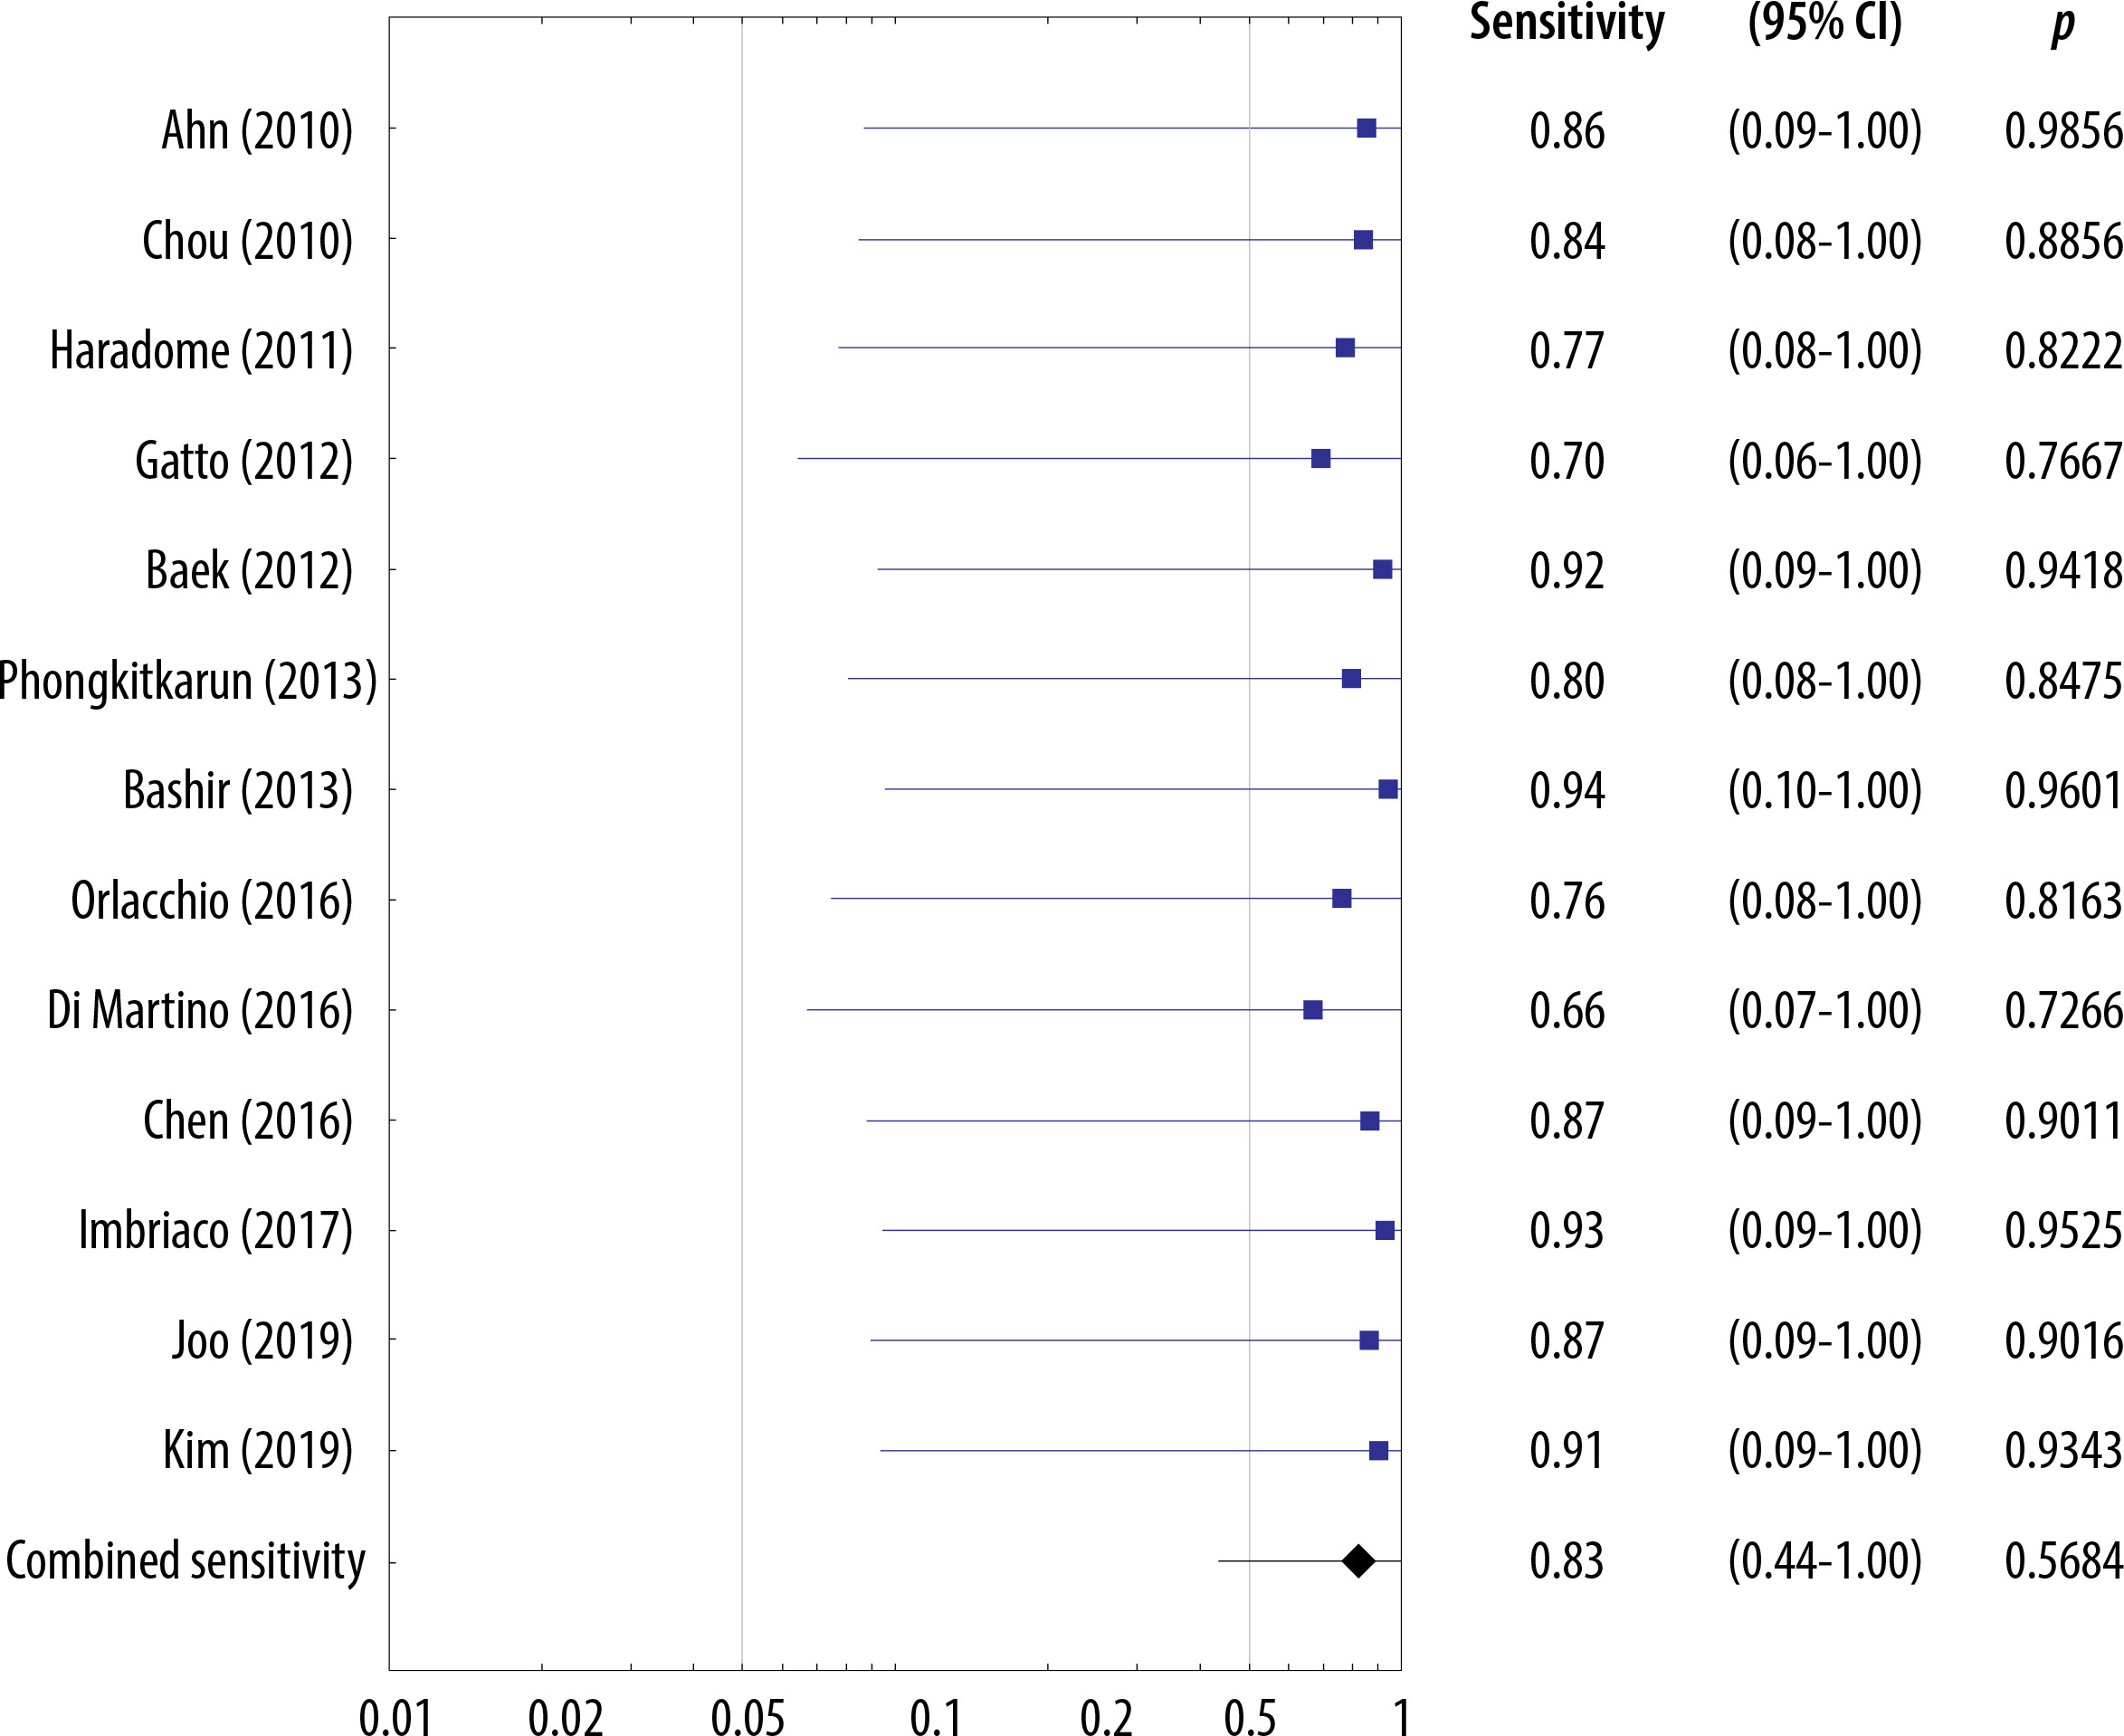
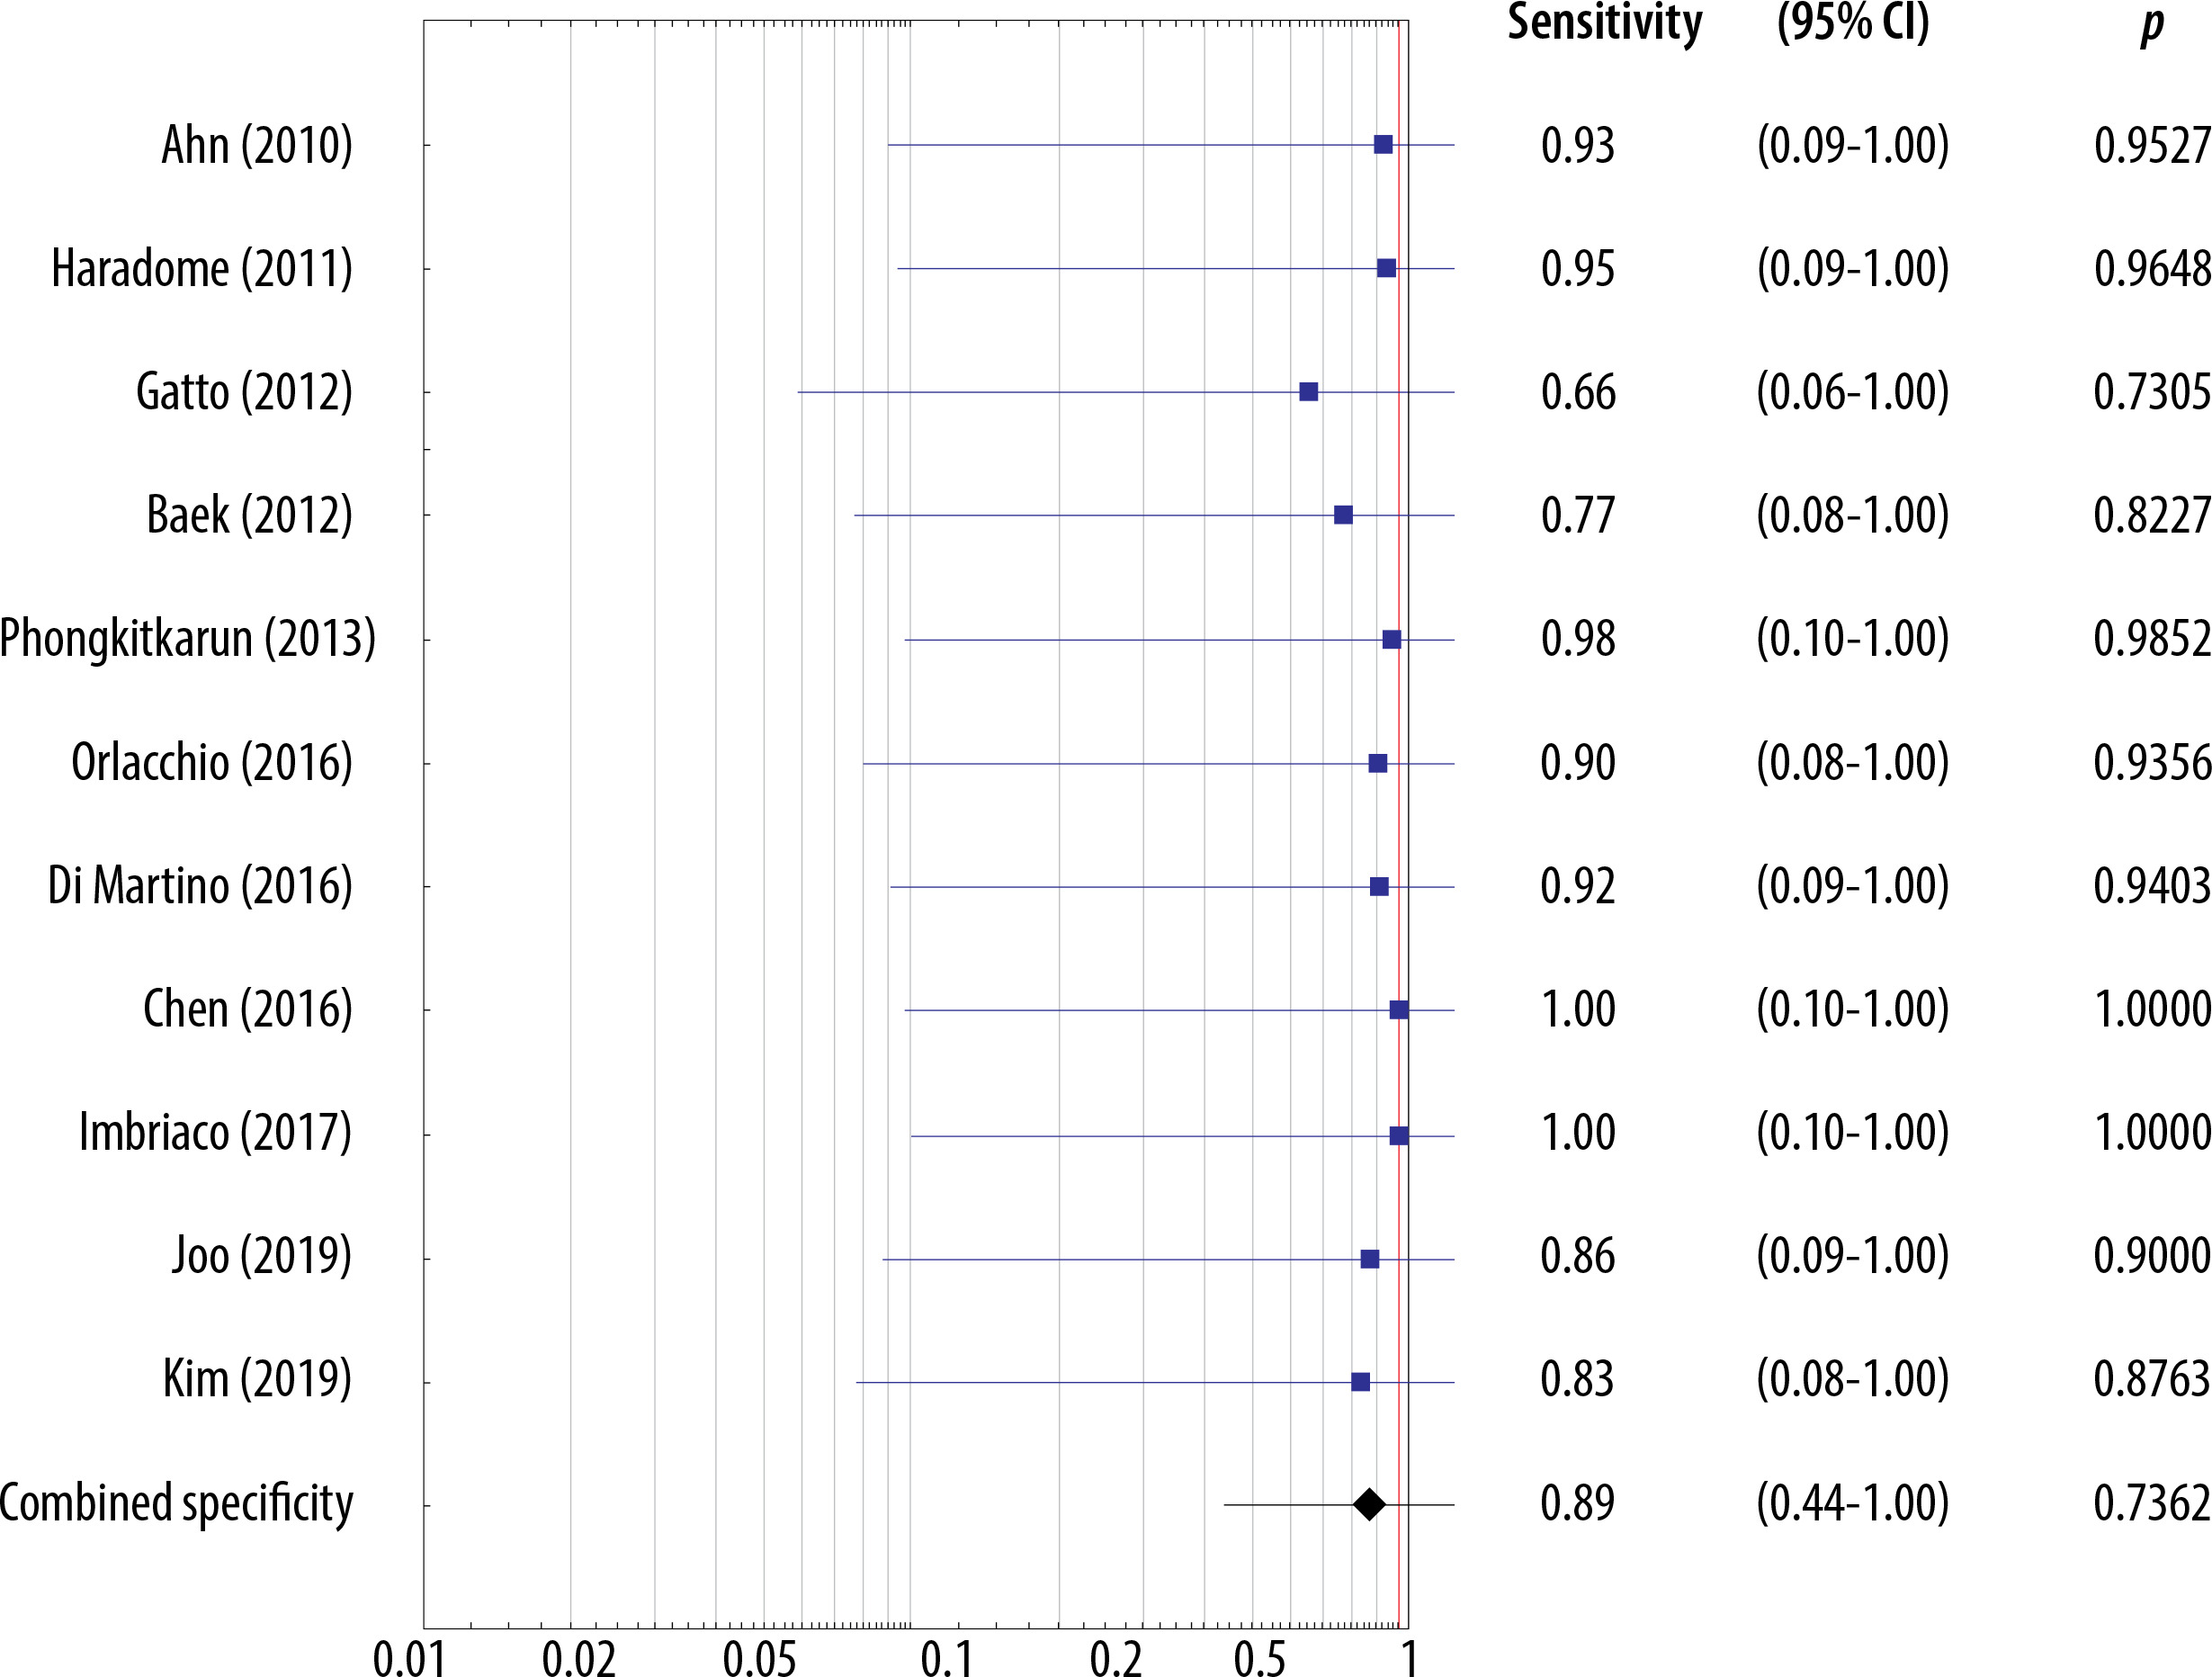
The sensitivities of the included studies without the HBP ranged 0.66-0.94 and the estimated overall sensitivity was 0.83 (95% CI: 0.44-1.00) (Figure 6). The specificities of the included studies without the HBP ranged 0.66-1.00 and the estimated overall specificity was 0.89 (95% CI: 0.44-1.00) (Figure 7).
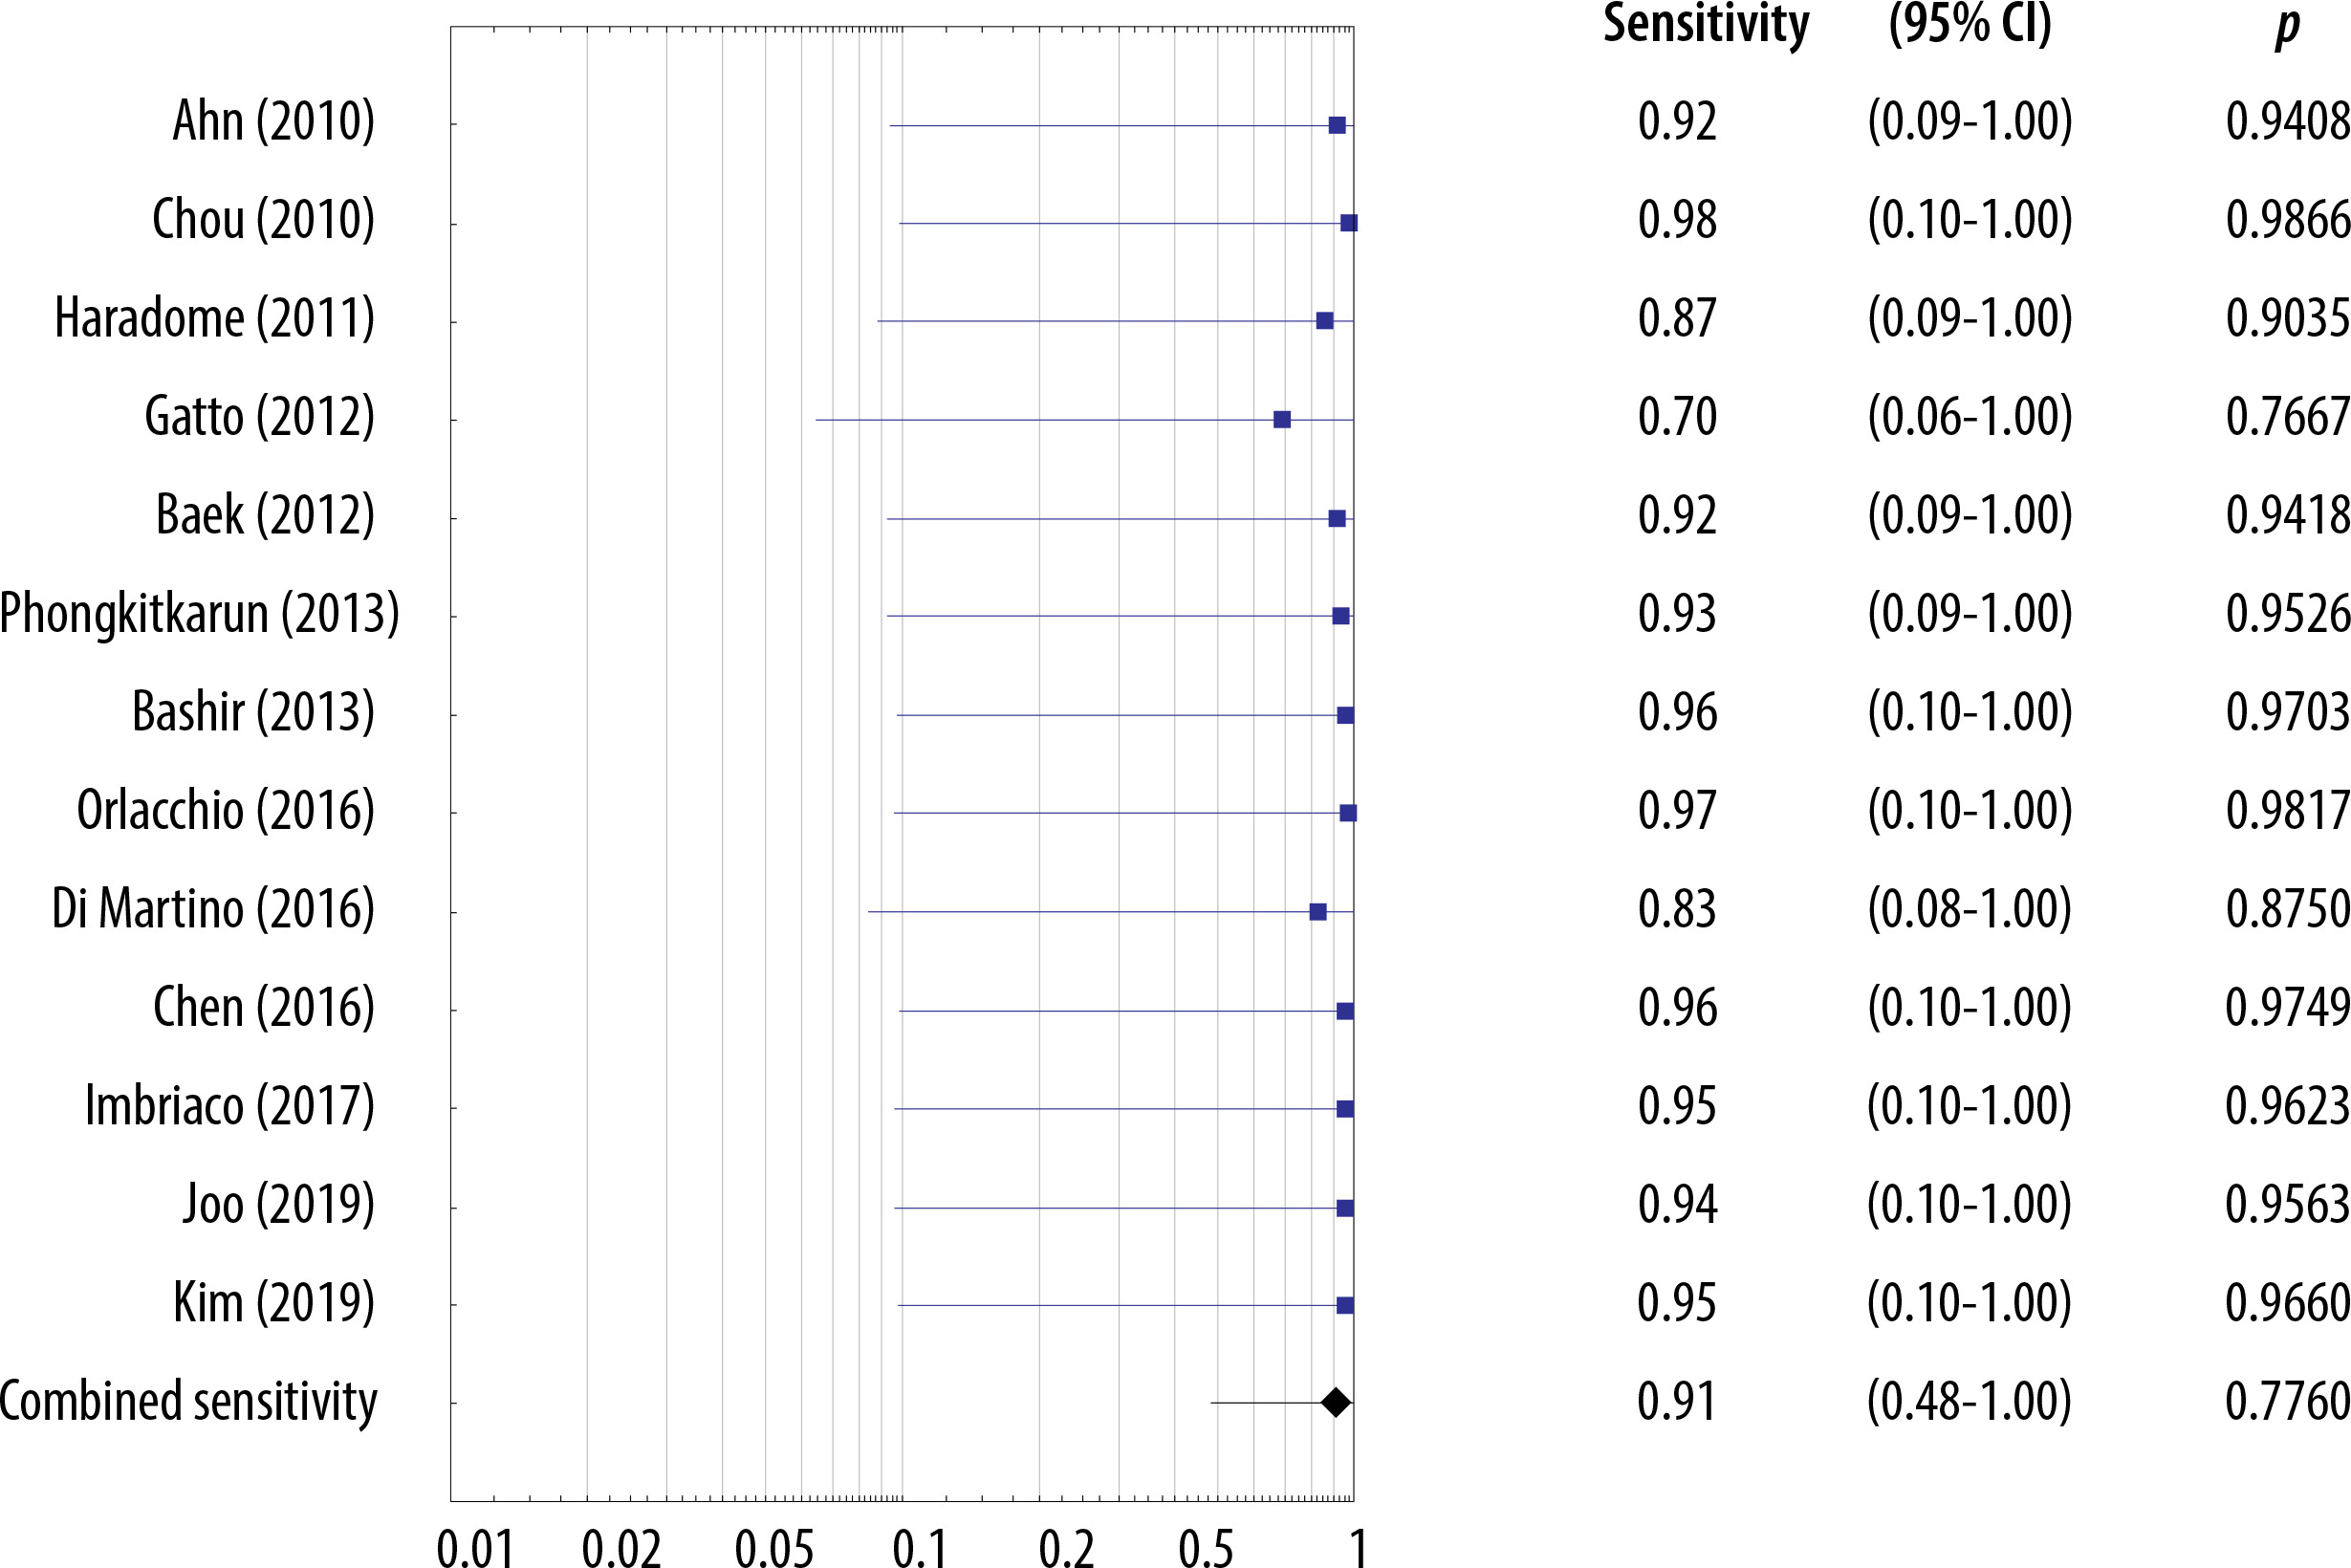
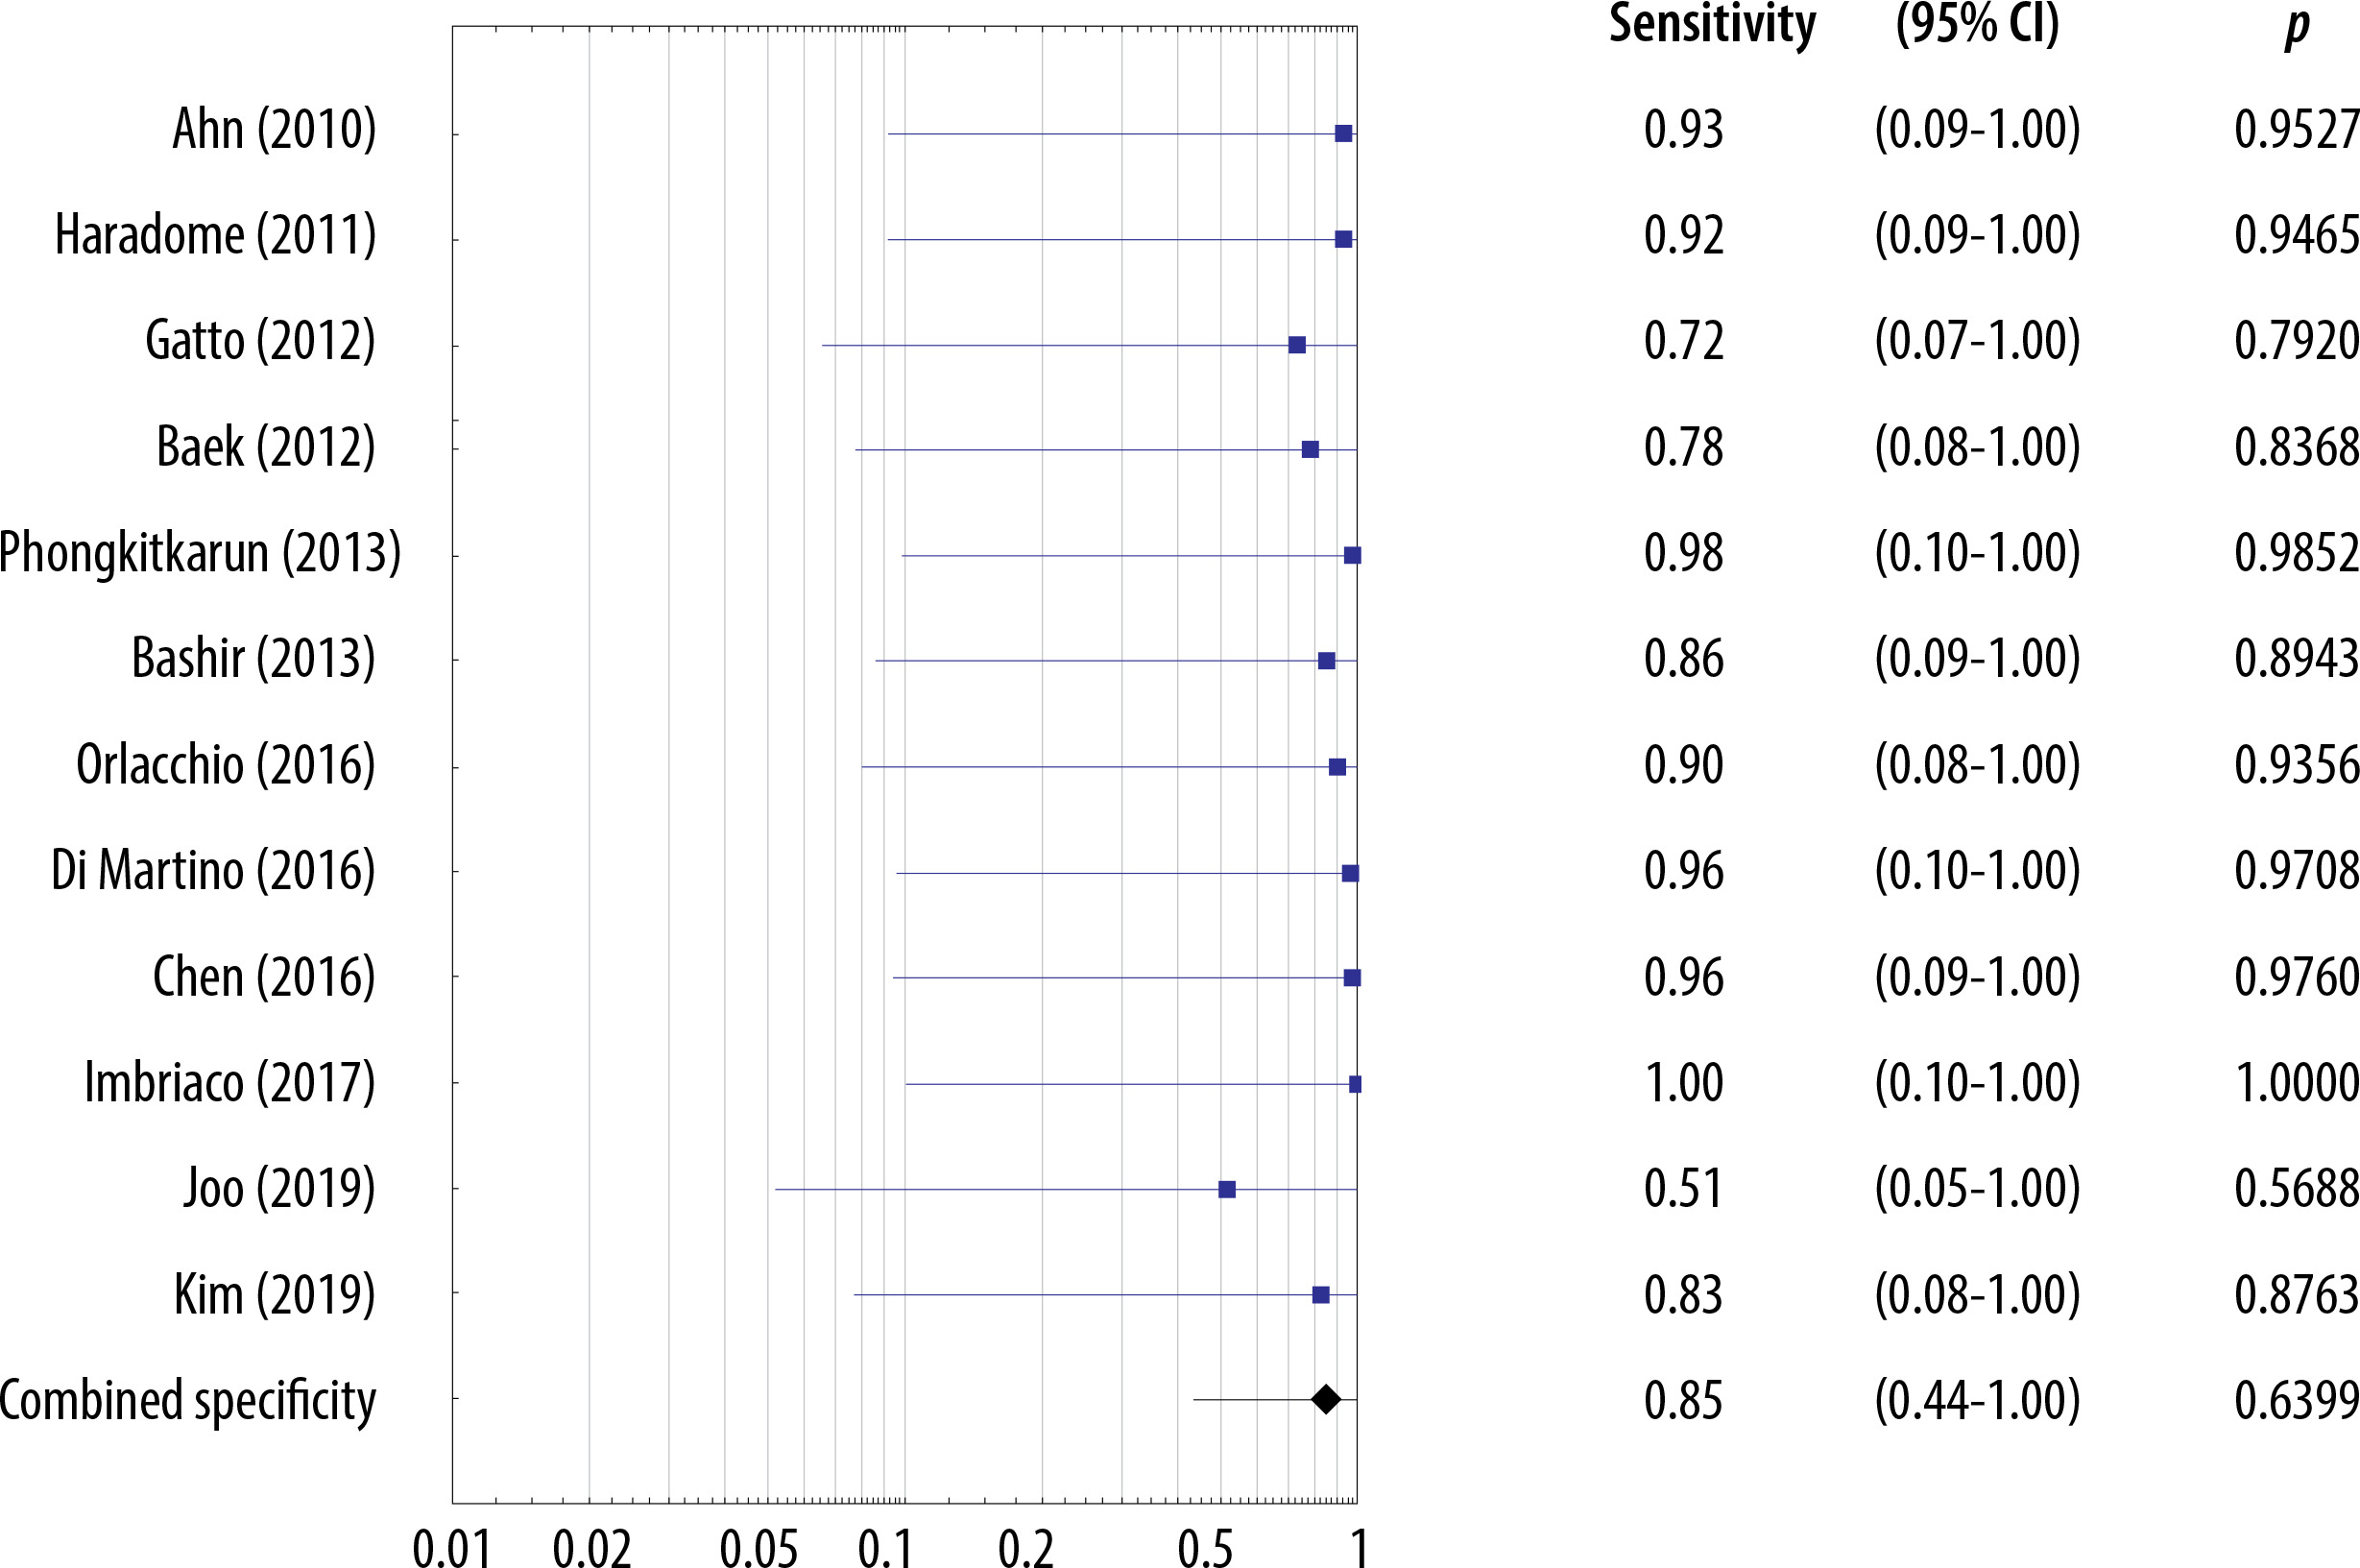
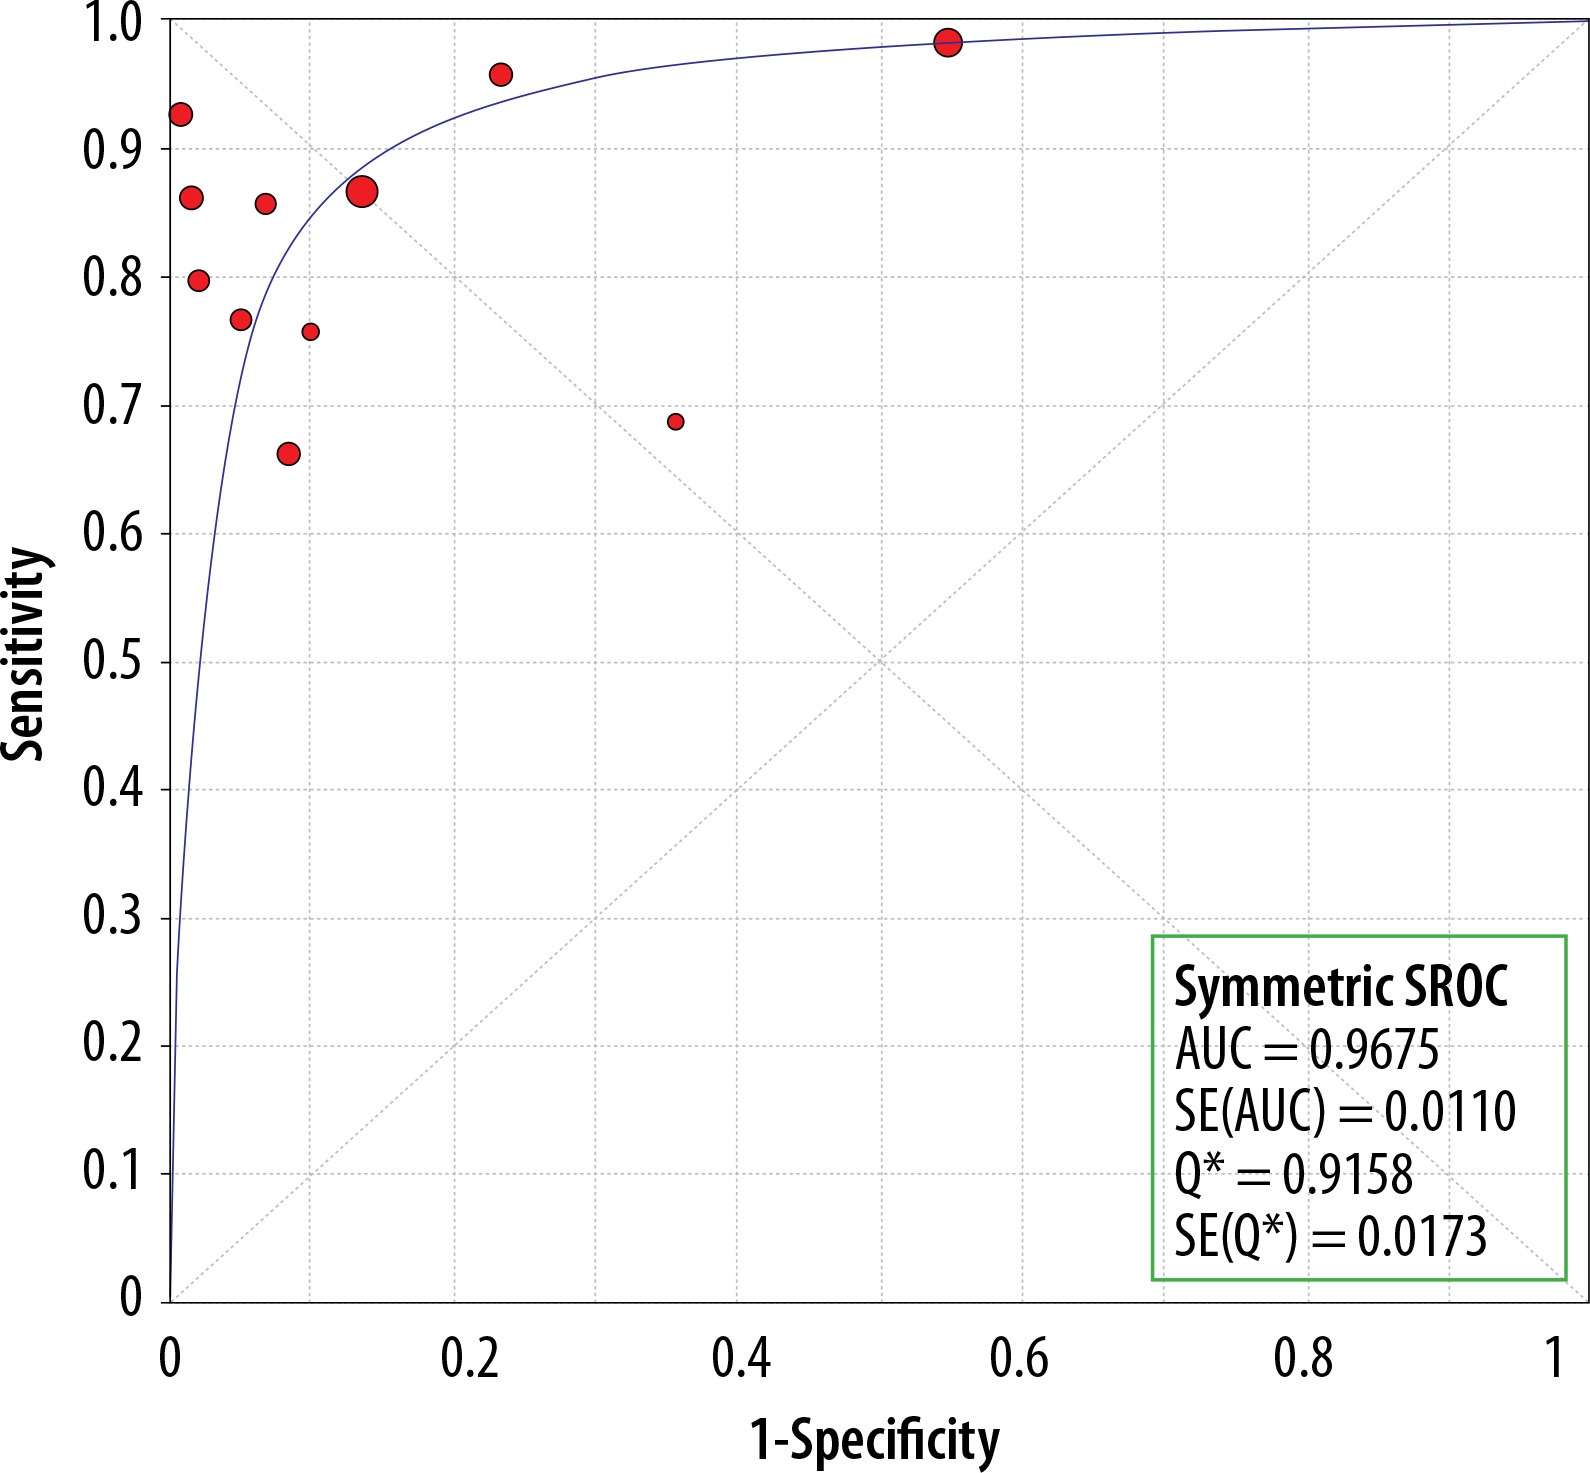
The sensitivities of the MRI studies including the HBP ranged 0.70-0.98 and the estimated overall sensitivity was 0.91 (95% CI: 0.48-1.00) (Figure 8). The specificities of studies including the HBP ranged 0.51-0.98 and the estimated overall specificity was 0.85 (95% CI: 0.44-1.00) (Figure 9).
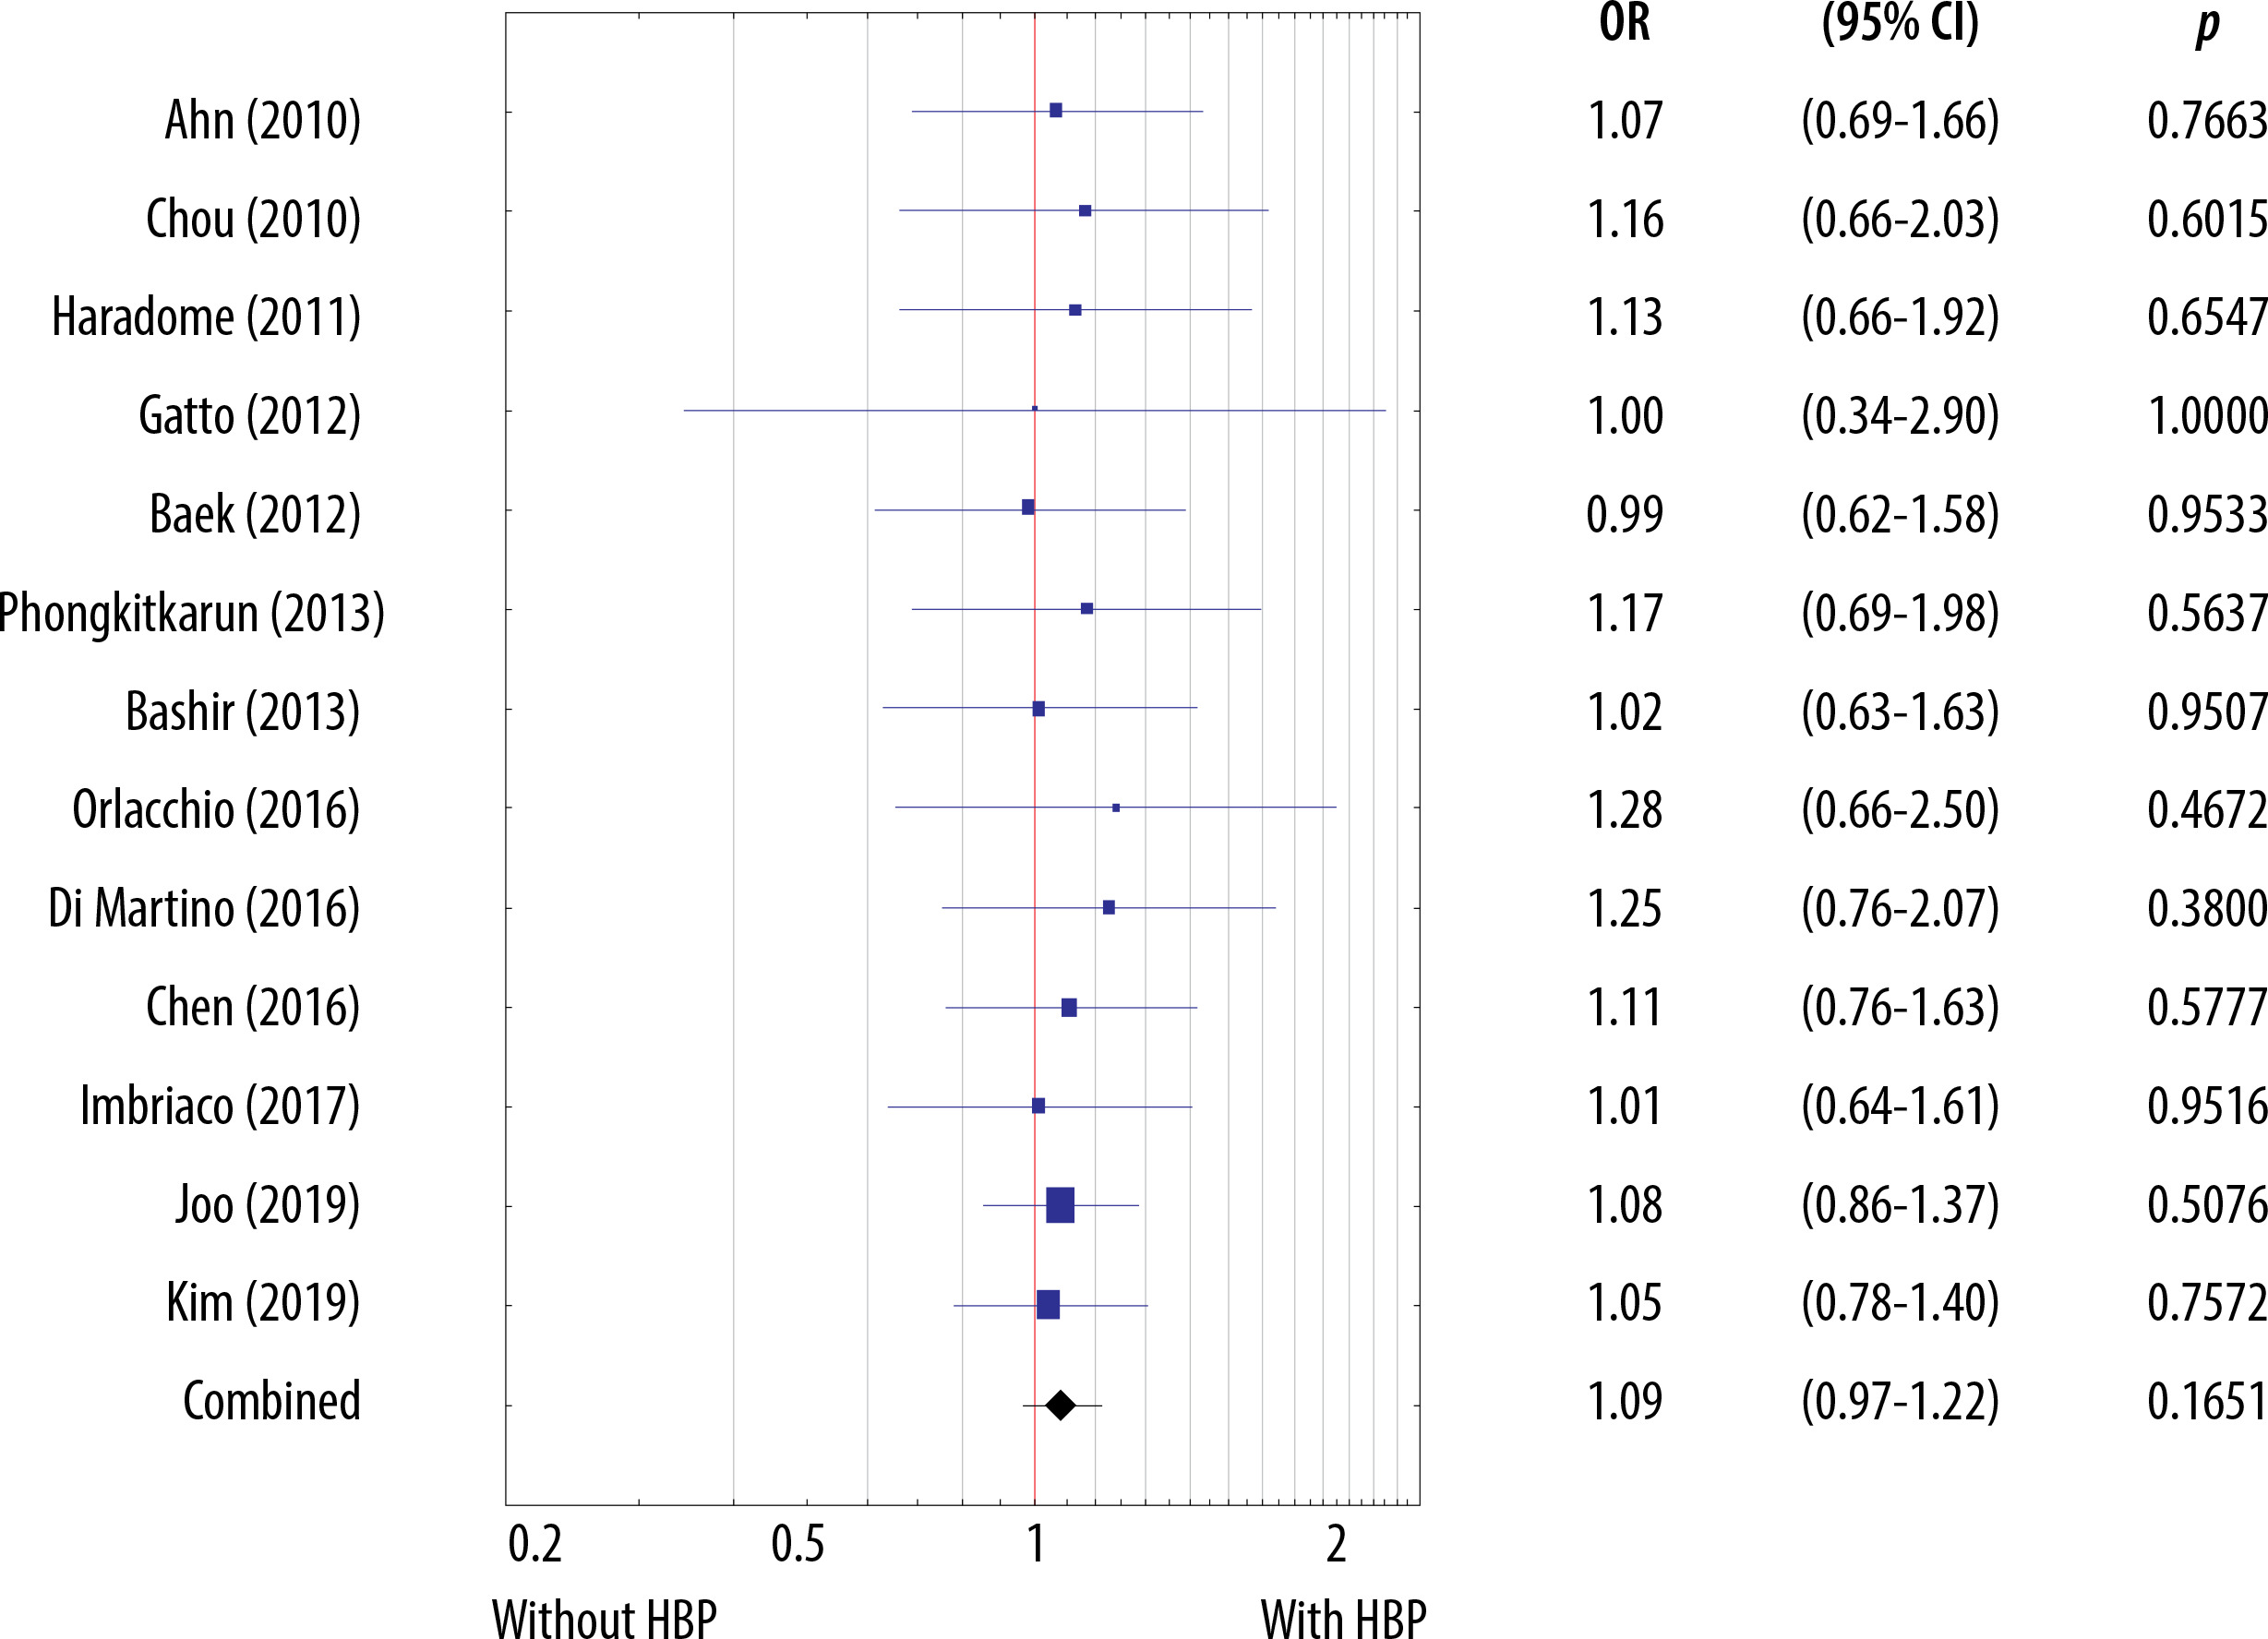
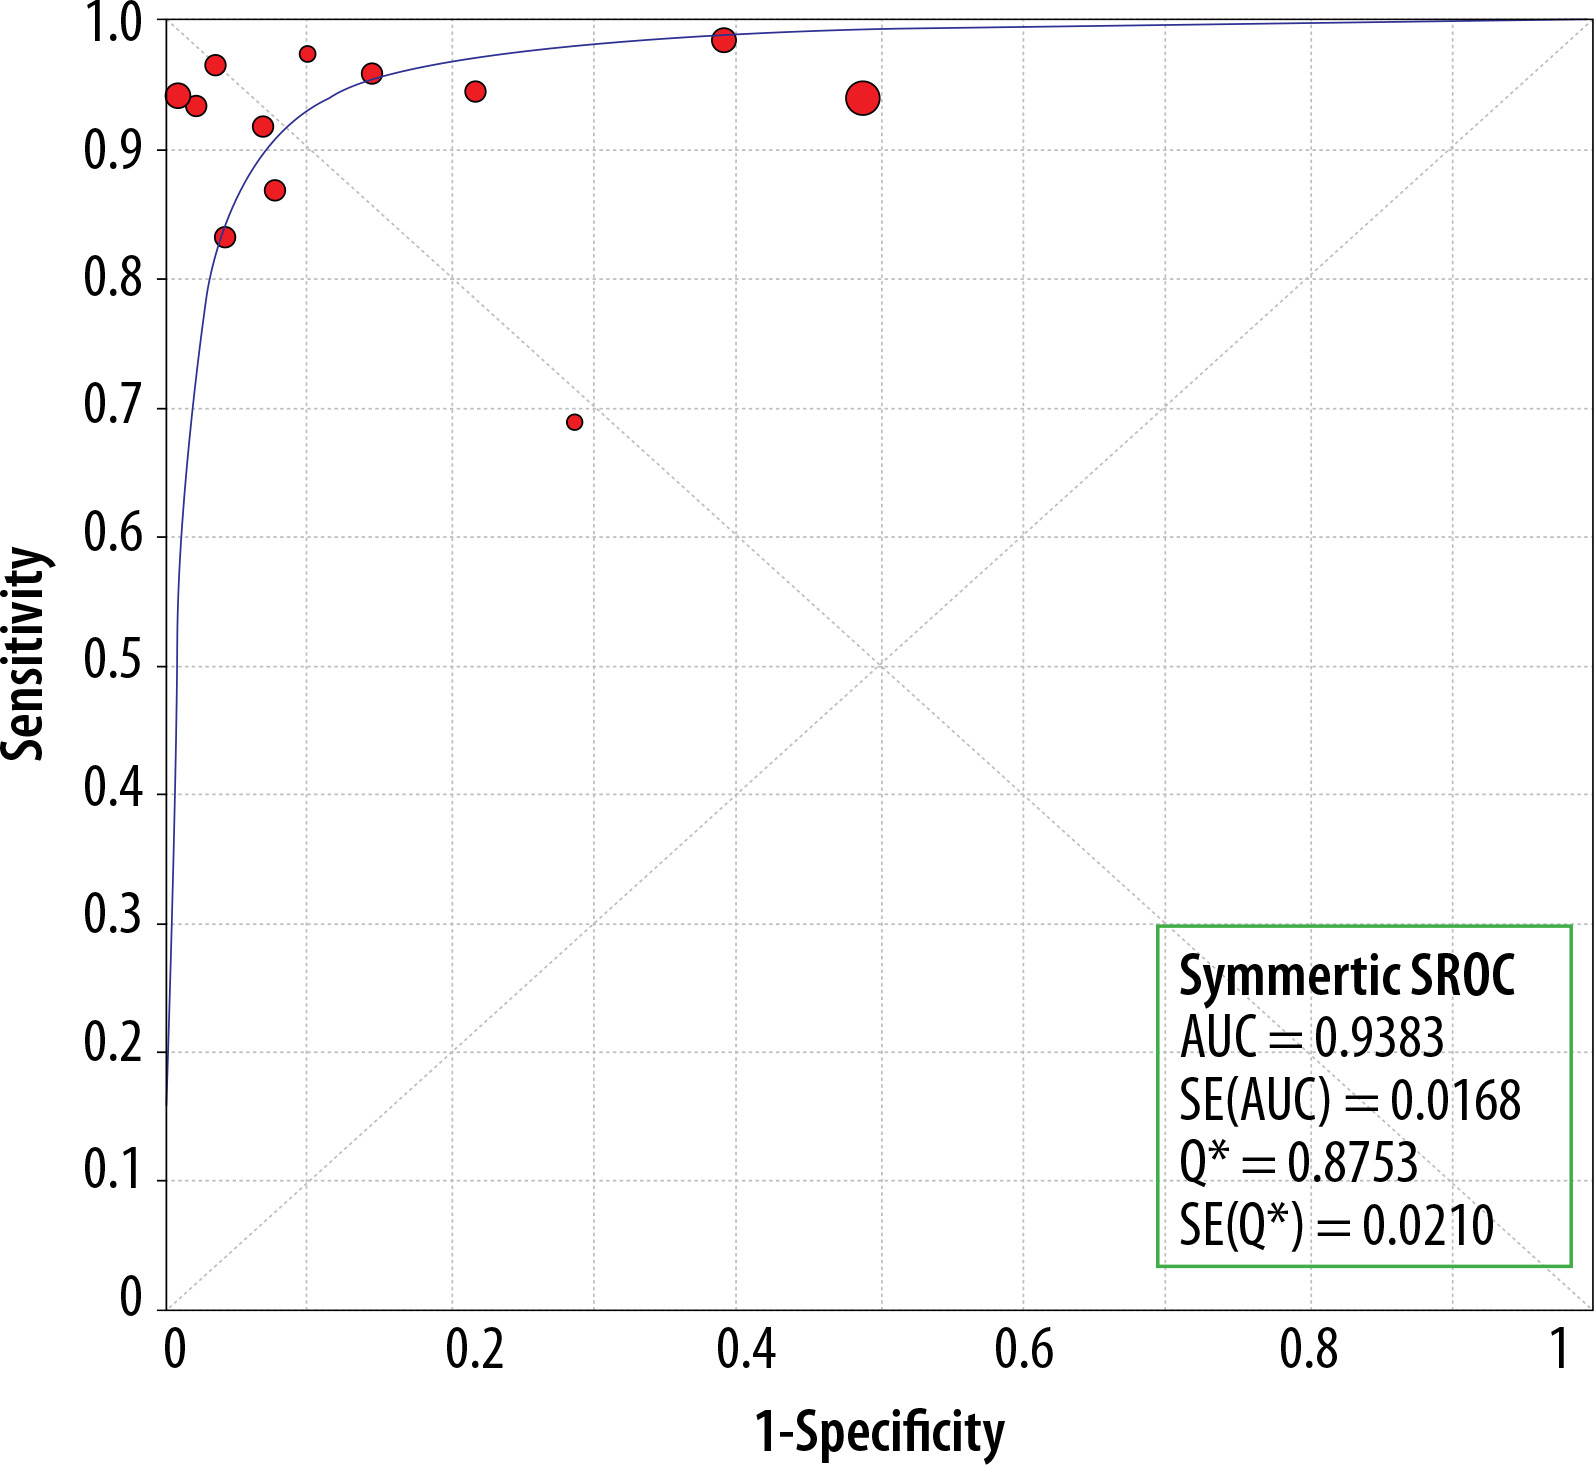
There were no statistically significant differences in sensitivity between the MRI studies with and without the HBP (p = 0.1651) (Figure 10). The AUC for studies without the HBP was 0.94 (Figure 11) and that with the HBP was 0.97 (Figure 12).
Heterogeneity assessment and meta-regression analysis
No significant heterogeneity in sensitivities and specificities among the included MRI studies without the HBP was found. For sensitivities, the chi-square statistic was 0.11 (df = 12, p = 1.00). For specificities, the χ2 statistic was 0.11 (df = 10, p = 1.00). For sensitivities and specificities, the variance of the actual effects of T2 and I2 equaled 0.
Moreover, no significant heterogeneity in sensitivities and specificities among the included MRI studies with the HBP was found. For sensitivities the chi-square statistic was 0.07 (df = 12, p = 1.00). For specificities the χ2 statistic was 0.28 (df = 11, p = 1.00). For sensitivities and specificities the variance of the actual effects of T2 and I2 equaled 0.
Discussion
Several meta-analyses have been published to date proving high diagnostic accuracy of MRI with GA for HCC detection. For example, in a study by Junqiang et al. [30] combining 11 articles, the pooled sensitivity, specificity and SROC values were 0.92, 0.95 and 0.98. In a study by Liu et al. [31] which combined data from 10 citations the pooled sensitivity, specificity and SROC were 0.91, 0.95 and 0.98. In a study by Chen et al. [32] combining 18 citations, the pooled sensitivity, specificity and SROC were 0.91, 0.94 and 0.98.
A meta-analysis by Li et al. [33] including 13 items of literature proved that adding the diffusion weighted sequence to GA enhanced MRI improved the diagnostic accuracy 0.96-0.98.
Among meta-analyses comparing computed tomography (CT) and GA enhanced MRI, in a study by Guo et al. [34] including 12 citations, the overall sensitivities of MRI and contrast enhanced CT were 0.86 and 0.7 respectively.
A study by Liu et al. [35] which included 27 articles and focused on small lesions < 2 cm, MRI with the HBP demonstrated an overall higher sensitivity than CT (0.96 vs. 0.65), without loss of specificity (0.94 vs. 0.98). The diagnostic accuracy for MRI with the HBP was excellent – 0.97 and good for CT – 0.85.
These results are concordant with a meta-analysis by Duncan et al. [36] based on 16 articles. The study brought no evidence of superiority of the GA enhanced MRI over contrast enhanced CT for lesions of all sizes. However, in lesions < 3 cm the estimated sensitivities of GA enhanced MRI and contrast enhanced CT were 0.919 and 0.637, respectively, and the specificities were 0.936 and 0.971, respectively.
The most comprehensive meta-analysis, by Hanna et al. [37], included 242 studies concerning sensitivity and 116 studies which enabled calculation of the positive predictive value (PPV). In that study, the differences in sensitivity and PPV between contrast enhanced CT and MRI with conventional gadolinium-based contrast agents were not statistically significant. However, in the case of MRI with GA, MRI had a significantly higher sensitivity and PPV than CT (85.6 and 94.2 for MRI and 73.6, 85.8 for CT).
The meta-analyses we have discussed above proved high sensitivity of MRI with the HBP contrast agents for HCC detection, and their superiority over contrast enhanced CT and MRI with ECAs. Furthermore, we found some studies which included assessment of the additional value of the HBP.
One of them, a recently published meta-analysis by Pan et al. [38], appears similar to ours in terms of the objective, but different in terms of the results. In the latter meta-analysis, studies with the HBP showed statistically higher sensitivities than studies without the HBP for HCC diagnosis in patients with chronic liver disease (84% vs. 68%). However, unlike in our study, substantial heterogeneity among the included studies was observed. Moreover, since true negative data could not be extracted for several studies, the diagnostic accuracy was not assessed for studies without the HBP.
In another meta-analysis by Kierans et al. [39] the pooled sensitivity for MRI with the HBP was reported to be statistically significantly higher than for MRI without the HBP (87% vs. 65%). However, this was only assessed in a subgroup analysis. Moreover, the diagnostic accuracy was not calculated, and heterogeneity among the sensitivities of included studies was high.
Another recently published study by Pan et al. [40] compared the diagnostic performance of GA using the “conventional” LI-RADS criteria of washout with the proposed modified criteria of washout. The study concludes that including the TP hypointensity, HBP hypointensity, or both, in the conventional definition of wash-out improved sensitivity (from 71% to 81%) with slight lowering of specificity (from 97% to 93%). The study further reported significant heterogeneity among the sensitivities and specificities of studies included.
In our meta-analysis the diagnostic performances for both studies, i.e. those with and without the HBP, were high and slightly higher for studies with the HBP. However, the differences between the sensitivities proved statistically insignificant. The strengths of our study come down to the fact that according to the QUADAS-2 tool the general quality of the included studies was high as most studies gave a clear description of the participants, index test, reference standard, and flow and timing. Moreover, no statistically significant heterogeneity in the sensitivities and specificities among the included MRI studies was found, which was a disadvantage of the above-mentioned similar studies.
The authors are aware that our meta-analysis has several limitations. Most importantly, our study was conducted for all sizes of HCC lesions cumulatively, without assessing subgroups of different sizes. Some studies, however, suggest that the benefit of HBAs lies in detecting small HCC lesions [36,41]. The subject, though, requires further investigation as small lesions can be treated effectively by applying thermal ablation techniques [42].
Moreover, most included studies were retrospective, with only 4 prospective studies.
Furthermore, the study covered the period of the last 13 years, and two databases only, so it may not include all relevant studies concerning hepatobiliary phase contrast agents; however, as GA has been in use since 2004, our study covers most recent studies.
Another limitation may come down to the fact that we included studies with two different HBP contrast agents – GA (used in 12 studies) and GD (used in 1 study) – which produce some differences in imaging, as stated in the introduction, due to differences in their kinetic properties. We decided to include both contrast agents as the objective of our meta-analysis was to find out whether there is added value of the HBP irrespective of the specific agent. Special attention should be paid to GD, since in 2014 the contrast agent was shown to cause long-term brain deposition. That is why, on 10 March 2017, the Pharmacovigilance and Risk Assessment Committee of the European Medicines Agency advised suspension of the marketing authorization for GD and 3 other linear gadolinium contrast agents for intravenous injection [43,44]. Therefore, only GA for liver scans remains available out of the linear agents [45]. Although in our meta-analysis the sensitivities and specificities of studies with GD and GA appear similar, the recommendations mentioned above should be respected.
Conclusions
The diagnostic performances were high for both studies: without and with the HBP (sensitivity, specificity, and AUC of 0.83, 0.89 and 0.94 vs. 0.91, 0.85 and 0.98). We found no statistically significant differences in sensitivities between studies with and without the HBP (p = 0.1651). This was true for patients with cirrhosis or chronic liver disease, for all sizes of lesions cumulatively.