Introduction
In recent years lung ultrasound (LUS) has developed rapidly, and it is gaining growing popularity in various scenarios. It is popular among clinicians but with some resistance in the radiological community. There are constant attempts to introduce it to new fields. In addition, knowledge regarding the lungs has been augmented by the recent COVID-19 pandemics.
The topic of LUS seems dispersed. There are many successful small studies, but the literature is missing large, randomised studies or meta-analyses.
In the first part of this review (previous paper) we discuss lines, signs and phenomena, profiles, some applications, and misconceptions. The aim of the second part of the review is mainly to discuss the usefulness of some advanced applications of LUS, including lung elastography, lung spectroscopy, colour and spectral Doppler, contrast-enhanced ultrasound of lung, speckled tracking of pleura, quantification of pulmonary oedema, predicting success of talc pleurodesis, asthma exacerbations, detecting chest wall invasion by tumours, lung biopsy, estimating pleural effusion volume, predicting mechanical ventilatory weaning outcome, and ultrasound of the diaphragm. Those sophisticated techniques were enthusiastically introduced by several authors. However, in clinical practice, they require critical verification.
Lung elastography
Interstitial lung diseases
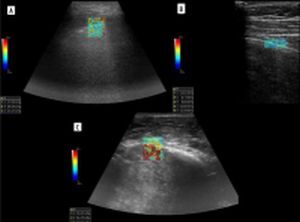
Zhang et al. developed a lung ultrasound surface wave elastography (LUSWE) technique for assessing superficial lung stiffness [1]. This method uses an external shaker to generate surface waves. LUSWE had a sensitivity of 92% and a specificity of 89% for differentiating between no fibrosis and fibrosis in 4-point grading scale, collectively [2]. However, the sensitivity dropped to 50% for differentiation between grades 0-2 and 3, which makes it less useful in clinical grading of fibrosis. Moreover, selection of cut-off values at 200 Hz frequency of vibration complicates comparison with other elastography methods. The authors tried to further develop a quantitative method for measuring the changes of lung surface wave speed for assessing disease progression of interstitial lung disease (ILD), but the results and method itself are not very convincing for us in such a scenario [3,4]. In another study, Huang et al. used shear wave elastography (2D-SWE) in connective tissue disease-related lung disease compared to controls [5]. They found cut-off values of 15.81 kPa and 2.31 m/s to distinguish between the 2 with rather low sensitivity of 65%/59% and specificity 67%/73%, respectively. 2D-SWE of normal and fibrotic lung are shown in Figures 1A and 1B, respectively. In this study, there was no significant correlation between the SWE values and the number of B-lines or the high-resolution computed tomography (HRCT) and pulmonary function test results, respectively.
Subpleural lung lesions – malignant vs. benign
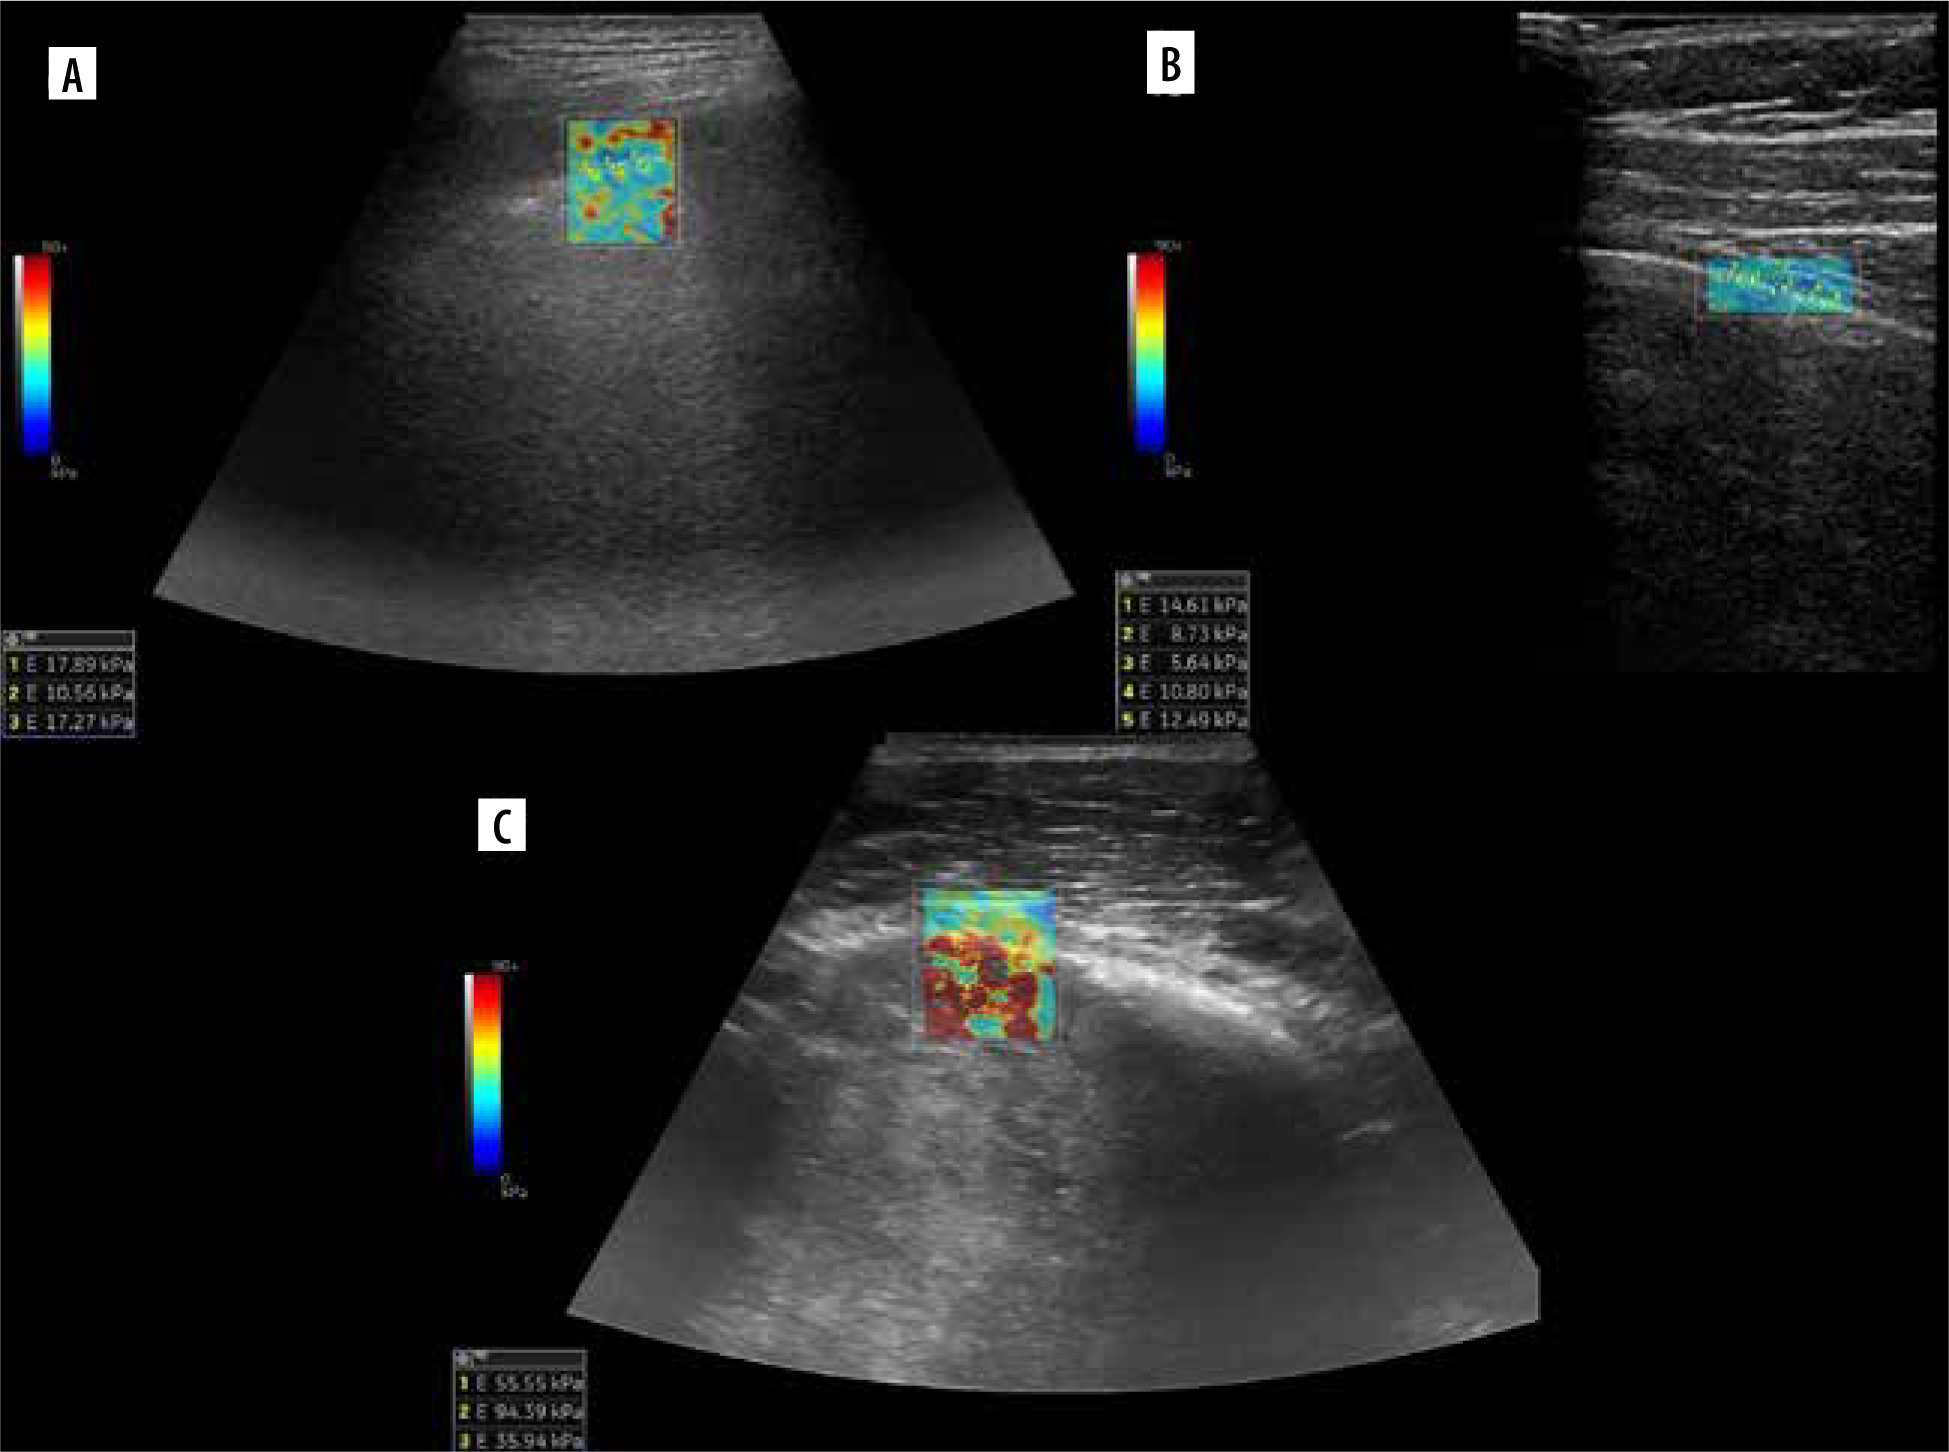
Studies investigating elastography of benign and malignant subpleural lung lesions with different techniques are summarised in Table 1 [6-11]. Particularly, the research of Kuo et al. is interesting because it further divides malignant and benign lesions into multiple groups [9]. The results of their study are presented in Figure 2. On the other hand, in the study of Quarato et al., surprisingly, non-necrotic pneumonias had higher elasticity than carcinomas [10]. An interesting observation from their study was the statistically significant difference between community-acquired pneumonia and pneumonia refractory to standard treatment, with the latter producing greater elasticity values (mean 30.45 ± 11.78 kPa vs. 19.40 ± 6.45 kPa), probably due to fibrotic component in chronicity. Moreover, elasticity values in this study are very low, which might be caused by technique (point-SWE). In a study by Sperandeo et al. lymphoma received a score of 2/5, of mostly soft lesion, in all 4 cases – probably due to necrosis [11]. The study used strain elastography.
Table 1
Studies investigating elastography of benign and malignant subpleural lung lesions.
Figure 2
Box plot showing elasticity of the different benign (n = 111) and malignant lung lesions (n = 243). A) A significant difference was noted between different types of benign lesions (p = 0.013). B) Whereas no significant difference was discovered between different types of malignant lesions (p = 0.201). ADC – adenocarcinoma, SCLC – small cell lung carcinoma, SqCC – squamous cell carcinoma, NSCLC-NOC – non-small cell lung carcinoma not otherwise specified, MLC – metastatic lung cancer. Box plots show median and interquartile range (IQR); whiskers represent 1.5 IQR and outliers are indicated [Reproduced with permission of the c ERS 2023: from European Respiratory Journal 57 (3) 2002347; DOI: 10.1183/13993003.02347-2020 Published 25 March 2021. Kuo YW, Chen YL, Wu HD, et al. Application of transthoracic shear-wave ultrasound elastography in lung lesions]
Elastogram of malignant lesion in Figure 1C.
Other applications
Pleural effusions – malignant vs. benign
Pleural elastography was initially described by Hou et al. [12] and later by Jiang, Hou, et al. [13] where they collected a larger study group. In their studies, they compared elasticity of pleura (if thickened, in the thickened area) in various malignant and non-malignant pleural effusions and found optimal cut-off value of 47.25 kPa with sensitivity of 83.64% and specificity of 90.67%, with malignant lesions being stiffer.
Pulmonary oedema
A small study was published by Wiley et al., which included 14 followed-up patients with pulmonary oedema. The authors correlated LUSWE with the number of observed B-lines, which indicate extravascular lung water and fluid balance [14]. On follow-up, a statistically significant reduction in surface wave speeds compared to the baseline values was observed.
Pneumothorax
Bandelli et al. described “elasto-lung point” in strain elastography [15]. This phenomenon described pneumothorax as a rigid signal on elastography, compared to normal lung, which has soft or mixed signal. Interestingly, patients suffering from emphysema or bullous lung disease were excluded from this study.
Lung spectroscopy
In our previous paper, we discussed B-lines and stated that their true variance is yet to be discovered. Since the time of writing of that paper, an interesting study was published by Demi et al. [16]. They state that B-line is not an artifact but a pathology footprint and anatomical information. We will stay with artifact nomenclature, but the paper itself is worth reading if you are interested in the physics behind LUS phenomena. Two of the authors of this paper went forward in exploring true B-line variance, called lung spectroscopy [17]. In their study, they assessed mean native frequency, mean bandwidth, and mean total intensity (average values of B-lines observed in a patient) of B-lines, which allowed them to differentiate between fibrosis and other diseases with B-lines, to a degree, with various sensitivities and specificities, using 2 classifiers.
Colour and spectral Doppler
Bronchial and pulmonary artery branches, pulmonary veins
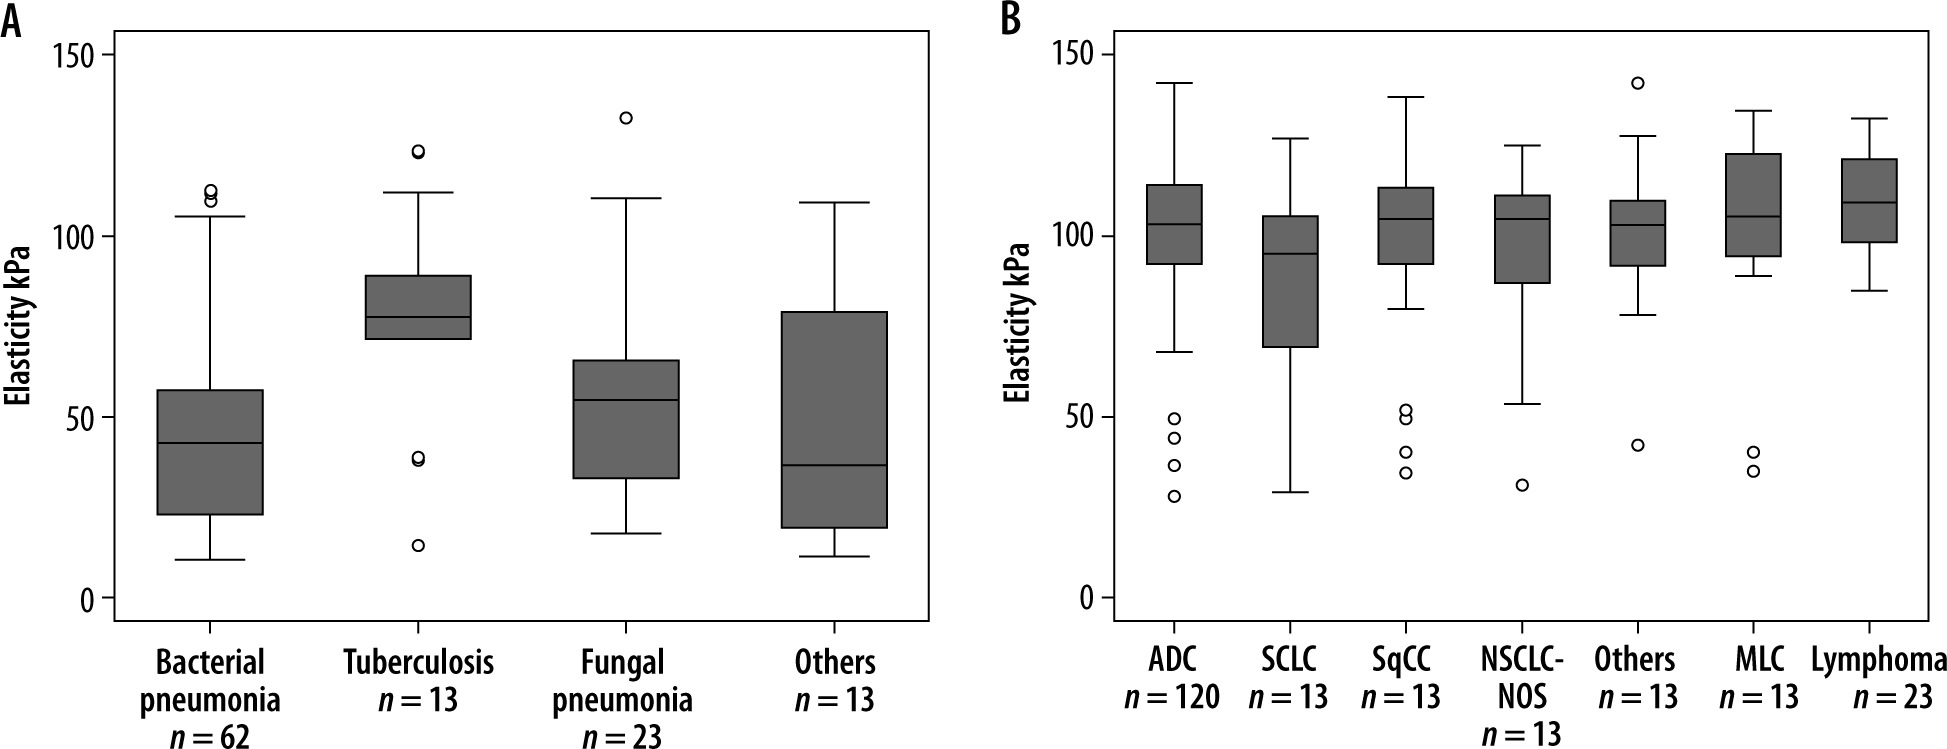
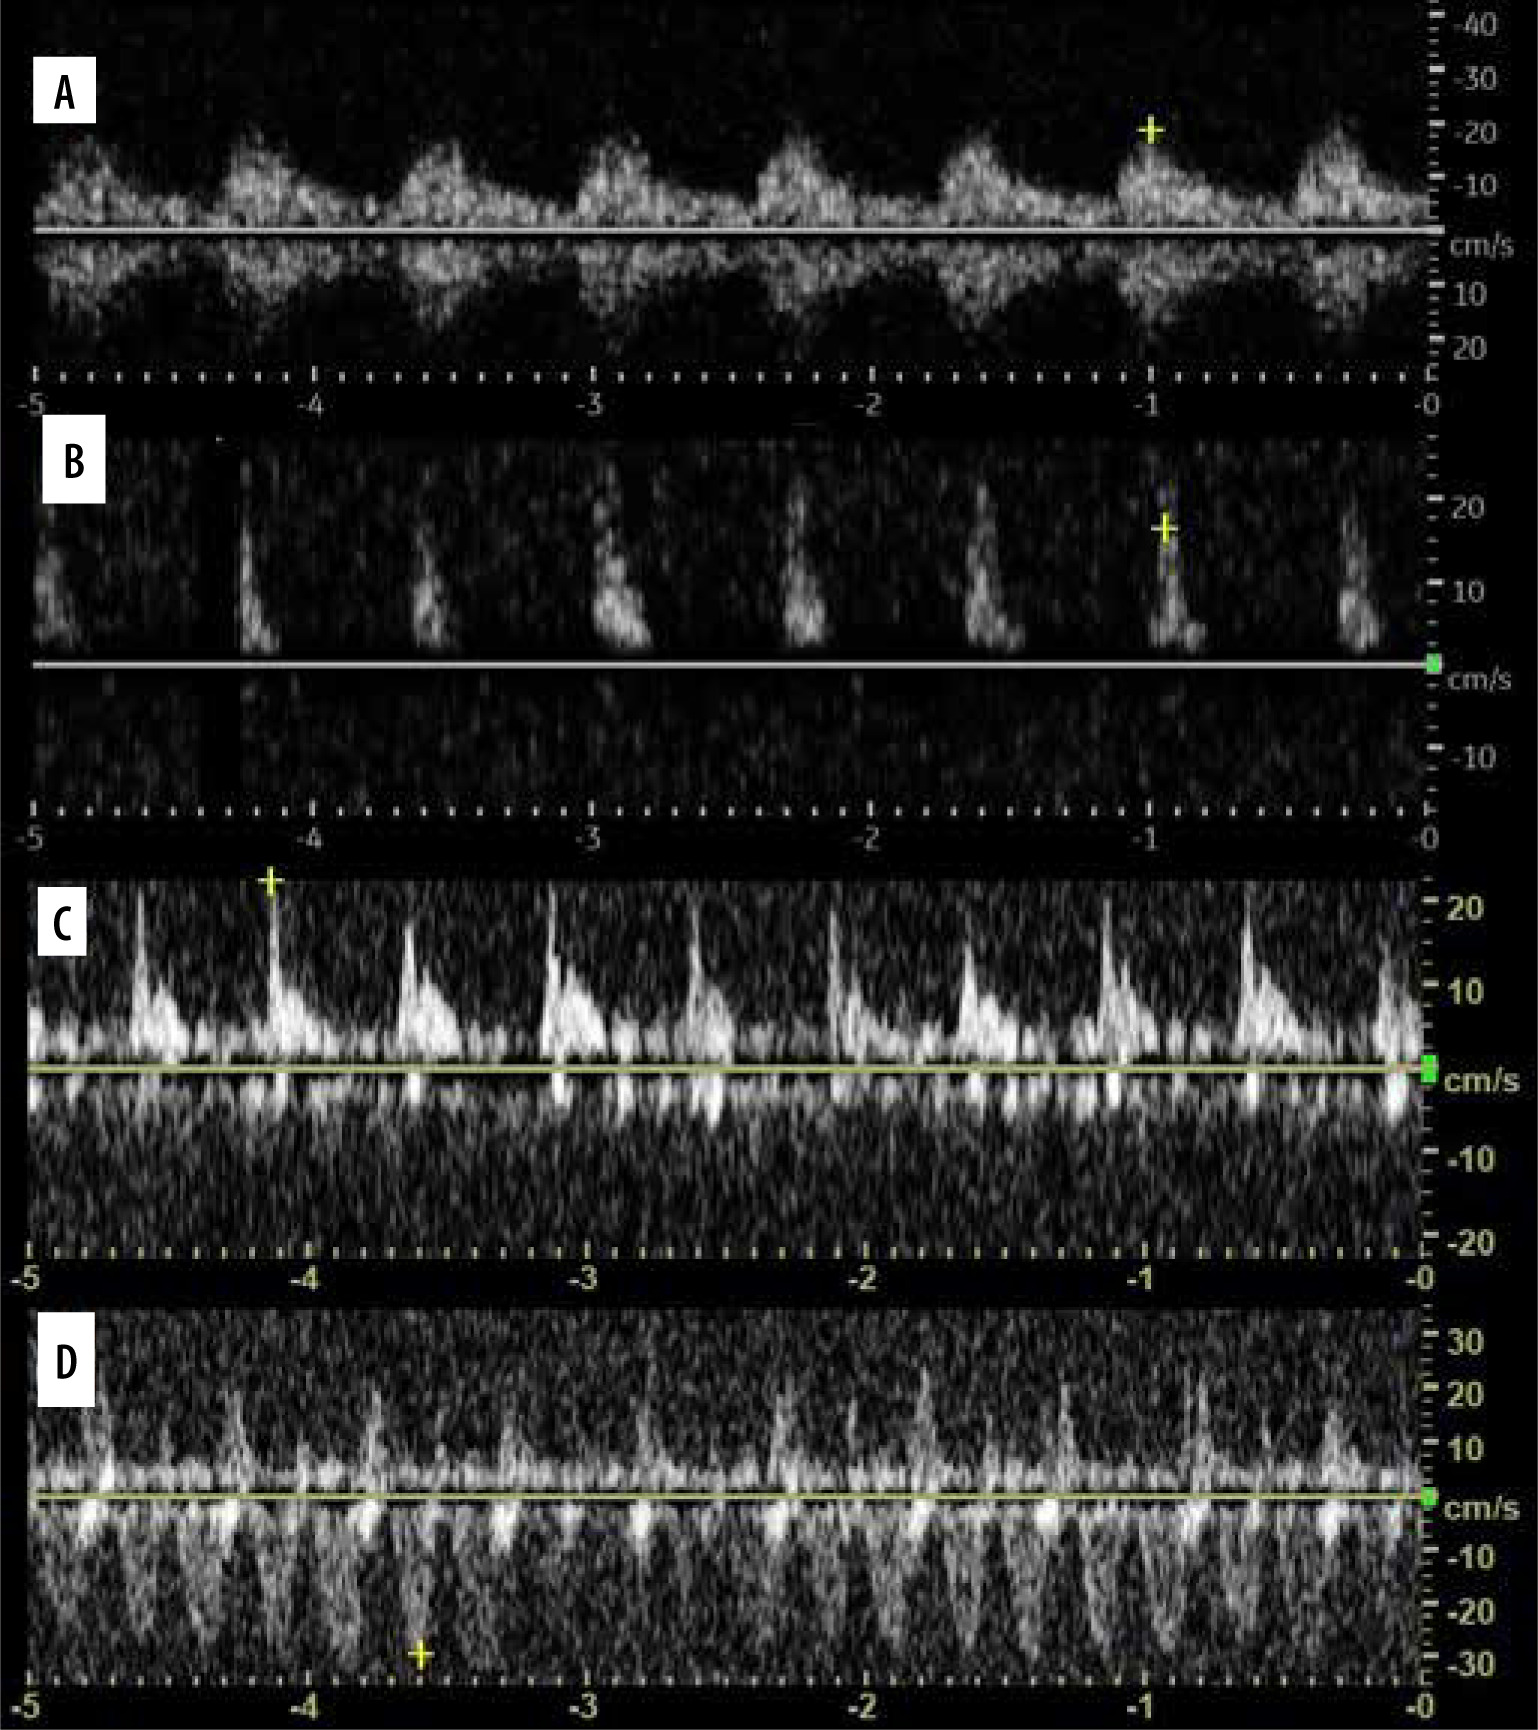
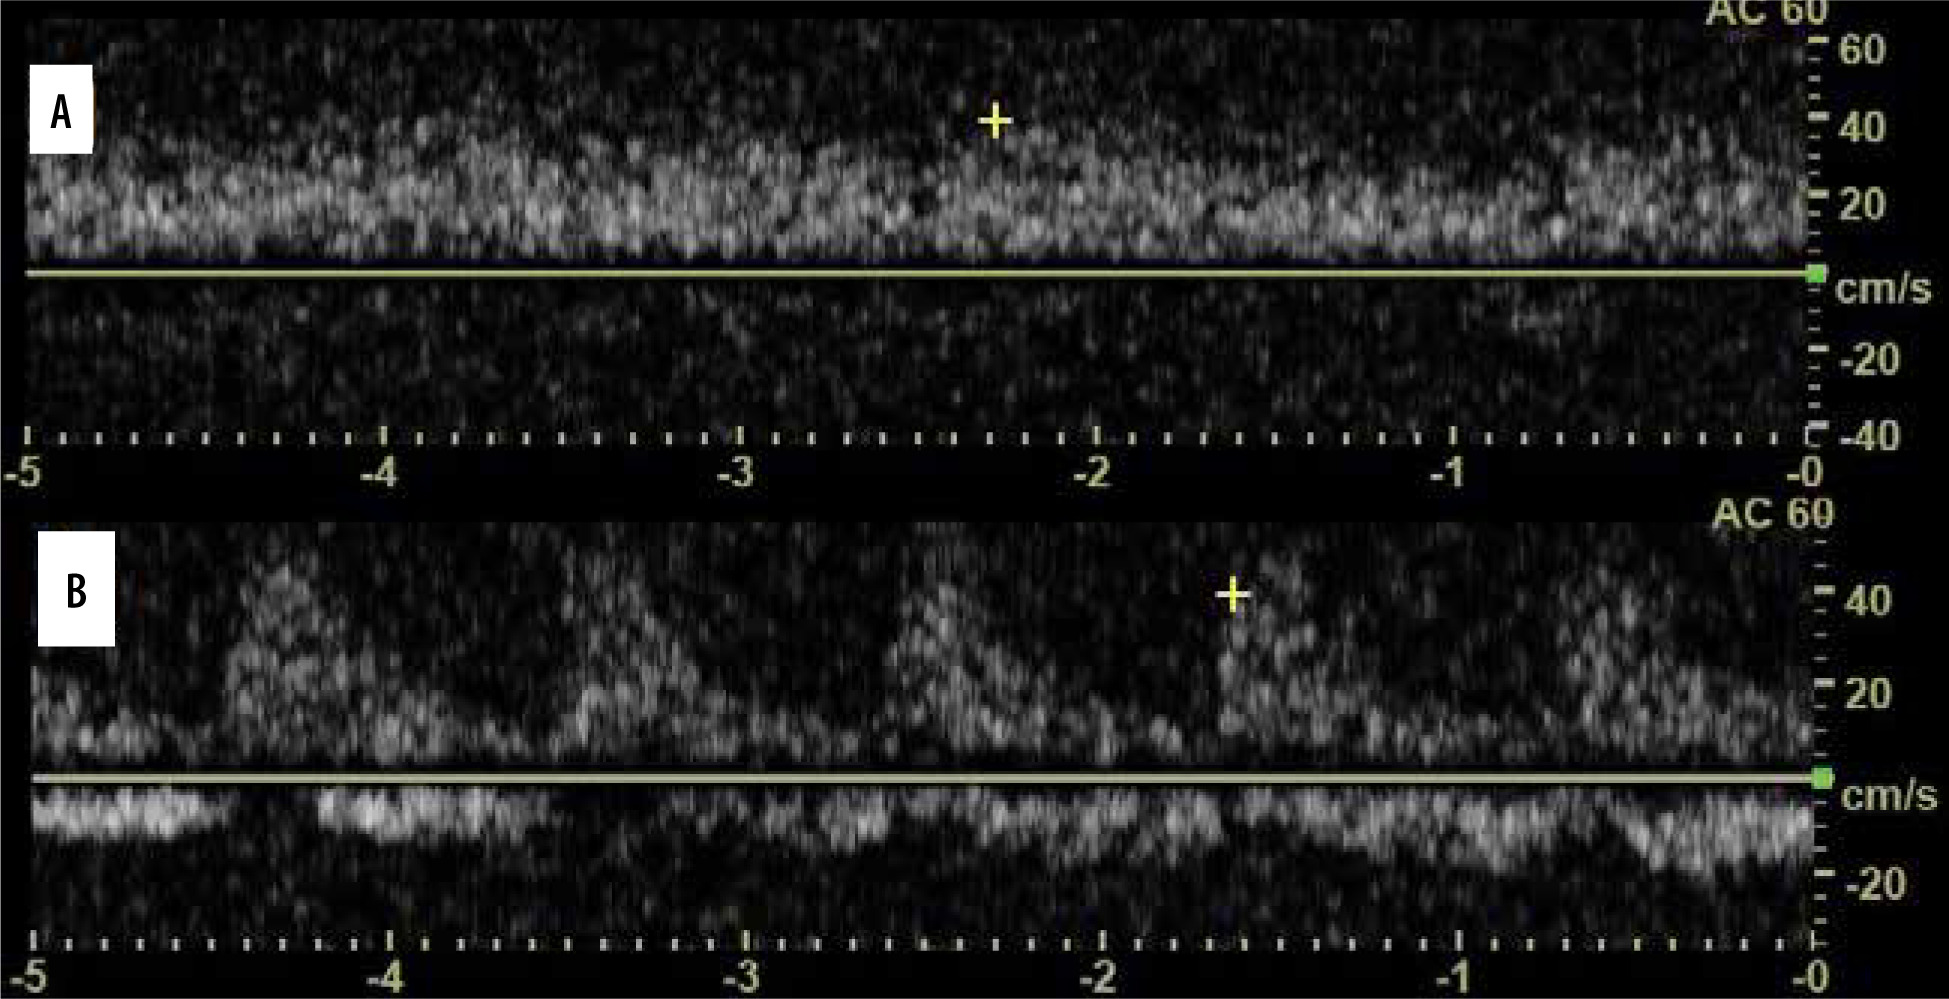
Spectra were studied in atelectasis, with pulmonary artery being of higher resistance and pulsatility, and lower velocity than bronchial artery, probably owing to hypoxic vasoconstriction [18]. In general, there is low resistance and low pulsatility in bronchial artery compared to high resistance and high pulsatility in pulmonary artery [19]. Pulmonary veins may also be visualised with their characteristic spectrum. Spectra of pulmonary arteries, right ventricle outflow tract, and veins were studied in echocardiography [20-23]. We believe that these data (spectral changes of pulmonary artery in hypertension, venous spectrum changes in various conditions) may be extrapolated to findings in peripheral lung vessels.
Spectra of pulmonary and bronchial vessels are presented in Figure 3A-D.
Pneumonia, consolidations, tumours
Xirouchaki et al. stated that the tree-like pattern of vessels accompanying the bronchial tree, which is visible until the periphery, was typical for pneumonia [24]. This may not be true, because a similar pattern can also be seen in atelectasis. However, vessels in atelectasis should be more crowded, parallel, and sometimes it is clearly visible, other times not. Therefore, differentiation between these 2 pathologies based solely on Doppler pattern is usually not possible.
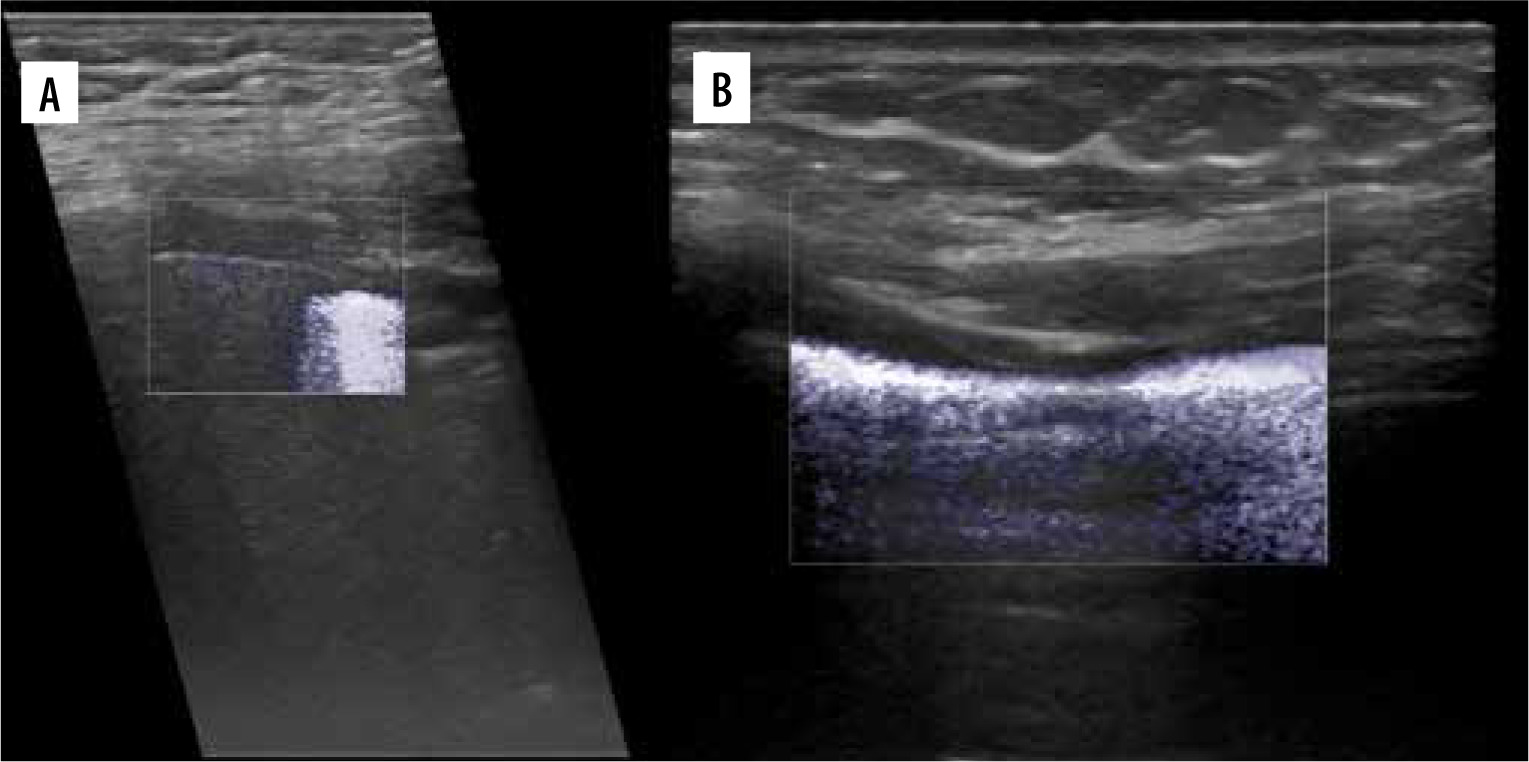
Some studies assessed flow patterns on spectral Doppler, and in part of them the problem is that they did not take into account that 2 types of arteries are present in the lung, i.e. pulmonary and systemic [25]. In malignancy, both pulmonary flow patterns may be observed [26]. Pulmonary venous pattern is also possible, and sometimes no flow is visible. Yuan et al. stated that resistive (RI) and pulsatility indices (PI) are lower in cancer [27]. This may be explained by fact that cancer is in most cases mainly supplied by the bronchial artery or may be the expression of angiogenesis [28]. Hsu et al. found that PI and RI in small cell lung cancer are lower than in non-small cell lung cancer. One Doppler spectrum often indicates neovascularity and is almost exclusively found in malignant lesions (monophasic, constant flow resembling spectrum of peripheral vein, Figure 4A) [29]. However, sometimes compressed pulmonary veins may give rise to a similar spectrum [30]. It sometimes happens in collapsed lung, distal to central tumour. Pulsatile flow within cancer can be seen in Figure 4B. Hsu et al. also described pulmonary artery vessel signal sign (presence of Doppler signal from pulmonary artery branch within the lesion, based on bronchial supply of tumours) [31]. In their study, which included 125 lung adenocarcinomas with lobar consolidation, only 2% of cases were positive for this sign. On the other hand, in the literature one may find that encasement or displacement of the pulmonary artery by the tumour is indicative of malignancy [32]. Currently, Doppler is not used to distinguish between malignant and benign lung lesions, e.g. in infarcts, vascular flow is usually absent. However, in some cases of infarct, bronchial flow may be enhanced dramatically [33].
Other applications
Lung sliding
Power or colour Doppler may be used to visualise lung sliding, called “power slide” [34]. It is simply Doppler signal on the lung surface with pleural motion. From our experience, it does not always work, and B-flow, although not reported in the literature, is far better in reassuring itself for lung point (Figure 5A, B).
Discriminating between small effusion and pleural thickening
Wu et al. found that “fluid colour sign”, which is movement of fluid with the respiratory or cardiac cycle, is more specific than B-mode ultrasound in differentiating minimal pleural effusions from pleural thickening or no effusion [35,36]. Pulse repetition frequency (PRF) must be set low, and besides that we used default Doppler settings. Fluid colour sign can be seen in Figure 6.
Lung sequestration
Doppler sonography may be used to confirm lung sequestration, but sometimes it might be difficult [37]. Visualising vascularity branching from the aorta results in diagnosis.
Guiding needle biopsy
Compared with B-mode, diagnostic results and associated complications are similar, but Doppler ultrasound allows easier identification of major vessels and the needle tip or shaft [38].
Contrast-enhanced ultrasound of the lung
Contrast-enhanced ultrasound (CEUS) enhances visualisation of slow-flow vessels, including microcirculation. It may also be helpful in characterisation of lung lesions by presenting enhancement pattern as well as by measurement of specific flow parameters, e.g. wash-in and wash-out times, time-to-peak enhancement, and overall enhancement time. In the paediatric population, CEUS has been used to assess the extent of necrotising pneumonia, loculations in septated pleural fluid collections, and monitoring response to treatment of pleural-based malignant lesions [39,40]. In assessing the extent of necrotising pneumonia CEUS clearly shows non-enhancing areas within inflammatory consolidation, establishing diagnosis. In loculations in septated pleural fluid collections CEUS can visualise the catheter tip (contrary to greyscale ultrasound) and show that it is located in a single loculation, establishing the need for urokinase therapy.
In monitoring antiangiogenic therapy, the time to peak, rate of enhancement, total AUC, AUC during wash-in, and AUC during wash-out were measured. The decrease in tumour peak enhancement, rate of enhancement, and AUC during wash-in were significantly associated with longer time to progression. The study was small (13 patients), so there is a need for investigation of these findings in a larger population.
Many more studies on CEUS were published based on adult populations. In pulmonary embolism, acute infarcts usually present no enhancement, which is obvious. However, adequate collateral bronchial artery supply or sufficient fibrinolysis may result in inhomogeneous or even homogeneous contrast enhancement despite the embolic nature of the primary entity [41]. CEUS was also reported as a useful tool to visualise microembolism in COVID-19 pneumonia [42].
In a study by Görg et al., CEUS was able to discriminate between pleuropneumonia and other pleural-based lesions [43]. Pleuropneumonia had short (1-6 s) time to peak enhancement and a marked total enhancement during arterial and parenchymal phase. Other lesions, including pulmonary embolism or infarction, lymphomas, metastases, and granulomas, had either no enhancement or delayed enhancement to a reduced extent. On the other hand, in compressive atelectasis, short time to peak enhancement and significant extent of enhancement was observed. The enhancement persisted after the contrast agent was washed out from the blood pool as compared to the spleen [44]. In obstructive atelectasis, there may be both areas of short and delayed time to peak enhancement and varying extent of enhancement.
The main clinical application of CEUS in oncological cases is to discriminate between obstructive atelectasis and the obstructing tumour, which is often characterised by quicker wash-out. This may allow for CEUS-guided biopsy, not only by delineating the malignant lesion, but also by showing viable tissue for obtaining a valid specimen. Preliminary data by Wang et al. showed that CEUS can identify necrotic areas within lesions, and thereby may play a useful role in imaging-guided biopsy [45]. In a larger study, inhomogeneous enhancement in the first 10-15 s with early wash-out and absence of linear hyperechogenic lines due to pulmonary arterial enhancement and rapid wash-out in the early phase were suggestive of malignancy, while homogeneous enhancement in the first 10 s with rapid wash-out in the late phase and the presence of enhancement of pulmonary arteries favoured pneumonia [46]. However, a study by Sperandeo et al., who included over 700 patients, resulted in no difference between community-acquired pneumonia and lung cancer regarding the time of contrast enhancement appearance, disappearance, and duration or contrast distribution [47] Similarly study of Quarato et al. on 317 patients concluded that contrast enhancement arrival time may not discriminate between malignant and benign lesions [48].
Interestingly, in the case of cystic echinococcosis, CEUS showed annular enhancement mimicking superinfected cyst, while in fact it was not [49]. This feature is observed in such cysts in the liver without superimposed infection [50]. CEUS differentiating necrotising pneumonia and complex pleural fluid can be seen in Figure 7 [51].
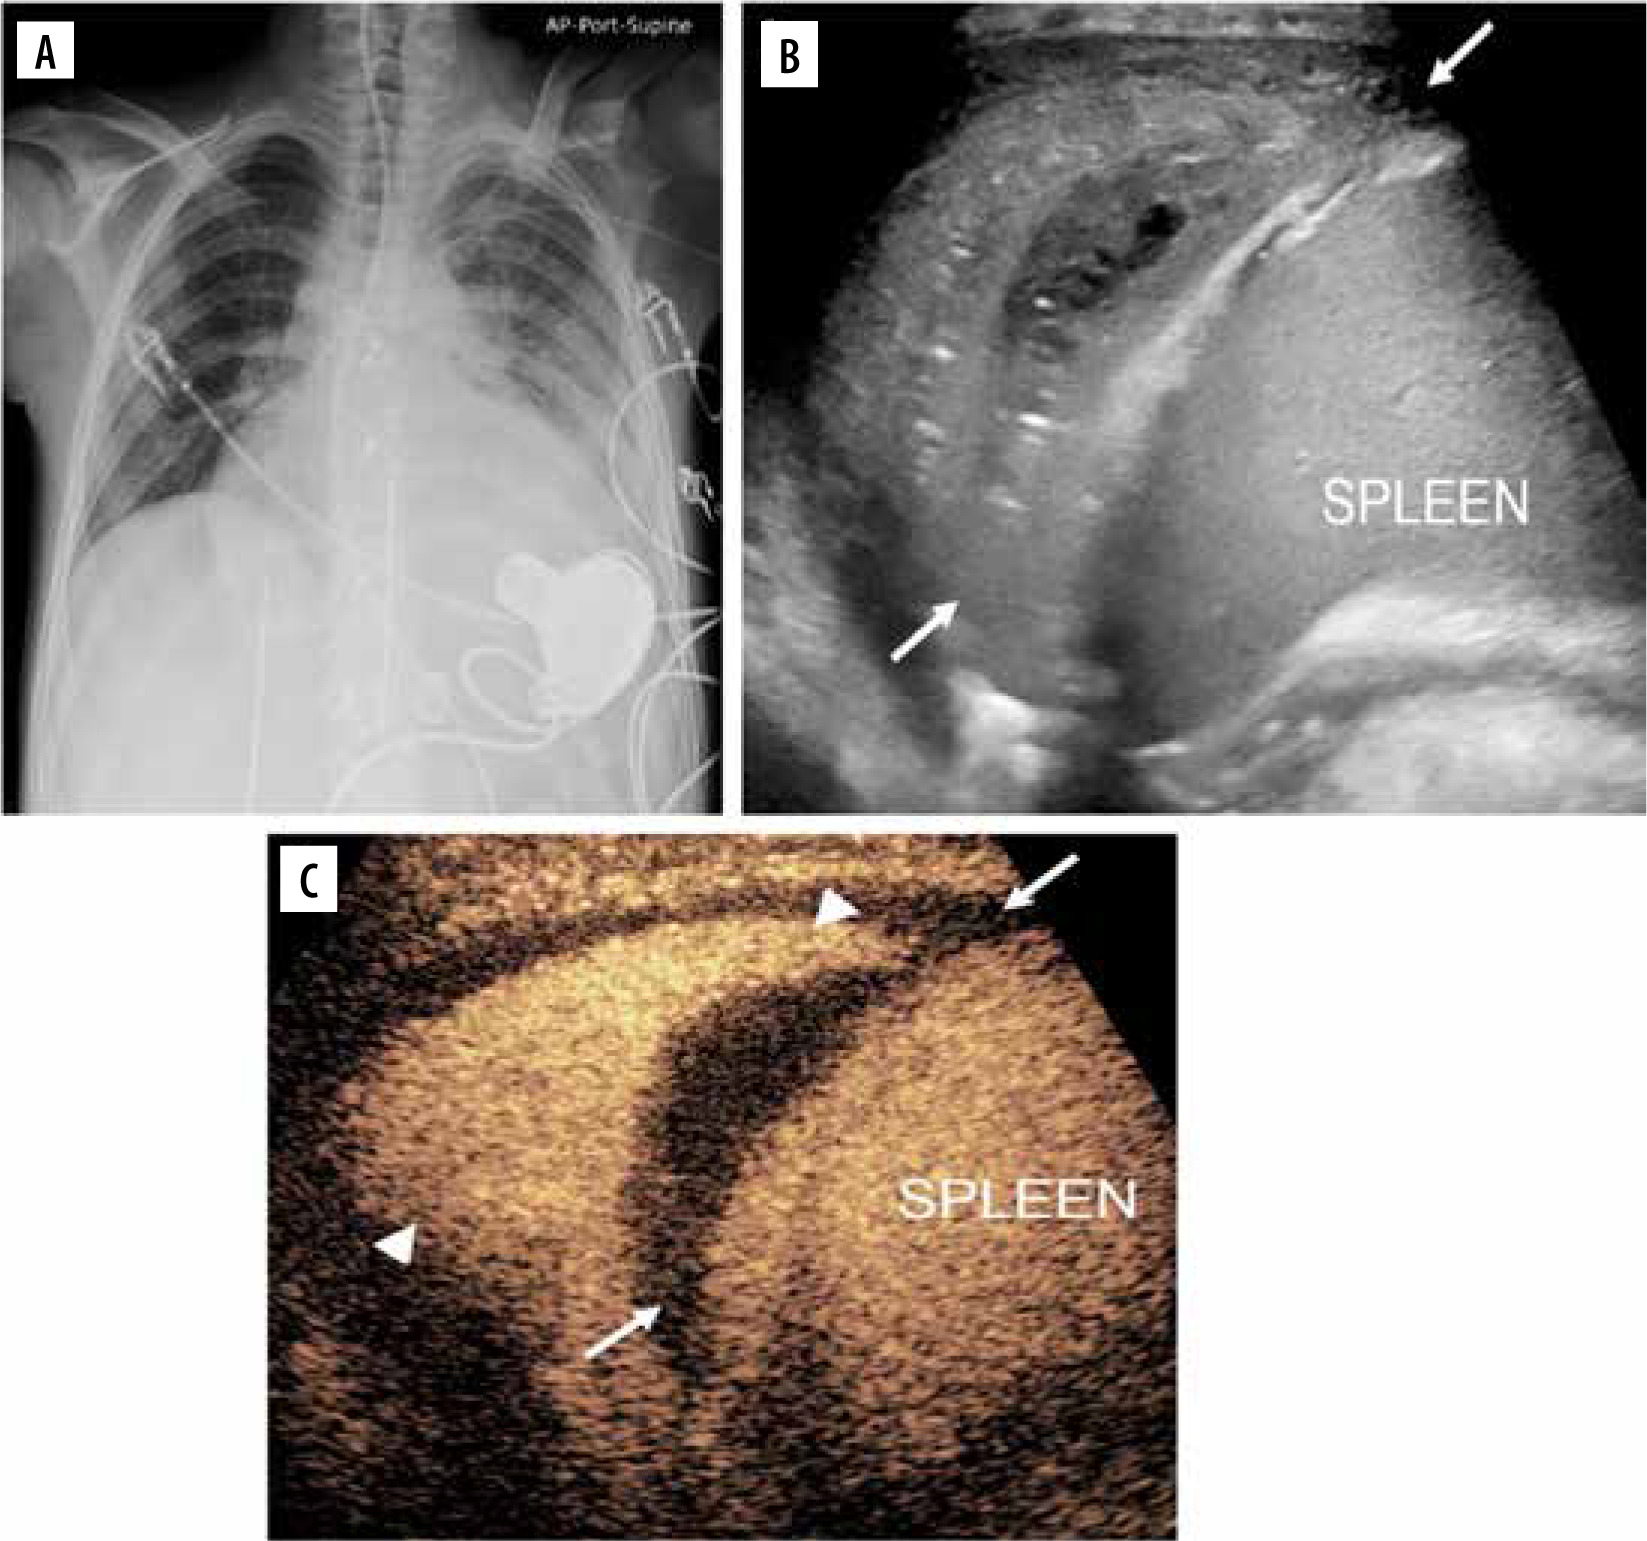
Figure 7
Lung infection and clinical concern for necrotising pneumonia versus complex pleural fluid in 15-year-old boy with heart failure requiring left ventricular assist device, presenting pre heart transplant. A) Posteroanterior chest radiograph demonstrates cardiomegaly with only minor left basilar ill-defined opacities. B) Grey-scale US, coronal view of the left lung base shows abnormal appearance of the left lung base (arrows) with consolidated lung parenchyma containing some scattered air foci. Ill-defined hypoechoic area is noted in the lung base. It is difficult to differentiate whether this represents an abscess within the lung parenchyma or an adjacent complex pleural effusion. C) Contrast-enhanced ultrasound (CEUS) in contrast-only mode, coronal plane, shows homogeneously enhancing lung parenchyma (arrowheads) in the left lung base and non-enhancing pleural fluid (arrows) surrounding the left lung. CEUS findings excluded the diagnosis of necrotising pneumonia and confirmed the presence of pleural empyema [Reproduced from Rafailidis V, Andronikou S, Mentzel HJ, et al. Contrast-enhanced ultrasound of paediatric lungs. Pediatr Radiol 2021; 51: 2340-235. under CC-BY-4.0 license (https://creativecommons.org/licenses/by/4.0/)]
Speckled tracking of pleura
There were 2 studies using speckled tracking of pleura to quantify lung sliding. The first used it for diagnosis of pneumothorax [52]. The second used it to distinguish pulmonary oedema in acute heart failure from infection with B-lines, like COVID-19 pneumonia [53]. In our opinion, although it takes time to learn to distinguish abolished lung sliding from normal lung sliding, there is no need for such sophisticated techniques and quantification.
Ultrasound of extravascular lung water in pulmonary oedema
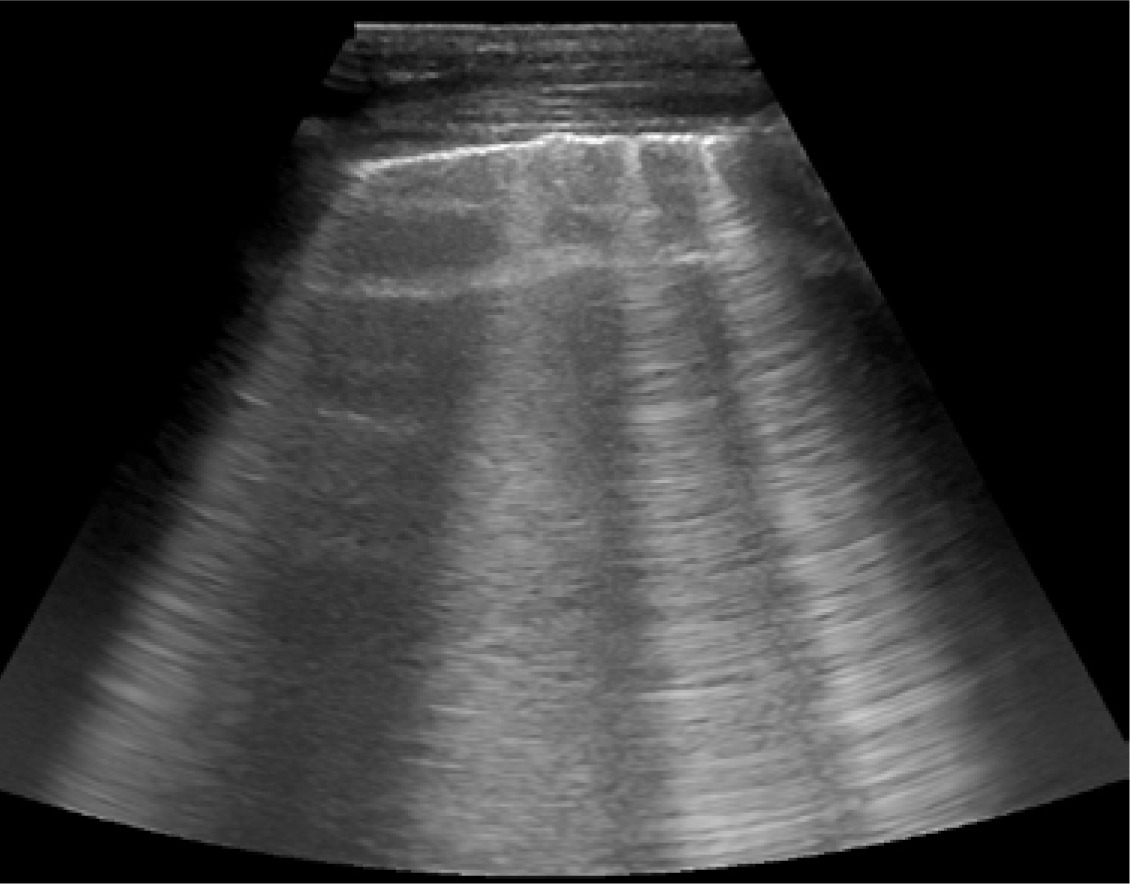
In progressing congestion, lung changes from “black lung”/A-lines (no extravascular lung water – EVLW) through single B-lines, to numerous B-lines (interstitial oedema, Figure 8), and finally “white lung”/consolidation, which indicates alveolar oedema. LUS had 94% sensitivity and 92% specificity in differentiating acute cardiogenic pulmonary oedema from non-cardiac causes of acute dyspnoea [54]. In a study by Picano et al., semi-quantitative estimation of EVLW was achieved by counting the number of B-lines at the antero-lateral chest wall in 28 regions [55]. They introduced a 4-point scale to quantify EVLW. A score of 0 presented: ≤ 5 B-lines (EVLW absent), a score of 1: 6-15 (mild degree), a score of 2: 16-30 (moderate degree), and a score of 3: > 30 (severe degree).
Predicting success of talc pleurodesis
In a randomised controlled trial, in the intervention group, daily LUS examination for lung sliding in 9 regions was done to derive an adherence score: 1 point – present, 2 points – questionable, and 3 points – absent [56]. The lowest possible score was 9 (preserved sliding) and the highest was 27 (complete absence of sliding). The chest tube was removed if the score was more than 20. As opposed to control group, it resulted in a shorter hospital stay without reducing the success rate of the procedure at 3 months.
Asthma exacerbations
In a study by Attanasi et al. LUS was positive in 83.1% of asthmatics who were admitted to an asthma outpatient clinic [57]. LUS had higher sensitivity than spirometry in identifying asthma exacerbation (0.83 vs. 0.40). Findings were multiple B-lines in 81.5% of cases, micro-consolidations in 51.9%, macro-consolidations in 18.5%, pleural thickening in 44.4%, and pleural effusion in 35.2%. In a study by Dankoff et al., who included children with asthma presenting with respiratory distress admitted to the emergency department (ED), it was found that positive LUS findings were associated with increased ED stay, increased use of antibiotics, and higher admission rate [58]. Findings were positive in 45% of patients. B-line pattern was found in 38%, consolidation in 30%, and pleural line abnormalities in 12%.
Marzook et al. studied asthmatics at baseline, without exacerbation, and found that 19.2% of them had positive LUS findings, including B-lines in 80%, small (mostly < 1 cm consolidations) in 80%, and pleural line anomalies in 10% [59]. In a study by Attanasi et al., in school-aged children with wheezing, LUS was positive in 38.2% of patients [60]. It was positive in 100% of cases with pneumonia and in 57.7% of cases with asthmatic bronchitis. Overall, it seems that LUS findings in asthma patients are more common in exacerbations, but some of them are also present at baseline in a fraction of subjects. Importantly, lung sliding may be abolished in asthma exacerbation, so care must be taken not to confuse it with pneumothorax, in which also lung point should be present [61]. An interesting case was published in which vertical displacement of pleura was proposed as method of bronchospasm evaluation [62]. It seems to be associated with accessory muscle recruitment or even bronchospasm, but larger studies are necessary to confirm the feature.
Detecting chest wall invasion by tumours
Few studies assessed utility of LUS in detecting chest wall invasion by tumours.
A study by Suzuki et al. on 19 cases showed 100% sensitivity and 98% specificity of LUS compared to 68% sensitivity and 66% specificity of computed tomography (CT) [63].
A study by Bani et al. on 23 cases showed 89% sensitivity and 95% specificity of LUS compared to 42% sensitivity and 100% specificity of CT [64]. Importantly, there were 3 false positives and 3 false negatives with LUS, and 15 false negatives with CT.
A study by Sripathi et al. on 22 cases added colour Doppler to the evaluation, resulting in 95.6% sensitivity and 100% specificity of LUS compared to 85.7% sensitivity and 66.7% specificity of CT [65].
LUS vs. CT for percutaneous lung biopsy
Some studies compared LUS and CT in assisting percutaneous lung biopsy.
Lee et al. found that ultrasound (US)-guided biopsy was associated with fewer complications than CT-guided biopsy – 7% vs. 24%, respectively (in general, not focusing on subpleural lesions) [66].
They also found that the procedure time was shorter (31 ± 16 min vs. 45 ± 26 min) and fewer passes were needed (3.1 ± 1.8 vs. 4.4 ± 1.9) with a trend toward improved pathologic sample adequacy (98 vs. 93%). There were fewer complications for larger lesions (31-50 mm), but pathologic adequacy was better and procedure time shorter for smaller lesions (10-30 mm).
Jarmakani et al. studied chest wall, mediastinal, pleural, and lung biopsies in both methods [67].
Diagnostic samples were obtained in 98% of US procedures and 87% of CT procedures. Pneumothorax requiring treatment took place in 2% of US procedures and 5% of CT procedures. The time of procedures was comparable (38 min vs. 40 min). The average lesion size was greater for CT, which might partially explain the lower diagnostic yield (higher percentage of necrosis in larger lesions).
El-Shimy et al. compared peripheral lung, pleural, and mediastinal biopsies in both methods [68].
They found 100% sensitivity and specificity of CT. US had sensitivity and specificity of 91.7% and 89.4% for pleural lesions, 90.7% and 91.4% for pulmonary lesions, and 72.7% and 88.7% for mediastinal lesions.
Rates of pneumothorax and haemorrhage were both 4% for US and 6% for CT.
Mychajlowycz et al. studied subpleural or pleural lesions in both methods [69].
They found similar sample adequacy (88% for US, 92% for CT) and similar rates of pneumothoraces (12% vs. 15%). Mean lesion maximum diameter and length of pleural contact was greater for US biopsies, which might explain the above. They also found that the procedure time was shorter (29.5 ± 16.4 min vs. 37.6 ± 19.5 min) and that CT used fewer needle passes (3.5 ± 1.1 vs. 3.1 ± 0.8).
Khosla et al. assessed pleural-based lesions in both methods. US had diagnostic yield of 92.1%, while CT had 91.8% [70]. The complication rate was lower in the US group: 1.1% vs. 23.3%.
Sperandeo et al. assessed 762 US-guided biopsies for subpleural lesions and found diagnostic accuracy of 93.04% [71]. Complications were pneumothorax not requiring chest tube insertion (0.79%) and self-limited haemoptysis (0.26%).
Park et al. studied 572 US-guided biopsies for subpleural lesions and further divided it into groups depending on size (≤ 2 cm, 2-5 cm, > 5 cm) [72]. In general, the sample adequacy was 96.2%, and it was higher in larger lesions. The general complication rate was 3.3% for pneumothorax and 8% for haemorrhage. The smaller the lesion size, the more likely complications were to occur. Procedure time was relatively short, on average 10.0 ± 4.7 min. In general, they concluded that US is a safe and effective approach, even for small lesions. This is true, but lesions in basal segments might be challenging owing to respiratory motion if the patient fails to cooperate well.
Estimating pleural effusion volume
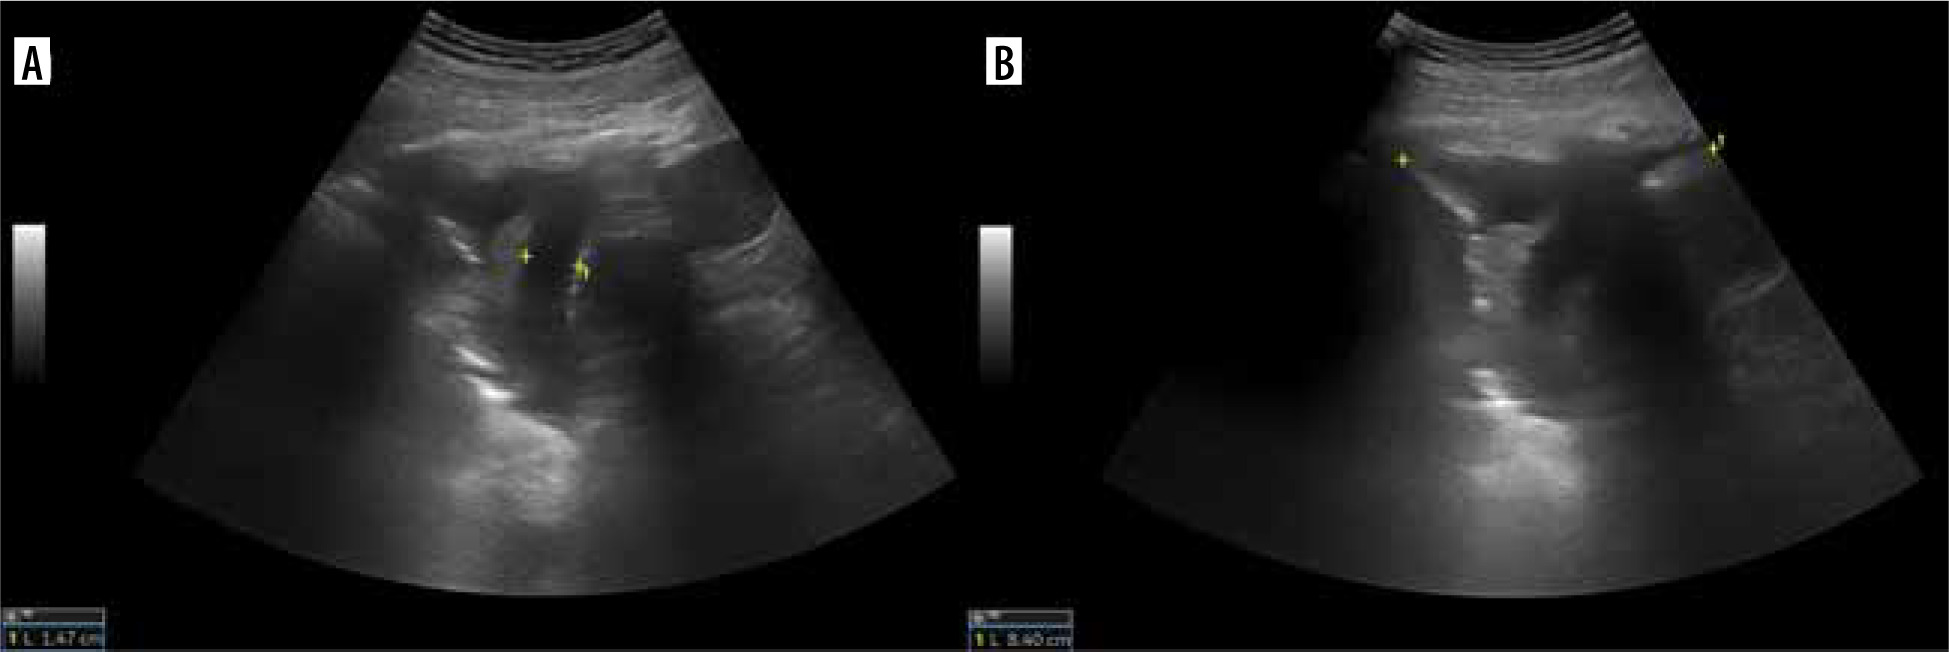
Ultrasound is often used as assistance in draining effusions with chest tubes. It can also estimate pleural effusion volume. There are various formulas. Hassan et al. validated the accuracy of formulas published by Goecke and Schwerk, Balik et al., Usta et al., and Remérand et al. [73-77]. They found that the most accurate formula for predicting effusion volume is (H+D) × 70, where H is the lateral height of the effusion and D is the distance between the diaphragm and the base of the lung (Figure 9). The intra-class correlation coefficient (ICC) was 0.83. Another accurate formula they found is H × 100 (ICC = 0.79).
Predicting mechanical ventilatory weaning outcome
To predict weaning outcome, LUS at 6 areas on each side of the chest is performed [78]. In each area, a score is given from 0 to 3. A score of 0 is assigned if there are no pathologic findings. A score of 1 is assigned in cases of moderate loss of aeration, expressed by multiple B-lines originating from pleural line or sub-B lines originating from small consolidations. A score of 2 is assigned in cases of severe loss of aeration expressed by confluent B-lines occupying the whole intercostal space. Ans a score of 3 is assigned in cases of large consolidation. A maximum of 36 points are assigned, with a minimum score of 0. Different cut-off values are reported for either success or failure of weaning; they are summarised in Table 2 [79-82]. LUS is just part of the protocols; another part is diaphragm ultrasound.
Ultrasound of the diaphragm
The diaphragm may present normal function, reduced mobility/weakness, or loss of function/paralysis. Ultrasound may be used to monitor excursion, thickness, and thickening [83].
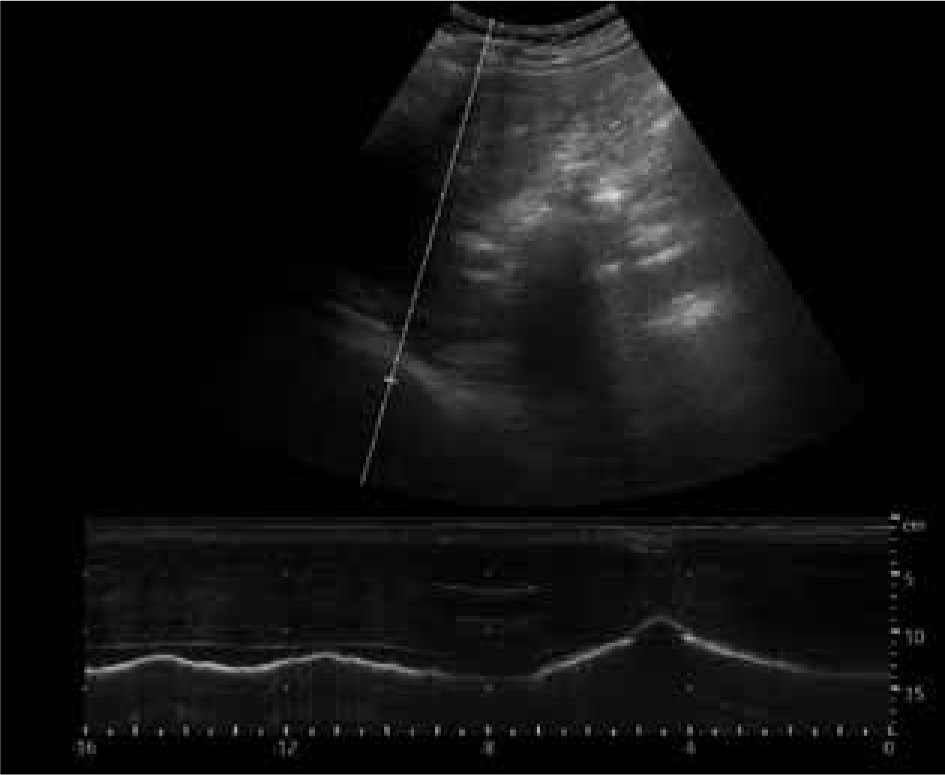
For right hemidiaphragm, excursion is assessed by placing the transducer below the right costal margin in the midclavicular line in the sagittal plane. The bright echogenic line between liver and lung artifacts is where the pleura is located (Figure 10).
Figure 10
M-mode diaphragmatic excursion during quiet breathing (left) and deep breathing (right) accessed via right subcostal approach
For left hemidiaphragm spleen may be used as acoustic window (usually gastric contents do not allow access at a preferable angle). A probe is placed in the mid-axillary or posterior axillary line and rotated clockwise to 1 or 2 o’clock.
Besides excursion, and inspiratory and expiratory times, the speed of diaphragmatic contraction can be measured.
Normal excursion values for men/women are as follows [84,85]:
for shallow breathing – 18-20 (±) 0.4 mm / 16-19 (±) 0.4 mm,
for deep breathing – 60-75 (±) 0.9-1.1 mm / 50-64 (±) 1 mm.
To distinguish between weakness and paralysis one should seek paradoxical motion, which will occur in paralysis.
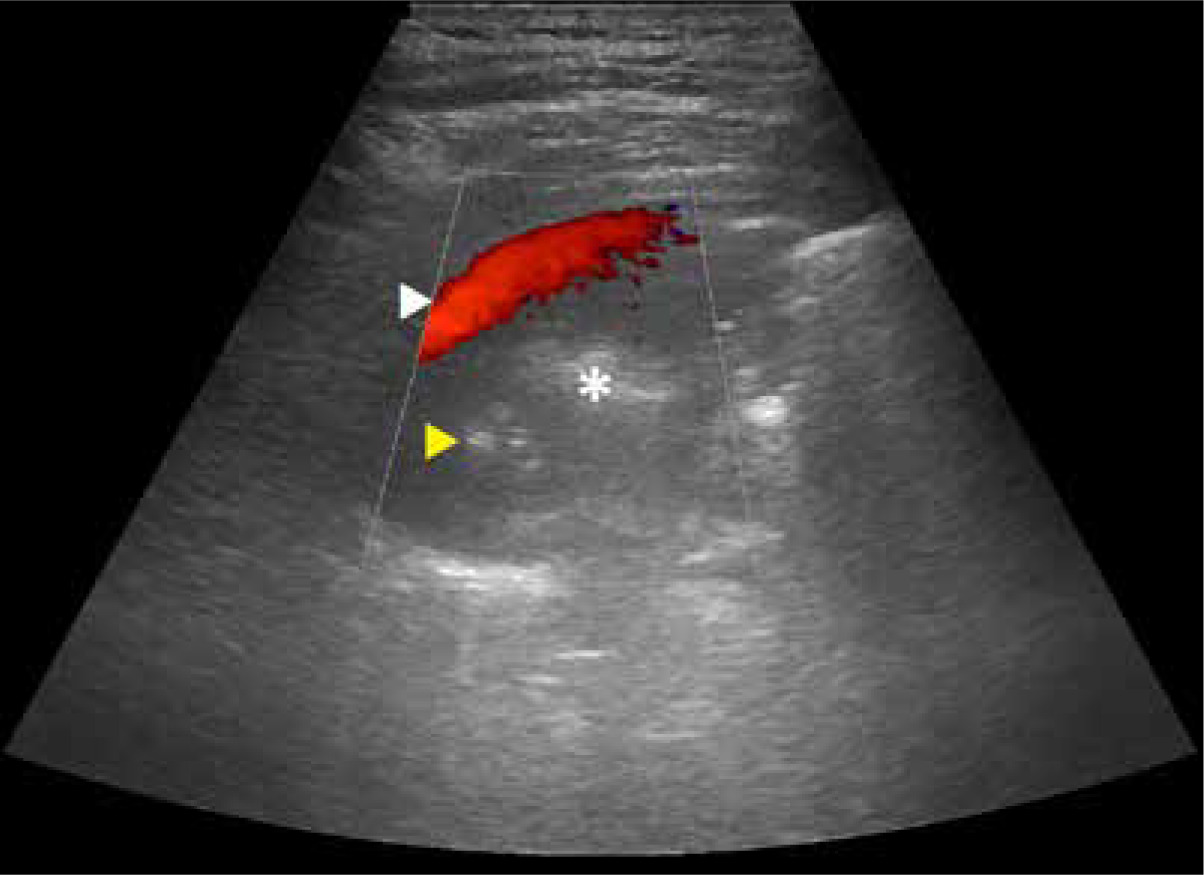
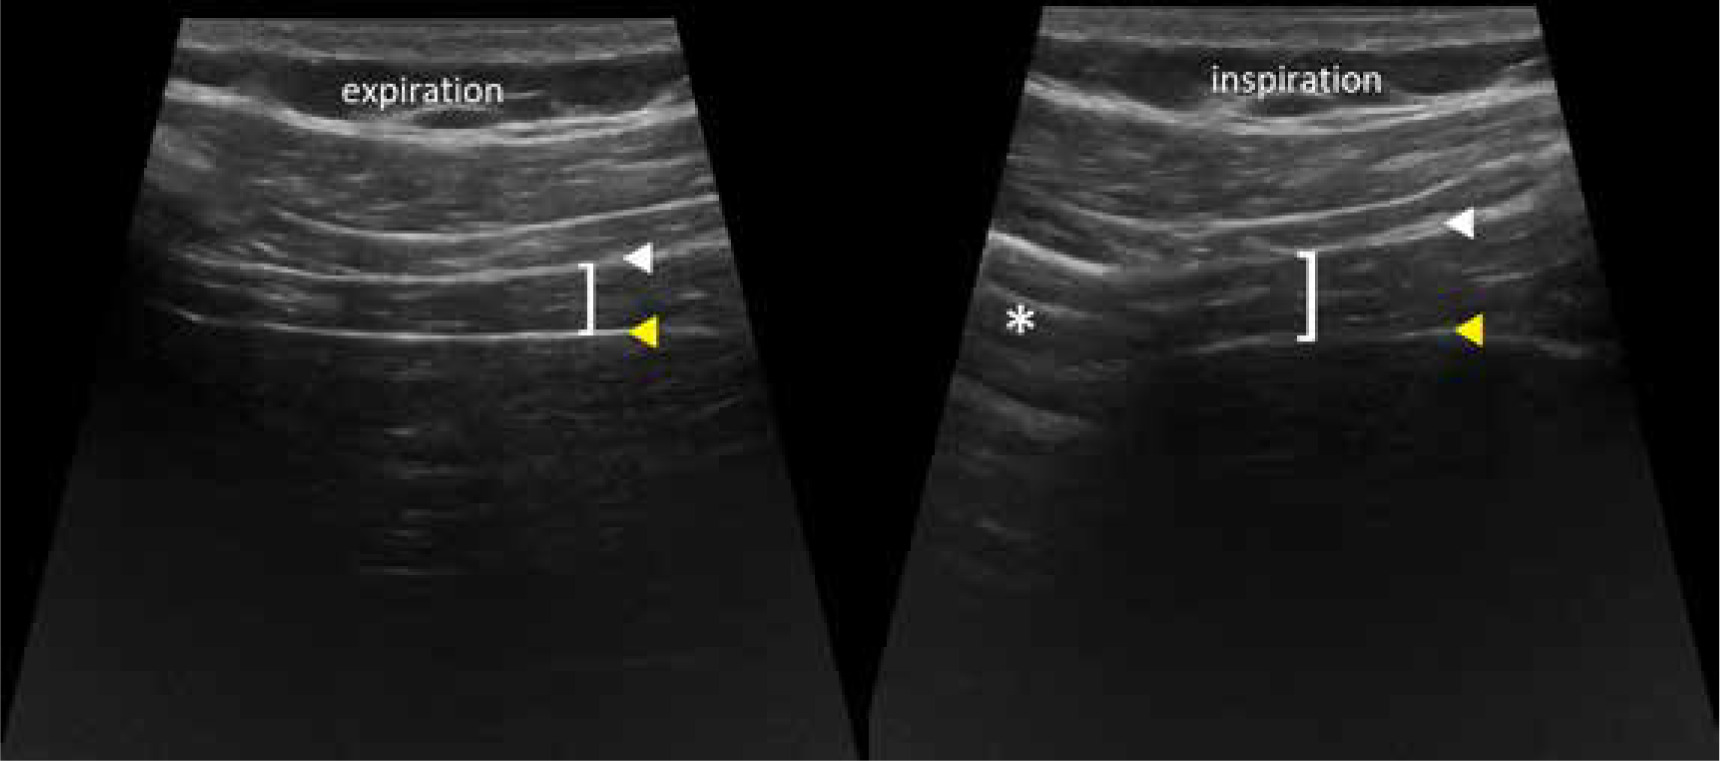
To assess thickness and thickening a high-frequency transducer is used and the zone of apposition (ZOA) has to be found. It is located along the anterior axillary line at the level of the 9th to 10th intercostal space. Transition from the lung sliding to the liver can be found there, and the diaphragm appears between the peritoneum and pleura (Figure 11) sometimes as a 3-layered structure with a central hyperechoic line. The thickening fraction (TF%) is calculated by the difference between the thickness at end inspiration and end expiration, divided by end expiration thickness, and multiplied by 100.
Figure 11
ZOA appearance. Diaphragm (brackets), pleura (white arrowhead), peritoneum (yellow arrowhead), lung (asterisk)
In evaluation of TF% the right side is most frequently used; left hemidiaphragm measurements are more challenging and less reproducible.
Normal thickness at end expiration is 1.3-3.0 mm in men and 1.1-2.7 mm in women. At end inspiration 1.7-3.9 in men and 1.3-3.7 mm in women.
Normal TF% ranges from 39 to 184% in men and 39 to 193% in women.
TF% to predict weaning outcome varies from 20% [86] to 36% [87].
More values can be found in the study by Boussuges et al.
Conclusions
LUS is a cheap, non-invasive, and easily accessible modality. It has been used in various clinical scenarios. We highlighted some of them, but we are aware of several limitations of this review. It was not a systematic review or a meta-analysis. Instead, we chose a wide-spectrum presentation of LUS application because the scientific quality of available data is poor, including many case reports, small group studies, and personal experience reports. Of course, the next step should be a meta-analysis of LUS studies done in applications that were sufficiently explored.
One should consider that lung computed tomography will always be superior to LUS in showing the whole chest, including the extent of the ILD. Moreover, it is reproducible and may show accidental findings like tumours in patients with usual interstitial pneumonia, in whom the risk increases [88].
However, the presented advantages of LUS place this imaging tool as an additional method, sometimes even an alternative, especially in the paediatric population. The most important value of LUS is its mobility and possibility of bedside use. New modalities in LUS seem to have limited efficiency in clinical practice, but it is worth knowing of their existence.
Elastographic cut-offs in fibrosis are similar or lower to those found in pleura in benign pleural effusions. More studies are necessary to settle the value of elastography in fibrosis or differentiating benign and malignant subpleural lesions. Also, the fact that LUS spectroscopy allows some degree of discrimination between fibrosis and other causes of B-lines is promising, and we are looking forward to further studies. A large-scale study of spectral Doppler flow patterns in consolidations in different conditions is also still lacking; however, knowledge about basic flow patterns is essential in the interpretation of sonograms.
Similarly, CEUS has some serious limitations, but it can be applied in a few scenarios. Speckled tracking of pleura is currently of little use in practice. As for ultrasound in EVLW, we personally prefer the BLUE protocol for acute respiratory failure in assessing lung oedema rather than scanning 28 regions, but we understand that there is some need for quantification [89]. LUS is effective in predicting success of talc pleurodesis, but in our opinion the scale in this case should be double pointed, with lung sliding either present or absent. Finally, LUS could be used in routine evaluation of asthma exacerbations, especially in younger patients, limiting irradiation, and it should be complementary in the assessment of chest wall invasion by tumours.
US-guided biopsies are a safe and effective alternative to CT for subpleural lesions.
LUS can estimate the volume of pleural effusions and is used as assistance in chest tube placement.
It may be used as an adjunct in the weaning process.
In conclusion, LUS is a very promising modality, potentially of multiple clinical applications. However, several published reports try to reinvent the wheel. In our opinion, LUS may be useful for quick, bedside imaging in emergency situations or for monitoring some chronic pathologies. However, initial diagnostics, oncological follow-up, and imaging at serious complications of chronic diseases still require computed tomography. Basic knowledge about the pros and cons of LUS is very important and should be part of radiology residency training.