Introduction
The complex lymphatic system of the head and neck region contains the highest concentration of lymph nodes in the human body, accounting for roughly 300 of the body’s total 800 lymph nodes. The most prevalent causes of cervical lymphadenopathy are bacterial and viral infections that result in reactive hyperplasia. Cervical lymphadenopathy can also be caused by malignancies, autoimmune disorders, iatrogenic conditions, and other factors. Although cervical lymphadenopathy is frequent in many benign conditions, identifying lymphadenopathy in neoplastic processes has a significant impact on patient care and prognosis, particularly in patients with head and neck squamous cell carcinoma and malignant lymphoma [1].
Follicular hyperplasia, commonly known as reactive lymphadenitis, is the most common reactive change seen in lymph nodes. It is most frequent in children and young adults, although it can affect all age groups, even the elderly [2]. The cervical and axillary regions are most commonly affected, which correspond to the lymph node groups that are more prone to drain antigens [2]. Follicular lymphoma and mantle cell lymphoma have similar histological characteristics to follicular hyperplasia and may be misdiagnosed as benign diseases [3].
Radiologists commonly encounter cervical lymphadenopathy in their daily practice, and one of their important roles is to identify reactive lymph nodes from neoplastic lymphoproliferative disorders. Therefore, knowledge of the radiological characteristics that occur in reactive lymph nodes is vital in preventing lymphoma misdiagnosis. Several previous studies have reported magnetic resonance imaging (MRI) findings of nodal lymphoma in the head and neck region [4,5]. In patients with fever of unknown origin accompanied by lymphadenopathy, differences in maximum standardised uptake value (SUVmax) between nodal lymphoma and benign causes have been reported [6]. However, to the best of our knowledge, no previous studies have described detailed MRI features of reactive lymphadenitis or indicated differences in MRI features between reactive lymphadenitis and nodal lymphomas. Therefore, this study aimed to explore the MRI and 18F-fluorodeoxyglucose (FDG)-positron emission tomography/computed tomography (PET/CT) characteristics for differentiating reactive lymphadenitis from nodal lymphoma of the head and neck.
Material and methods
Study population
This study was approved by the human research committee of our institutional review board and complied with the guidelines of the Health Insurance Portability and Accountability Act of 1996. The requirements for informed consent were waived because of the retrospective nature of this study. Between October 2004 and March 2024, we examined our hospital’s electronic medical record system for patients with cervical lymphadenopathy and found 187 patients with histopathologically confirmed reactive lymphadenitis (50 patients) and nodal lymphoma (137 patients) in the head and neck region. This study excluded 49 patients who did not have a neck MRI or an 18F-FDG-PET/CT examination before biopsy. Before the biopsy, 138 patients with histopathologically confirmed cervical lymphadenopathy had neck MRI and/or 18F-FDG-PET/CT, including 35 patients with reactive lymphadenitis and 103 patients with nodal lymphoma.
MRI protocols
Sixty-three patients (13 reactive lymphadenitis and 50 nodal lymphoma) underwent MRI using 1.5T MRI scanners (Intera Achieva 1.5T Pulsar, Philips Healthcare, Best, Netherlands or Inginea Prodiva 1.5T CS, Philips Healthcare, Best, Netherlands) or 3.0T MRI scanners (Intera Achieva 3.0T Quasar Dual, Philips Healthcare, Best, Netherlands or Ingenia 3.0T CX, Philips Healthcare, Best, Netherlands). All images were obtained at a section thickness of 3 to 4 mm with an intersection gap of 1 mm. Axial non-fat-suppressed T1-weighted images (T1WI), axial non-fat-suppressed T2-weighted images (T2WI), and coronal fat-suppressed T2-weighted images (FS T2WI) were obtained in all patients (13 reactive lymphadenitis and 50 nodal lymphoma). Axial short-tau inversion recovery single-shot spin-echo echo-planar diffusion-weighted images (DWI) with b value of 0 and 1000 s/mm were obtained in 56 patients (13 reactive lymphadenitis and 43 nodal lymphoma). Axial fat-suppressed contrast-enhanced T1WI (FS CE-T1WI) were obtained in 34 patients (9 reactive lymphadenitis and 25 nodal lymphoma) after the intravenous injection of 0.1 mmol/kg of gadopentetate dimeglumine (Magnevist; Bayer HealthCare, Leverkusen, Germany) or gadobutrol (Gadavist; Bayer HealthCare).
18F-FDG-PET/CT protocols
A total of 123 patients (29 reactive lymphadenitis and 94 nodal lymphoma) underwent whole-body 18F-FDG-PET/CT imaging from the skull to mid-thigh using 18F-FDG-PET/CT scanners (Biograph Sensation 16; Siemens Medical Solutions, Malvern, PA, USA or Discovery MI.x; GE Healthcare, Milwaukee, WI, USA). Briefly, after at least 4 hours of fasting, patients received an intravenous injection of 18F-FDG (185 MBq). Blood glucose levels were checked in all patients before FDG injection, and no patient had a blood glucose level greater than 150 mg/dl. Approximately 60 minutes after FDG injection, CT and subsequent whole-body PET were performed.
Transverse images were reconstructed with 2-mm section thickness and no overlap. Oral or intravenous contrast agent was not used for CT. PET had an axial view of 16.2 or 25.0 cm per bed position with an intersectional gap of 2.80 or 3.75 mm in one bed position, which necessitated data acquisition in 5-7 bed positions. Axial PET images were obtained using an imaging matrix of 256 × 256 and a field of view of 50 × 50 – 70 × 70 cm.
Quantitative image analysis
A radiologist with 25 years of post-training experience in head and neck radiology, who was unaware of the pathological diagnosis, evaluated images of histopathologically confirmed cervical nodes. The maximum and minimum diameters of the whole lesion, the signal intensity (SI) of the solid components of the lesion, the apparent diffusion coefficient (ADC), and the SUVmax were assessed. The SI of the solid components on T1WI, T2WI, and FS CE-T1WI was measured using regions of interest (ROIs), which were carefully placed on the solid components as widely as possible in the slice showing the maximum diameter by referring to T2WI and/or FS CE-T1WI. The reviewer determined the SI of the spinal cord at the same level as the lesion by placing 10-mm diameter circle ROIs and calculating the lymph node-to-spinal cord signal intensity ratio (SIR). The mean ADC values of the solid components were also assessed on ADC maps using ROIs. Furthermore, the reviewer defined lymphadenopathy as a lymph node with a minimum diameter of > 10 mm and calculated the number of enlarged nodes.
Qualitative image analysis
Two radiologists with 25 and 11 years of post-training experience in head and neck radiology, who were unaware of any pathological diagnosis, independently and randomly assessed all neck MRI images. Lymphadenopathy was defined as a lymph node measuring > 10 mm in minimum diameter, and the following MRI findings of the lymphadenopathy were assessed. When multiple lymphadenopathies were observed in a single patient, the MRI finding was considered positive if at least one lymph node met the MRI criteria. The reviewers evaluated their characteristics in terms of laterality (unilateral or bilateral), boundary (smooth or irregular), surrounding fat stranding on FS T2WI (presence or absence), internal uniformity (homogeneous or heterogeneous) on T1WI, T2WI, and FS CE-T1WI, the predominant SI of the solid component relative to the spinal cord (hypointensity, isointensity, and hyperintensity) on T1WI and T2WI, and unenhanced area on FS CE-T1WI (presence or absence). The location of lymphadenopathy was examined at 5 levels using the imaging-based nodal classification reported by Som et al. [7]. They also evaluated the presence of T1WI characteristics (hyperintense areas of the solid component relative to the spinal cord) and T2WI characteristics (hypointense areas of the solid component, hypointense areas converging to the periphery, and hypointense-thickened capsule > 2 mm). The hypointensity on T2WI was defined as SI similar to the skeletal muscle, excluding flow void. Furthermore, the presence of node hilum on T2WI and DWI was examined. The hilum of nodes was characterised as the kidney-bean-like form on T2WI and DWI or intranodal vessels converging to the periphery on T2WI. Any disagreements between the radiologists were resolved through discussion until a consensus was established.
Histopathological analysis
A pathologist with 19 years of post-training experience examined haematoxylin and eosin-stained tissue sections of cervical lymphadenopathy. Reactive lymphadenitis was defined as follows: an enlargement of the cortex caused by an increase in the number and size of secondary follicles, with normal lymph node architecture and various levels of inflammatory cell infiltration. The pathologist examined 13 patients with reactive lymphadenitis who underwent MRI for the presence of thickened capsule > 1 mm, inflammatory cell infiltration of the capsule (particularly neutrophils), and dilatation of lymphatic vessels and sinuses leading to the hilum (efferent lymphatic vessels).
Statistical analysis
All statistical analyses were performed using the Statistical Package for the Social Sciences version 24.0 (IBM Corp.) or EZR (Saitama Medical Centre, Jichi Medical University). The Mann-Whitney U test was used to compare all quantitative parameters between reactive lymphadenitis and nodal lymphoma. Fisher’s exact test was performed to compare all qualitative parameters between reactive lymphadenitis and nodal lymphoma. Receiver operating characteristics (ROC) curve analysis was used to determine the performance of MRI findings, and the area under the curve (AUC) was calculated to establish the optimal cutoff value for differentiating reactive lymphadenitis from nodal lymphoma. Interobserver variability in qualitative assessments was evaluated using the kappa statistic. The qualitative analysis used the kappa statistic to assess interobserver variability. A kappa value of ≤ 0.20 was interpreted as slight agreement, 0.21-0.40 as fair agreement, 0.41-0.60 as moderate agreement, 0.61-0.80 as substantial agreement, and ≥ 0.81 as almost perfect agreement.
Results
Patient characteristics
The patient characteristics are shown in Table 1. The present study included 138 patients with histopathologically proven cervical lymphadenopathy, including 35 patients with reactive lymphadenitis (15 males and 20 females; mean age 46.8 years) and 103 patients with nodal lymphoma (54 males and 49 females; mean age 63.2 years). Nodal lymphoma patients had a significantly higher age than reactive lymphadenitis patients (63.2 ± 16.7 vs. 46.8 ± 23.9 years, p < 0.01). The gender ratio did not differ between the 2 groups (p = 0.23). Lymphoma histological subtypes included diffuse large B-cell lymphoma (n = 43), follicular lymphoma (n = 31), Hodgkin lymphoma (n = 14), peripheral T-cell lymphoma (n = 4), marginal zone lymphoma (n = 2), mantle cell lymphoma (n = 2), T-cell/histiocyte-rich large B-cell lymphoma (n = 2), anaplastic large cell lymphoma (n = 2), and others (n = 3).
Table 1
Patients’ characteristics
| Parameter | Reactive lymphadenitis (n = 35) | Nodal lymphoma (n = 103) | p-value |
|---|---|---|---|
| Age (years) | 46.8 ± 23.9 (5-86) | 63.2 ± 16.7 (4-90) | 0.000* |
| Gender | |||
| Male | 15 | 54 | 0.23 |
| Female | 20 | 49 | |
| Histological diagnosis | |||
| Reactive lymphadenitis | 35 | ||
| Diffuse large B-cell lymphoma | 43 | ||
| Follicular lymphoma | 31 | ||
| Hodgkin lymphoma | 14 | ||
| Peripheral T-cell lymphoma | 4 | ||
| Marginal zone lymphoma | 2 | ||
| Mantle cell lymphoma | 2 | ||
| T-cell/histiocyte-rich large B-cell lymphoma | 2 | ||
| Anaplastic large cell lymphoma | 2 | ||
| Other subtypes of lymphoma | 3 | ||
| Examination | |||
| MRI | 13 | 50 | |
| DWI | 13 | 43 | |
| FS CE-T1WI | 9 | 25 | |
| 18F-FDG-PET/CT | 29 | 94 | |
Quantitative image analysis
The results of the quantitative image analysis are shown in Table 2. The maximum diameter (22.4 ± 6.9 vs. 33.3 ± 16.0 mm, p < 0.01), minimum diameter (15.8 ± 3.6 vs. 22.3 ± 8.5 mm, p < 0.01), and SUVmax (6.9 ± 2.7 vs. 12.8 ± 8.0, p < 0.01) of the lesion were lower in reactive lymphadenitis patients than in nodal lymphoma patients, respectively. However, there was no difference between the groups in the ratio of maximum to minimum diameter (p = 0.55), SIR on T1WI (p = 0.32), SIR on T2WI (p = 0.56), SIR on FS CE-T1WI (p = 0.11), ADC value (p = 0.16), and the number of lymphadenopathies (p = 0.98).
Table 2
Quantitative MRI and 18F-FDG-PET/CT findings of cervical lymphadenopathy in patients with reactive lymphadenitis and nodal lymphoma
| Parameter | Reactive lymphadenitis | Nodal lymphoma | p-value |
|---|---|---|---|
| MRI findings | n = 13 | n = 50 | |
| Maximum diameter (mm) | 22.4 ± 6.9 | 33.3 ± 16.0 | 0.002* |
| Minimum diameter (mm) | 15.8 ± 3.6 | 22.3 ± 8.5 | 0.006* |
| Ratio of maximum to minimum diameter | 0.73 ± 0.12 | 0.70 ± 0.14 | 0.55 |
| SIR on T1WI | 0.94 ± 0.09 | 0.95 ± 0.92 | 0.32 |
| SIR on T2WI | 1.19 ± 0.18 | 1.19 ± 0.20 | 0.56 |
| SIR on FS CE-T1WI | 1.56 ± 0.24 (n = 9) | 1.78 ± 0.43 (n = 25) | 0.11 |
| ADC value (× 10–3 mm2/s) | 0.66 ± 0.14 (n = 13) | 0.60 ± 0.10 (n = 43) | 0.16 |
| Number of lymphadenopathy | 2.6 ± 1.4 | 3.7 ± 3.8 | 0.98 |
| FDG-PET/CT findings | n = 29 | n = 94 | |
| SUVmax | 6.9 ± 2.7 | 12.8 ± 8.0 | 0.000* |
The AUC values for maximum diameter, minimum diameter, and SUVmax were 0.777 (p < 0.01), 0.748 (p < 0.01), and 0.729 (p < 0.01), respectively. The sensitivity and specificity for diagnosing nodal lymphoma based on a specific threshold of maximum diameter (> 24 mm), minimum diameter (> 19 mm), and SUVmax (> 10.58) were 70% and 77%, 58% and 92%, and 50% and 93%, respectively.
Qualitative image analysis
Table 3 shows the results of the qualitative image analysis. On T2WI, hypointense-thickened capsules > 2 mm (46% vs. 14%, p < 0.05) and hypointense areas converging to the periphery (15% vs. 0%, p < 0.05) were more frequently observed in reactive lymphadenitis than in nodal lymphoma, respectively (Figures 1-3). Hilum of nodes on T2WI (54% vs. 22%, p < 0.05) and DWI (69% vs. 30%, p < 0.05) were more frequently demonstrated in reactive lymphadenitis than in nodal lymphoma, respectively. However, there was no difference between the groups in laterality (p = 0.15), boundary (p = 0.67), surrounding fat stranding on FS T2WI (p = 0.34), internal uniformity on T1WI (p = 0.71), T2WI (p = 0.75), and FS CE-T1WI (p = 1.00), predominant SI of the solid component relative to the spinal cord on T1WI (p = 0.24) and T2WI (p = 0.25), unenhanced area on FS CE-T1WI (p = 0.40), hyperintense areas on T1WI (p = 1.00), and hypointense areas on T2WI (p = 0.67). The location of lymphadenopathy in 5 different levels according to the imaging-based nodal classification did not differ between the 2 groups (p = 0.25); however, level IV lymphadenopathy was only found in nodal lymphomas. The κ values ranged from 0.41 to 0.82, indicating moderate to almost perfect agreement between the 2 radiologists.
Table 3
Qualitative MRI findings of cervical lymphadenopathy in patients with reactive lymphadenitis and nodal lymphoma
| Parameter | Reactive lymphadenitis (n = 13) | Nodal lymphoma (n = 50) | p-value |
|---|---|---|---|
| Bilateral | 3 (23) | 4 (8) | 0.15 |
| Location | |||
| IA | 2 (15) | 2 (4) | 0.25 |
| IB | 6 (46) | 21 (42) | |
| II | 7 (54) | 30 (60) | |
| III | 2 (15) | 18 (36) | |
| IV | 0 (0) | 11 (22) | |
| V | 2 (15) | 11 (22) | |
| Irregular boundary | 1 (8) | 8 (16) | 0.67 |
| Surrounding fat stranding on FS T2WI | 3 (23) | 20 (40) | 0.34 |
| T1WI | |||
| Heterogeneous | 2 (15) | 12 (24) | 0.71 |
| Predominant SI | 0.24 | ||
| Hypointensity | 0 (0) | 1 (2) | |
| Isointensity | 2 (15) | 20 (40) | |
| Hyperintensity | 11 (85) | 29 (58) | |
| Hyperintense areas | 1 (8) | 7 (14) | 1.00 |
| T2WI | |||
| Heterogeneous | 4 (31) | 20 (40) | 0.75 |
| Predominant SI | |||
| Hypointensity | 10 (77) | 42 (84) | 0.25 |
| Isointensity | 3 (23) | 4 (8) | |
| Hyperintensity | 0 (0) | 4 (8) | |
| Hypointense areas | 2 (15) | 6 (12) | 0.67 |
| Hypointense areas converging to the periphery | 2 (15) | 0 (0) | 0.040* |
| Hypointense-thickened capsule > 2 mm | 6 (46) | 7 (14) | 0.019* |
| FS CE-T1WI | n = 9 | n = 25 | |
| Heterogeneous | 4 (44) | 13 (52) | 1.00 |
| Unenhanced area | 1 (11) | 7 (28) | 0.40 |
| Hilum of nodes on T2WI | 7 (54) | 11 (22) | 0.038* |
| Hilum of nodes on DWI | 9 (69) (n = 13) | 13 (30) (n = 43) | 0.021* |
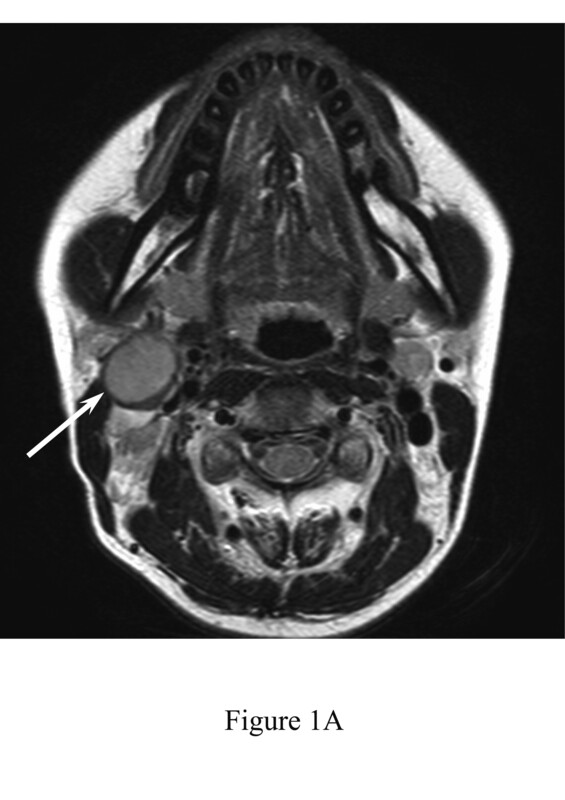
Figure 1
A 34-year-old female with reactive lymphadenitis (Case No. 8). A) T2-weighted image shows an enlarged right upper internal jugular node with hypointense-thickened capsule (arrow). B) Fat-suppressed, contrast-enhanced, T1-weighted image shows homogeneous enhancement (arrow). C) T2-weighted image shows an enlarged right upper internal jugular node with kidney-bean-like shape (arrow). D) Diffusion-weighted image demonstrates kidney-bean-like shape (arrow) with constriction (arrowhead). E) Haematoxylin and eosin stain (40× magnification) shows thickened capsule. F) Haematoxylin and eosin stain (400× magnification) shows inflammatory cell infiltration, such as neutrophils and lymphocytes, within the capsule
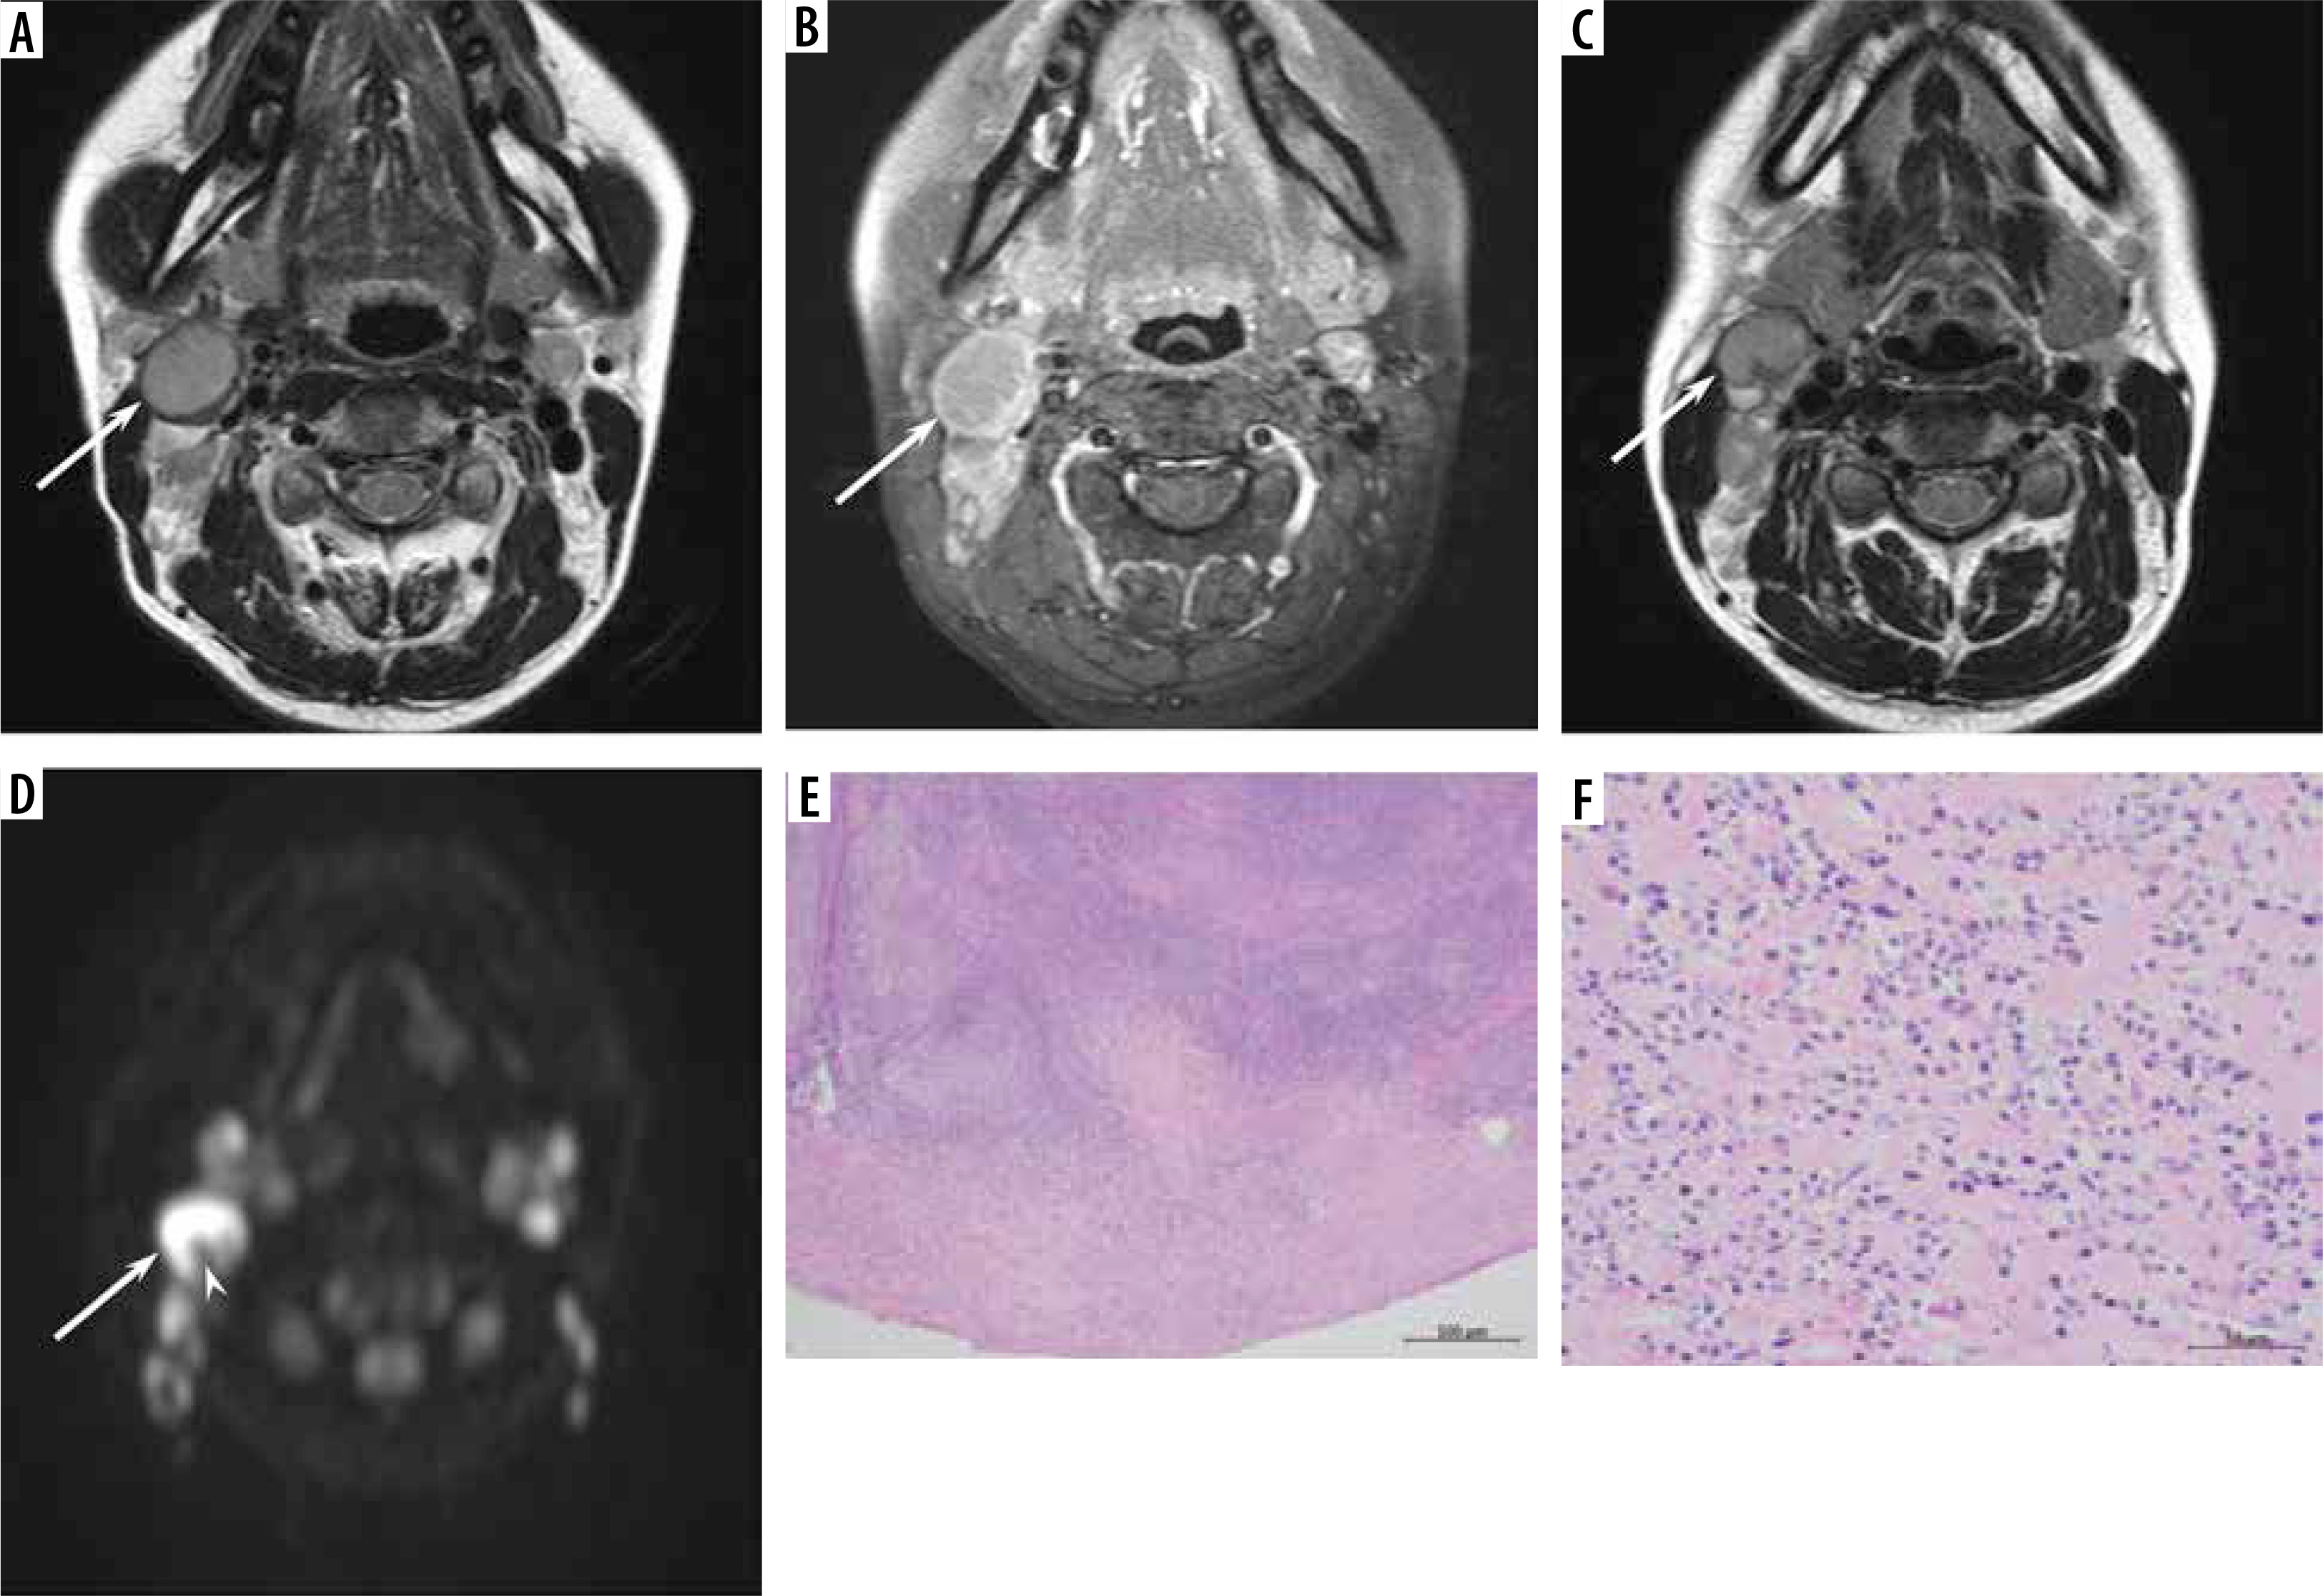
Figure 2
A 13-year-old male with reactive lymphadenitis (Case No. 4). A) T2-weighted image shows an enlarged left upper internal jugular node with hypointense-thickened capsule (arrow) and hypointense areas converging to the periphery (arrowhead). B) Fat-suppressed, contrast-enhanced, T1-weighted image shows heterogeneous enhancement (arrow). C) T2-weighted image demonstrates hypointense areas converging to the periphery (arrowhead). D) Haematoxylin and eosin stain (40× magnification) shows dilatation of lymphatic vessels and sinuses
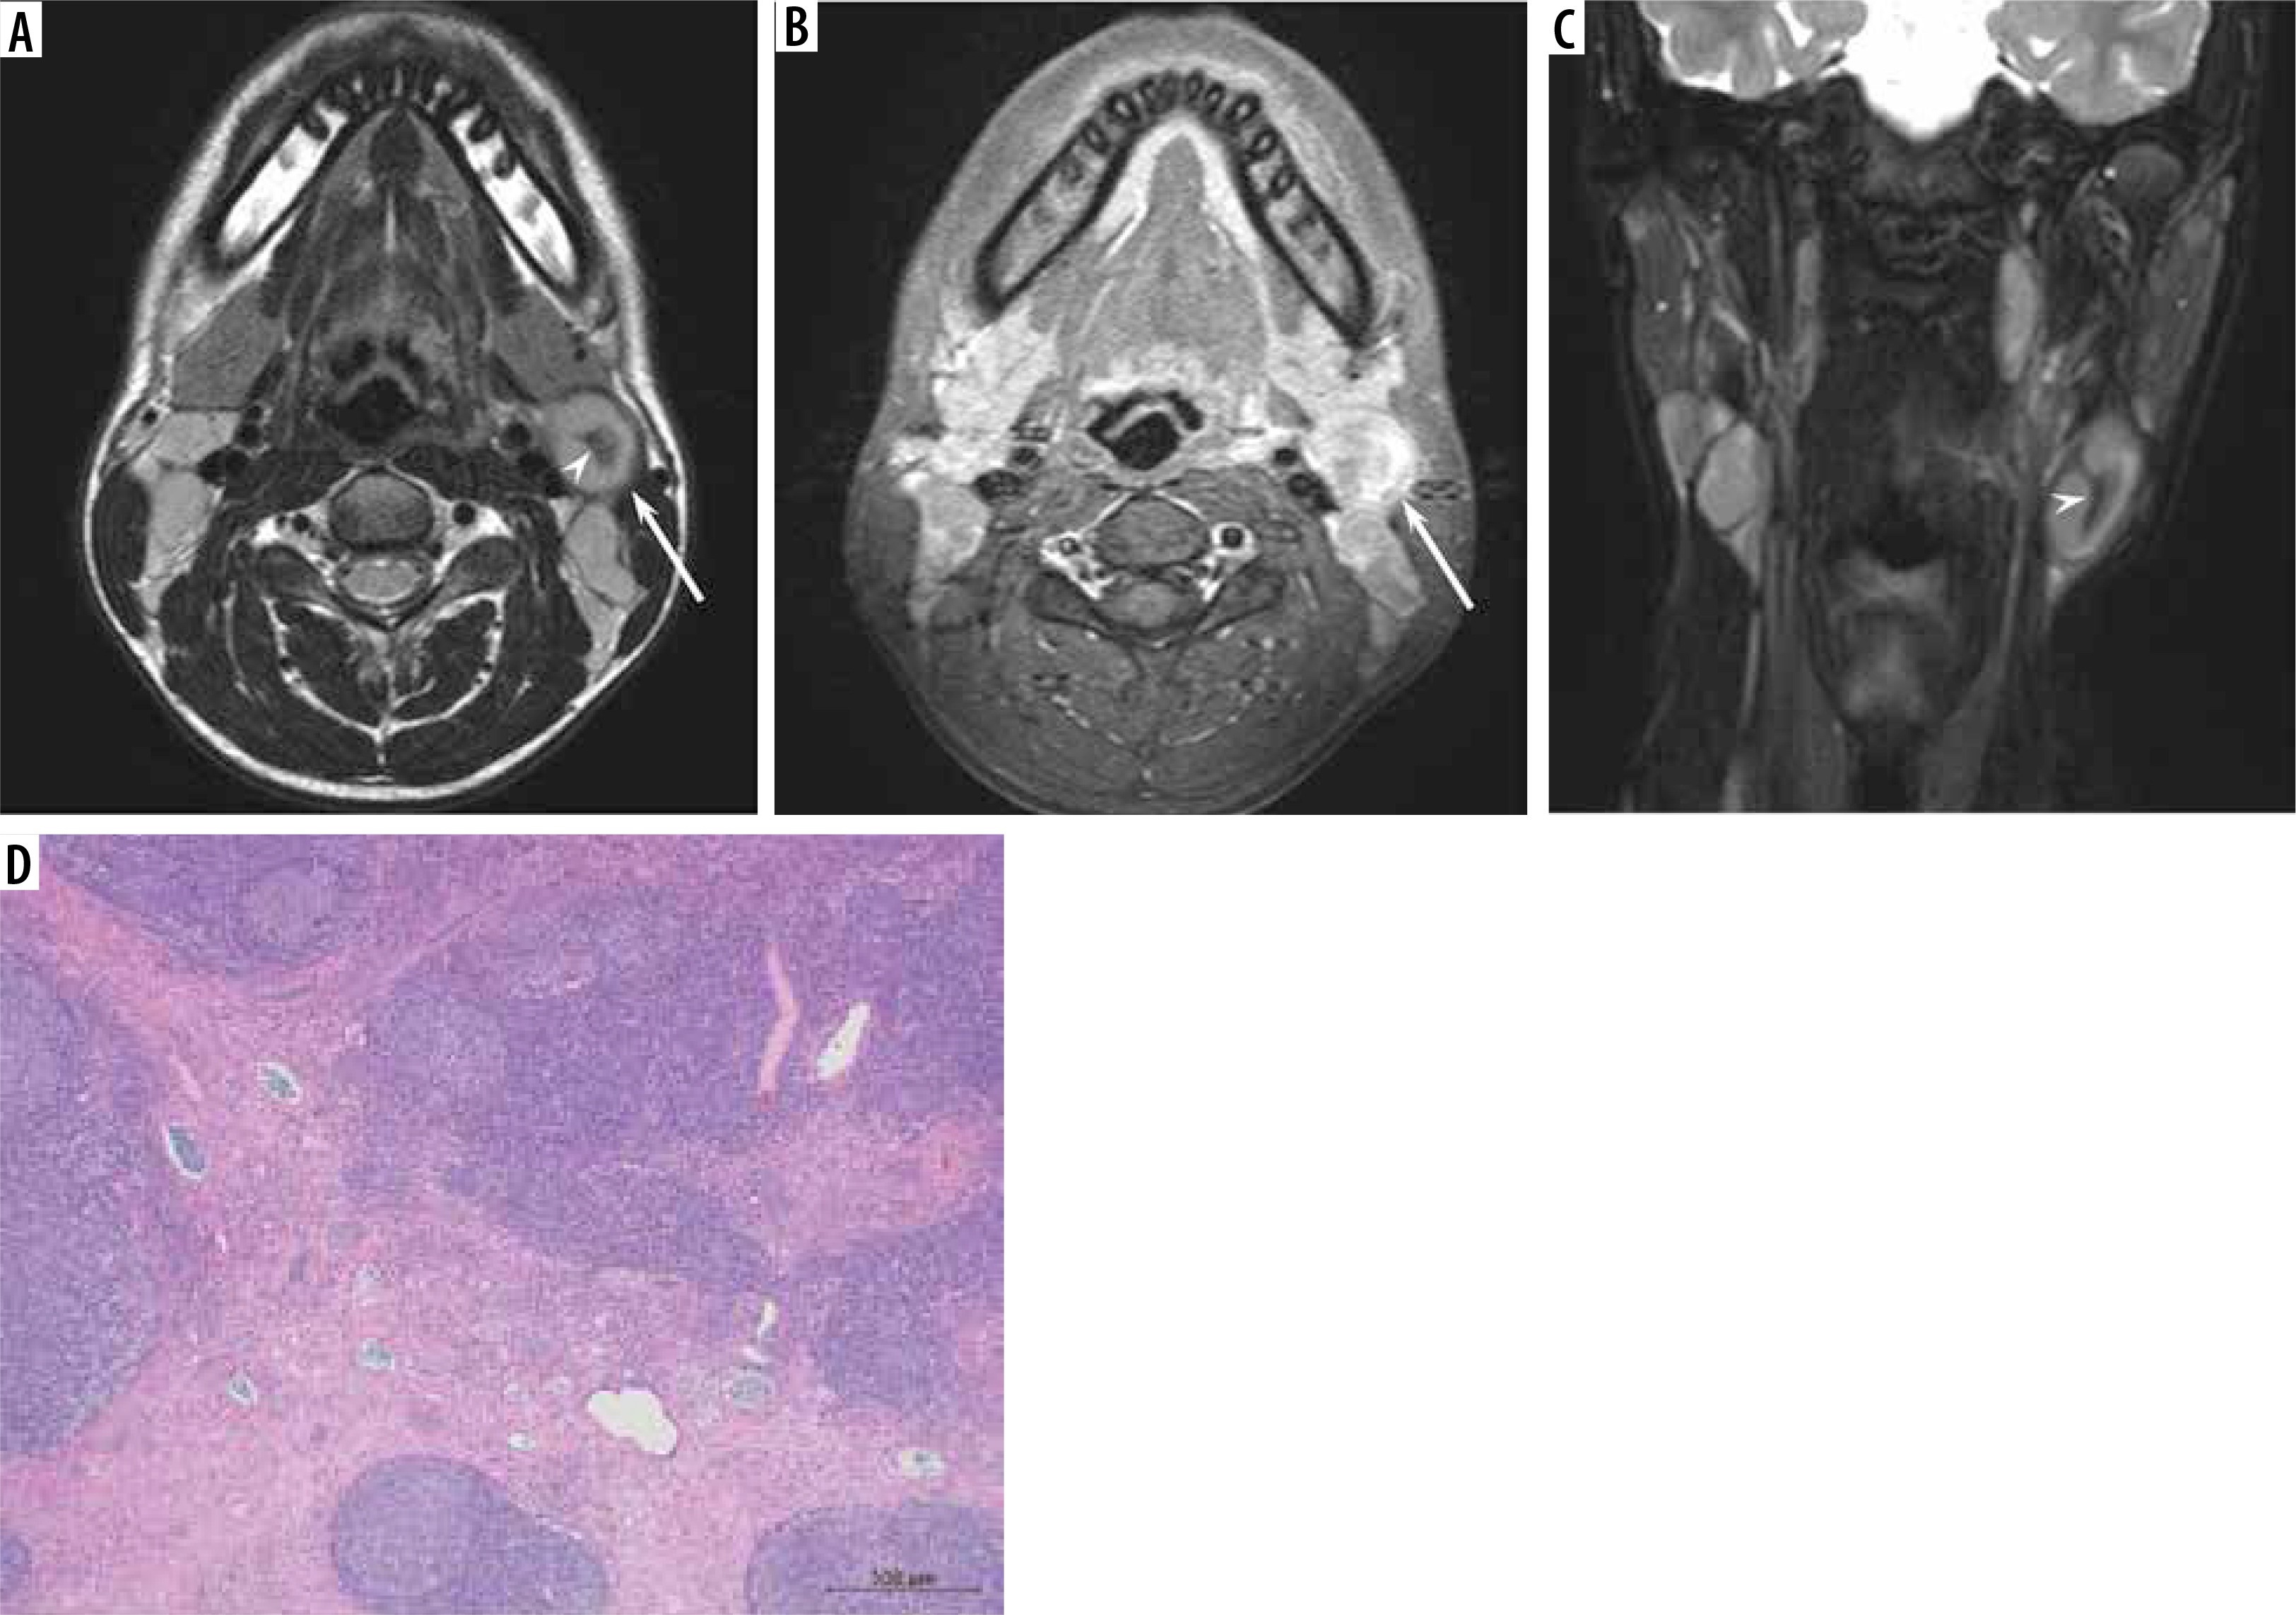
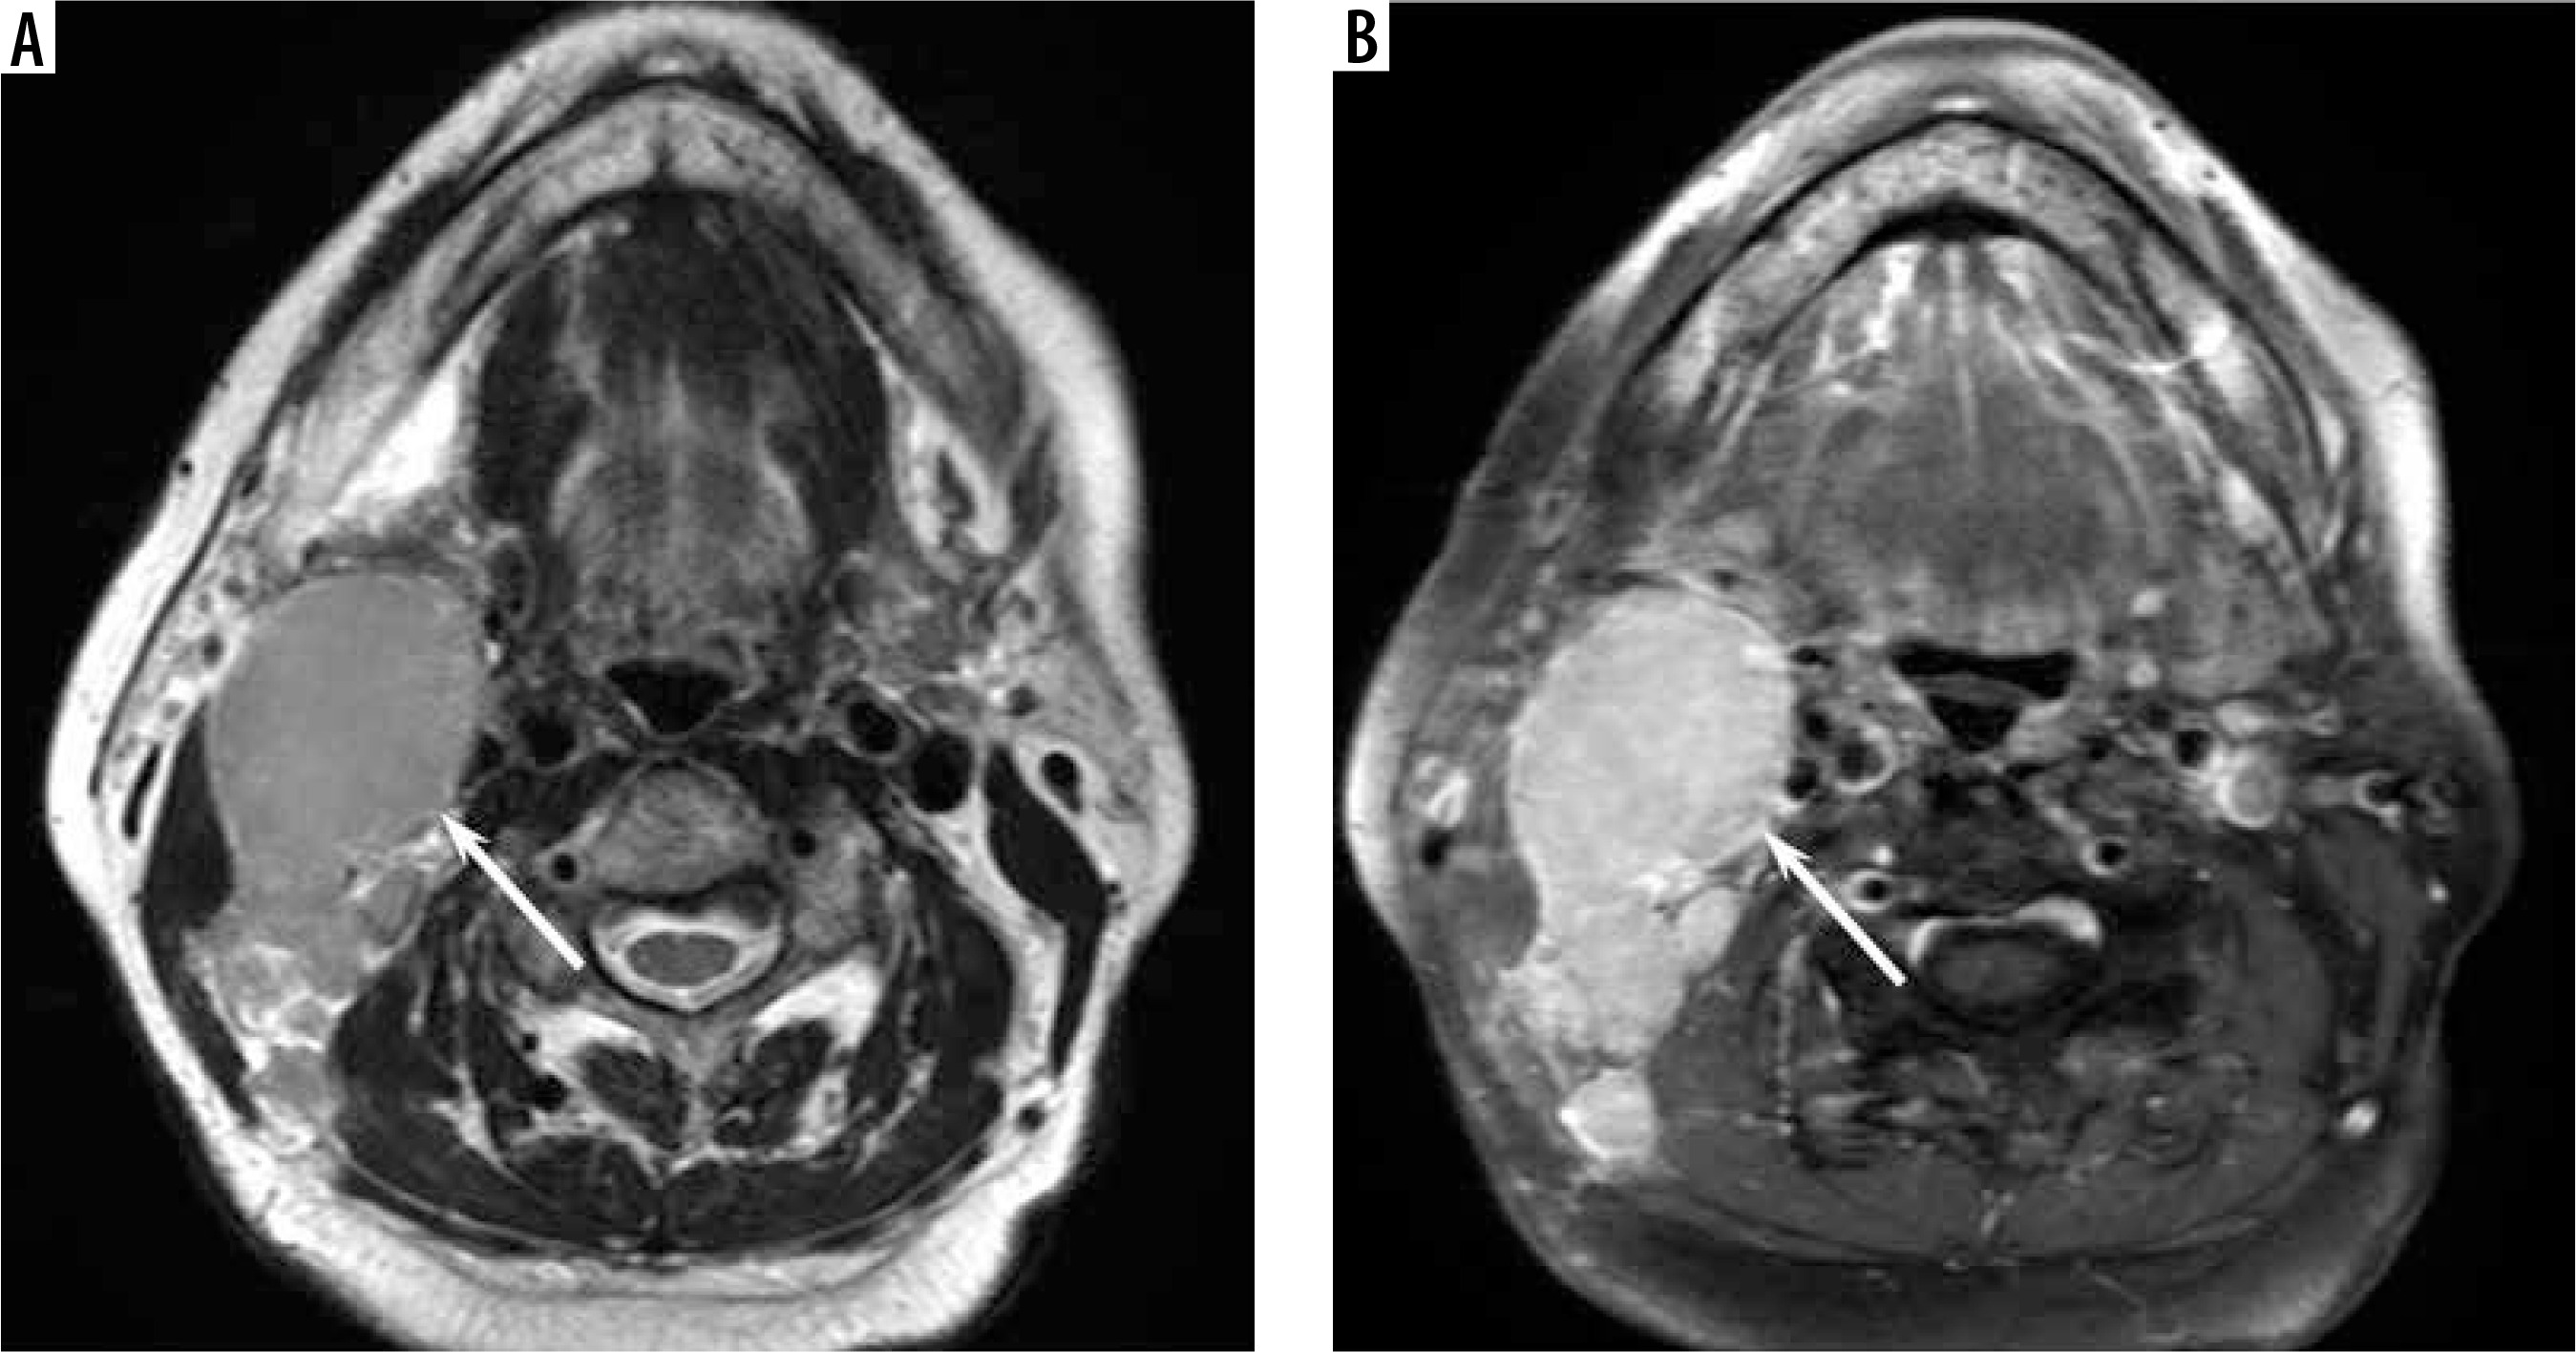
Figure 3
A 77-year-old female with Hodgkin lymphoma. A) T2-weighted image shows an enlarged right upper internal jugular node without hypointense-thickened capsule and hypointense areas converging to the periphery (arrow). B) Fat-suppressed, contrast-enhanced, T1-weighted image shows homogeneous enhancement (arrow)
Histopathological analysis
Table 4 shows the results of histopathological analysis compared with MRI findings. Among 13 patients with reactive lymphadenitis who underwent MRI, 6 patients had hypointense-thickened capsules > 2 mm on T2WI and histologically thickened capsules > 1 mm (Figure 1E). Seven patients showed inflammatory cell infiltration of the capsule, and 6 of them had histologically thickened capsules measuring >1 mm (Figure 1F). Two patients with hypointense areas converging to the periphery on T2WI showed dilatation of lymphatic vessels and sinuses leading to the hilum (efferent lymphatic vessels) (Figure 2D).
Table 4
Histopathological and MRI findings of reactive lymphadenitis
Discussion
The maximum diameter, minimum diameter, and SUVmax of the lesion were less in reactive lymphadenitis than in nodal lymphoma. On T2WI, hypointense-thickened capsules >2 mm were more frequently observed in reactive lymphadenitis than in nodal lymphoma. Hypointense areas converging to the periphery on T2WI were rare MRI findings, but they were specific to reactive lymphadenitis. Hilum of nodes on T2WI and DWI was more frequently demonstrated in reactive lymphadenitis than in nodal lymphoma. There were no significant differences found in other MRI findings, including ADC value, between reactive lymphadenitis and nodal lymphoma.
In imaging studies, the lymph nodes of Hodgkin and non-Hodgkin lymphoma varied in size, with an average diameter of 2 to 10 cm [8]. The mean maximum diameter of cervical nodal lymphoma on MRI images varied from 24 [9] to 45 mm [10]. The maximum diameter of cervical nodal lymphoma on CT images was larger in diffuse large B-cell lymphoma (33 mm) than in follicular lymphoma (24 mm) [10]. Meanwhile, although previous studies on benign cervical lymphadenopathy included various pathologies, the mean maximum diameter of inflammatory nodes on MRI images was 15 mm [9], whereas the mean minimum diameter of benign nodes on MRI images was 16 mm [11]. Our findings on the size of reactive lymphadenitis and nodal lymphoma were consistent with those of the previous studies. The size of benign nodes is often less than that of nodal lymphoma; however, differentiating benign nodes from nodal lymphoma based only on size is challenging in daily practice due to the considerable size overlap between the 2 pathologies.
18F-FDG-PET/CT is widely used in malignant lymphoma for both initial staging and response evaluation. The median SUVmax of nodal lymphomas was 12.0 [6] and that of primary extranodal head and neck lymphomas was 11.9 [12]. Meanwhile, the mean SUVmax of benign cervical nodes varied between 3.6 [13] and 4.6 [14]. The median SUVmax of Castleman disease was 4.4 [15]. The SUVmax of reactive lymphadenitis in this study was slightly higher than that in previous studies, but our result that the SUVmax of nodal lymphoma was higher than that of reactive lymphadenitis was consistent with previous results. However, diagnostic accuracy of 18F-FDG-PET/CT is limited due to the considerable SUVmax overlap between the 2 pathologies.
In the present study, hypointense-thickened capsules > 2 mm on T2WI were more frequently observed in reactive lymphadenitis than in nodal lymphoma. Six of 13 patients with reactive lymphadenitis showed both hypointense-thickened capsule > 2 mm on T2WI and a histologically thickened capsule >1 mm. In addition, all 6 patients with thickened capsules demonstrated inflammatory cell infiltration of the capsule pathologically. These findings suggest that radiologically and histologically thickened capsule of reactive lymphadenitis is caused by inflammatory cell infiltration. A thickened capsule on T2WI was rarely observed in nodal lymphoma; therefore, it is a characteristic MRI finding of reactive lymphadenitis.
In this study, only 2 patients with reactive lymphadenitis showed hypointense areas converging to the periphery on T2WI; both patients had lymphatic vessel and sinus dilatation leading to the hilum (efferent lymphatic vessels). Lymph nodes absorb lymphatic fluid from afferent lymphatic vessels and transport it out via efferent lymphatic vessels. Lymphatic vessels play an important role in the immune response by transporting antigens, inflammatory mediators, and leukocytes from peripheral tissues to draining lymph nodes. The acute inflammation resulted in lymphatic vessel dilatation and proliferation [16]. Although hypointense areas converging to the periphery on T2WI were rare MRI findings specific for reactive lymphadenitis, they were not observed in patients with nodal lymphoma.
In the present study, the hilum of nodes on T2WI and DWI was more frequently observed in reactive lymphadenitis than in nodal lymphoma. The hilum of the nodes is the point at which arteries carrying nutrients and lymphocytes enter the lymph node and veins leave it. Afferent lymphatic vessels enter the lymph node through the capsule on the periphery, whereas efferent lymphatic vessels leave the node through the hilum. Normal lymph nodes are typically oval or reniform in shape. Benign reactive nodes tend to maintain this shape due to pathogen-induced widespread nodal involvement, resulting in diffuse lymphoid proliferation and subsequent cortical expansion while preserving the overall normal reniform shape [17]. In contrast, malignant nodes often lose their reniform or oval shape, becoming more rounded [18]. DWI detected the hilum of nodes at a higher rate than T2WI; therefore, DWI may be able to highlight the shape and visualise the configuration of lymph nodes.
In the present study, the ADC values and imaging findings of FS CE-T1WI were not useful for differentiating reactive lymphadenitis from nodal lymphoma. Histologically, the preserved overall lymph node architecture and lack of capsular disruption are observed in reactive lymphadenitis, whereas the destruction of normal lymph node architecture and capsular invasion are observed in nodal lymphoma. Despite these differences, the histological findings of reactive lymphadenitis are sometimes similar to those of malignant lymphoma, and the differentiation can be challenging for pathologists. In particular, the histological findings of reactive lymphadenitis can closely resemble those of follicular lymphoma and mantle cell lymphoma [3]; therefore, the differentiation may require additional immunohistochemical examinations and molecular testing for accurate diagnosis. The difficulty of differentiation using ADC values and imaging findings of FS CE-T1WI would be caused by the similarities of histological findings between the 2 pathologies.
The study has several limitations. First, this was a single-centre retrospective study with a small number of patients included. Second, because the present study is retrospective, the imaging data were obtained using 3 different MRIs and 2 different 18F-FDG-PET/CT scanners. Third, the MRI results were evaluated in patients who had a neck MRI. Larger lymph nodes tended to undergo detailed examination. Therefore, selection bias might occur, and MRI findings of relatively large lymph nodes, particularly in patients with reactive lymphadenitis, might be assessed.
Conclusions
Although the MRI findings of reactive lymphadenitis and nodal lymphoma overlapped significantly, making differentiation challenging, the presence of T2-hypointense-thickened capsule and hilum of nodes on T2WI and DWI were more commonly seen in reactive lymphadenitis, and T2-hypointense areas converging to the periphery were specific to reactive lymphadenitis. In addition, reactive lymphadenitis was smaller and had a lower SUVmax than nodal lymphoma; however, diagnostic accuracy of the size and SUVmax is limited due to considerable overlap between the 2 pathologies.