Introduction
Magnetic resonance imaging (MRI) is frequently used to help establish a specific diagnosis in the early course of rheumatological disease when clinical examination findings may be vague, radiographs are normal, and laboratory values are inconclusive [1]. Imaging findings, including disease target site distribution and symmetry, aid in narrowing the type of inflammatory arthropathy. Early diagnosis and prompt initiation of treatment can improve clinical outcomes by preventing structural damage in patients with arthritis.
The European Society of Musculoskeletal Radiology Arthritis Subcommittee provides recommendations for the use of MRI in the diagnosis of rheumatologic diseases, including early diagnosis of inflammation, confirming a diagnosis based on imaging findings, clinical evaluation of symptomatically active disease as well as resulting structural changes, and monitoring of response to therapy [2].
The high contrast and spatial resolution of MRI allows detailed evaluation of the bone marrow, periarticular soft tissues, and articular cartilage. MRI is highly sensitive and specific in detecting the common findings of active inflammation in rheumatological disease, including bone marrow oedema (BMO), joint effusions, and synovitis, as well as the associated chronic structural lesions, including bone erosions, enthesitis, and cartilage damage in the appendicular skeleton, as well as enthesitis, sacroiliac joint inflammation, and vertebral body involvement of the axial skeleton [2].
Rheumatoid arthritis (RA) (Figures 1-4), crystal deposition diseases including gouty arthropathy (Figures 5-7] and calcium pyrophosphate deposition disease (CPPD) (Figures 8 and 9), seronegative spondyloarthropathies including psoriatic arthritis (PsA) (Figures 10-13), reactivearthritis (Figure 14) and ankylosing spondylitis (AS) (Figures 15-21), osteoarthritis (OA) (Figure 22) and erosive osteoarthritis (EOA) (Figure 23) have characteristic, although often overlapping, MRI appearances. Contrast enhanced MRI, including dynamic contrast-enhanced (DCE) MRI (Figure 14A-E), as well as diffusion-weighted imaging (DWI) (Figure 14G-I), can provide additional evaluation of active synovitis.
Figure 1
A) Artist’s drawing of the normal synovial joint and (B) of the synovial joint affected by rheumatoid arthritis (RA). In B note synovial proliferation eroding into the bone at the bare area by the capsular attachment site not covered by the articular cartilage (arrow)
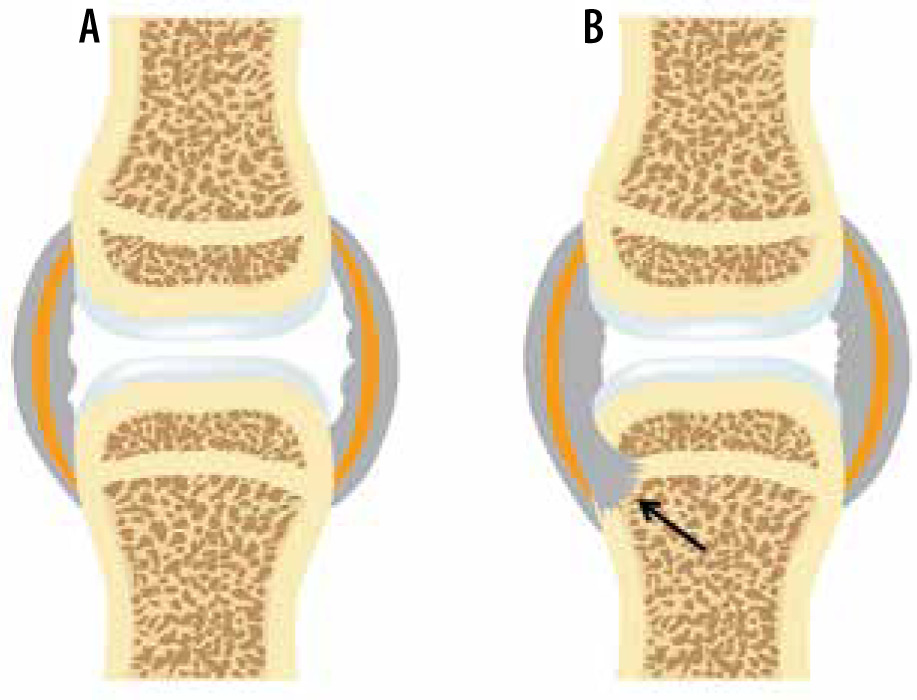
Figure 2
A 35-year-old female with rheumatoid arthritis (RA) for 5 years. A) Coronal and (B) sagittal proton density-weighted with fat-saturation (PDW FS) and (C) coronal T1-weighted (T1W) magnetic resonance (MR) images of the hand show a prominent marginal erosion at the radial aspect of the third metacarpal head (dashed arrows) with adjacent high signal intensity bone marrow oedema (BMO) in A and B extending into the metacarpal diaphysis. In A and B note large heterogenous joint effusions at the middle finger metacarpophalangeal (MCP) and proximal interphalangeal joints (PIP) (arrows)
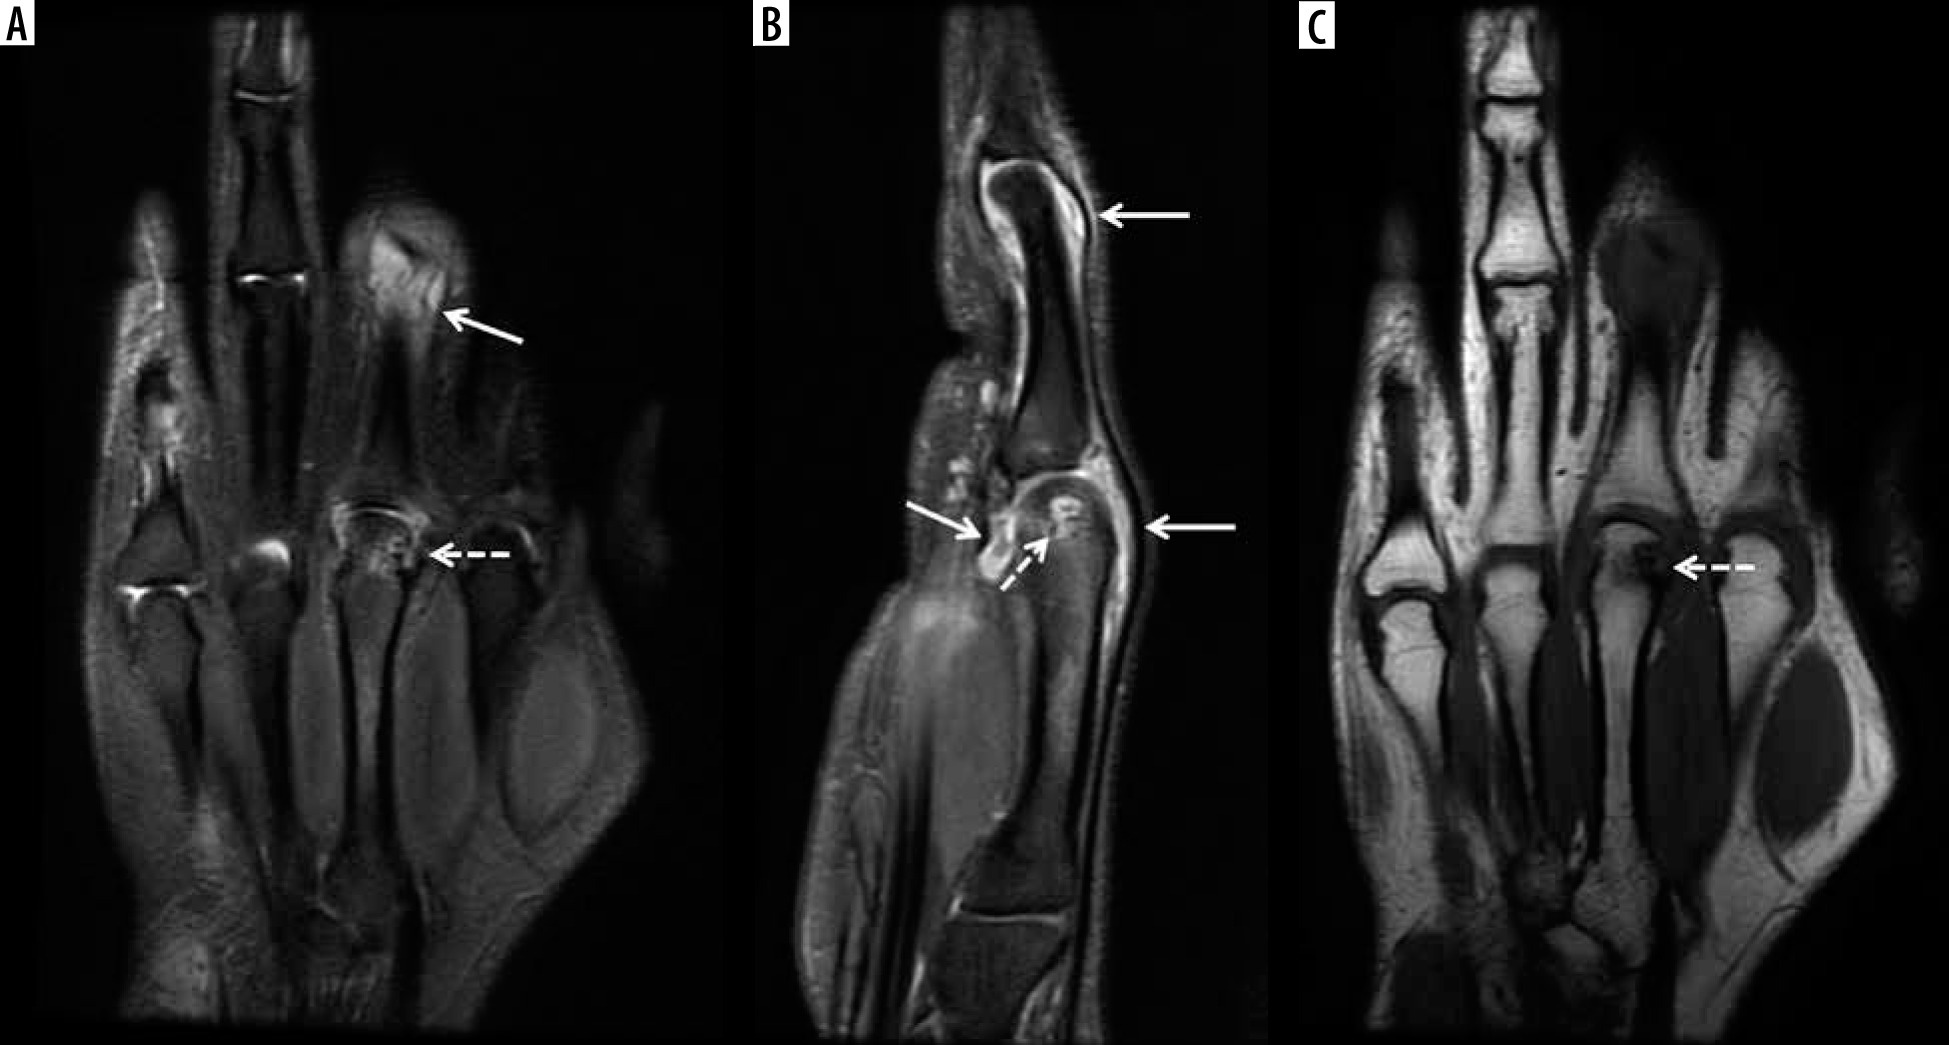
Figure 3
A 69-year-old female with longstanding seropositive rheumatoid arthritis (RA) and palpable soft tissue mass at the volar aspect of the hand. A) Axial and (B) coronal proton density-weighted with fat-saturation (PDW FS) magnetic resonance (MR) images of the hand show intermediate increased signal intensity lobulated soft tissue mass at the volar aspect of the hand surrounding the flexor tendons in the region of ulnar bursa consistent with chronic synovitis (arrows). The lesion shows intermediate decreased signal intensity on the T1-weighted (T1W) image (C). In B and C note pancarpal joint space narrowing with associated chronic erosive changes (arrowheads). In B note heterogeneous increased signal intensity in the distended 2nd and 4th middle finger metacarpophalangeal (MCP) joints, in keeping with chronic active synovitis (dashed arrows)
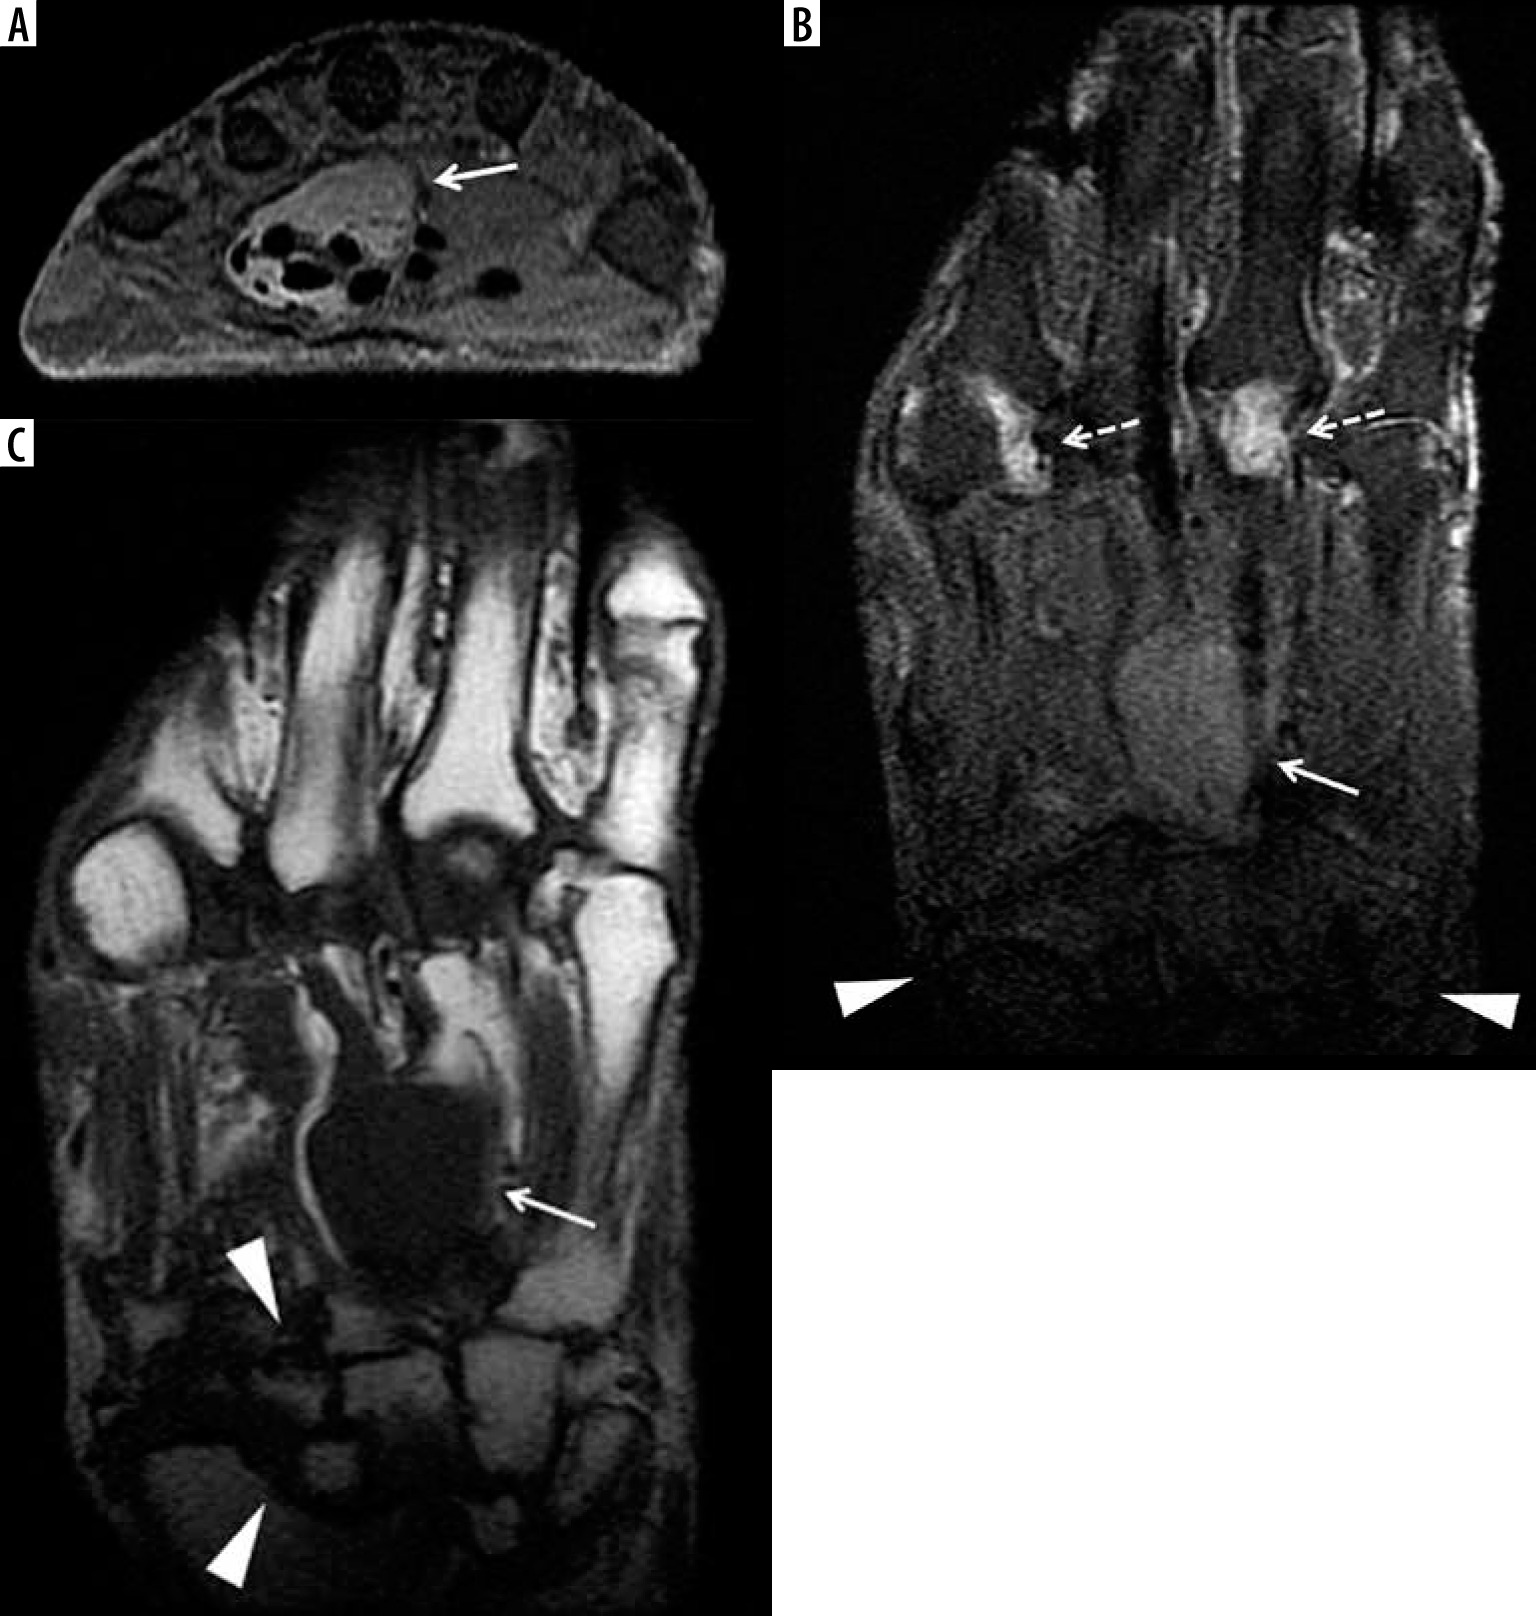
Figure 4
A 59-year-old female with rheumatoid arthritis (RA) and chronic elbow pain and swelling. Sagittal proton density-weighted with fat-saturation (PDW FS) magnetic resonance (MR) image shows a moderate size heterogeneous synovial fluid complex in the elbow with prominent synovial thickening (arrows). Note mild reactive bone marrow oedema (BMO) in the olecranon (dashed arrow) and mild periarticular soft-tissue oedema
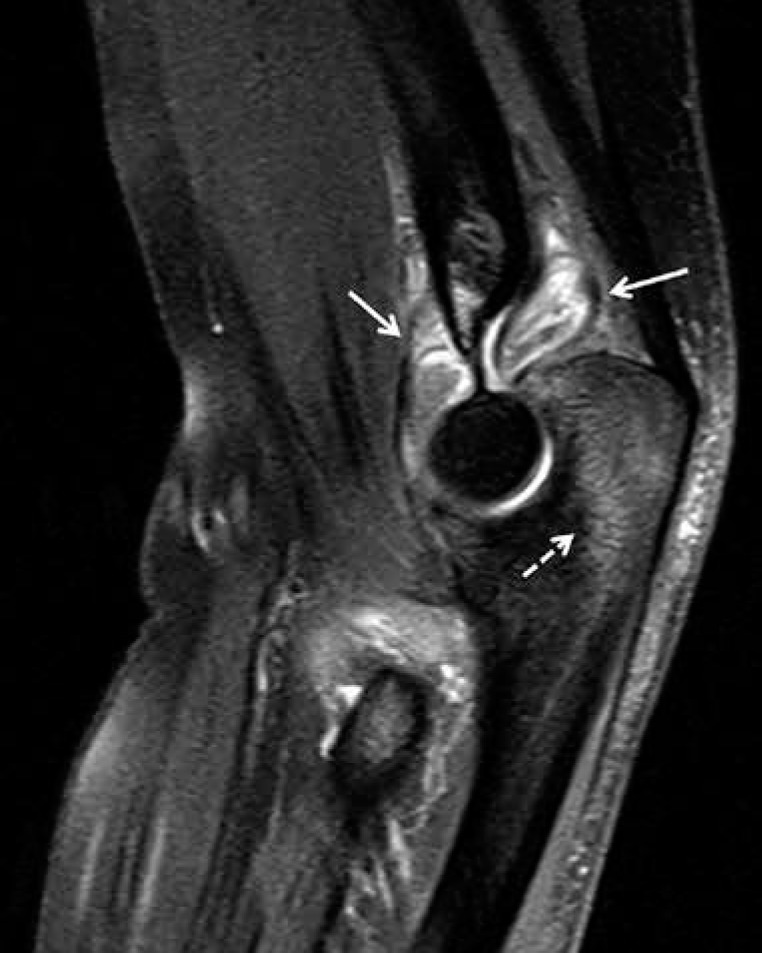
Figure 5
Gout. Artist’s drawing of the synovial joint demonstrates juxtaarticular deposit of the uric acid crystals (green) eroding into the capsular attachment (red arrow) and subjacent bone (black arrow)
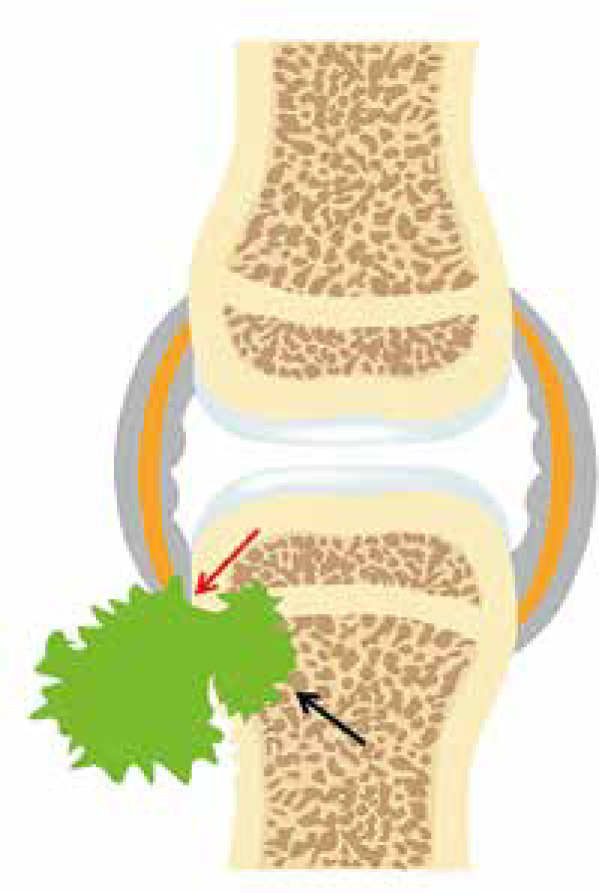
Figure 6
A 60-year-old male with gout and left foot swelling and ulcerations. A) Axial and (B) coronal short tau inversion recovery (STIR) and (C) coronal T1-weighted (T1W) magnetic resonance (MR) images of the foot show erosive bone changes at the medial and plantar aspect of the 1st metatarsal head and proximal phalangeal base (arrows) with associated heterogeneous deposits of intermediate to slightly increased signal in A and B and intermediate to low signal in C consistent with gouty arthropathy (podagra). D) Corresponding anteroposterior foot radiograph shows well-defined erosions with overhanging edges at the medial aspect of the first metatarsal head and proximal phalangeal base (arrow) and to a lesser extent at the lateral aspect related to gouty arthropathy. In A and D note postsurgical fusion of the great toe interphalangeal joint
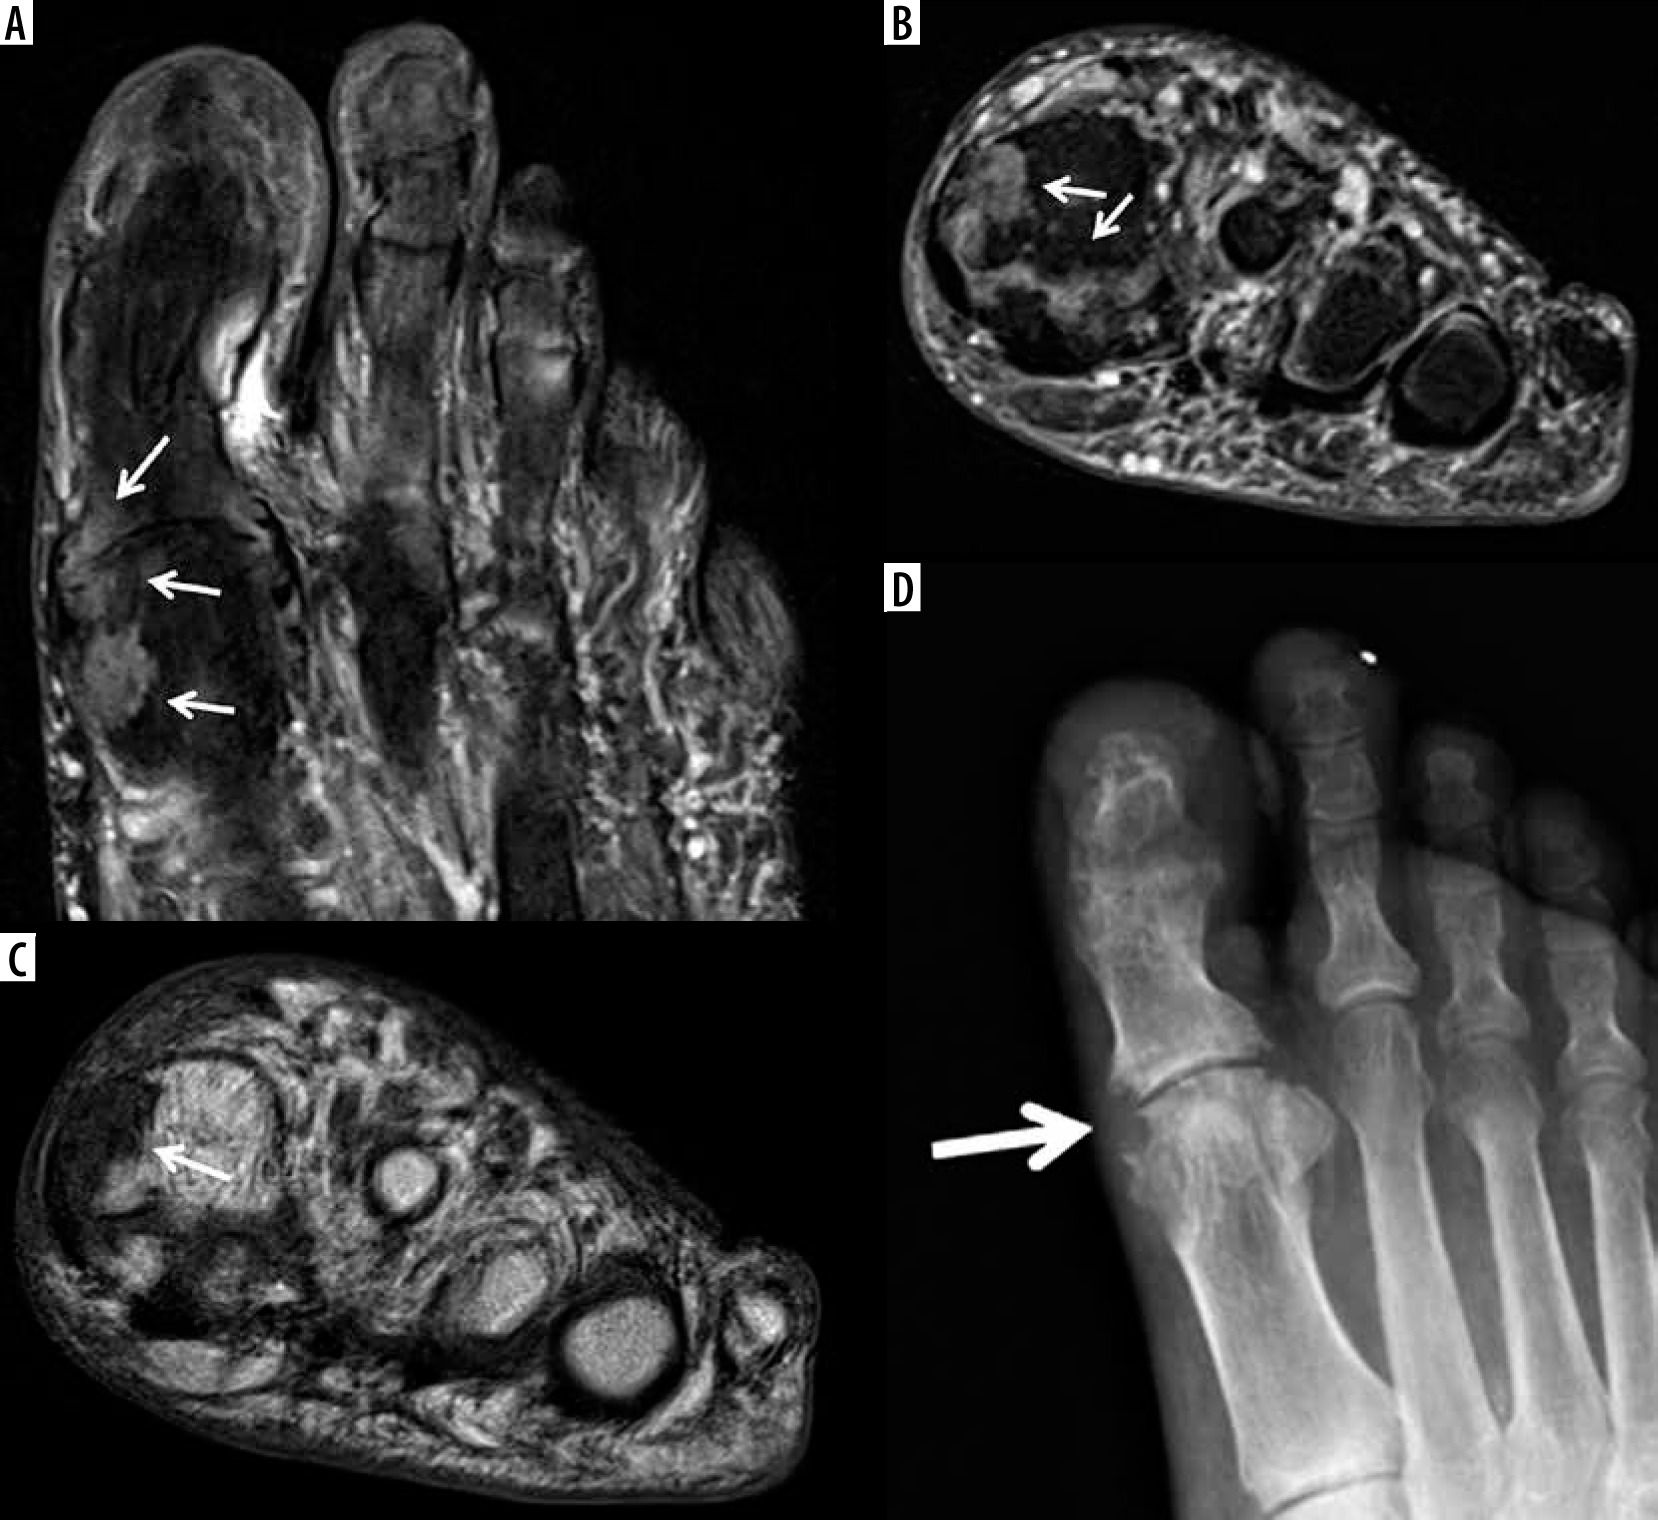
Figure 7
A 56-year-old male with gout. (a) Sagittal proton density-weighted with fat-saturation (PDW FS) magnetic resonance (MR) image of the elbow shows complex distended olecranon bursa with peri bursal oedema (arrows) eroding into the olecranon related to gouty arthropathy. Note a large erosion at the posterior olecranon (dashed arrow) with adjacent mild bone marrow oedema (BMO). B) Corresponding lateral radiograph shows thickening of the olecranon bursa (white arrows) with subjacent osseous erosion at the posterior olecranon (dashed arrow) and osseous debris (black arrow), which was not well seen on the MR image
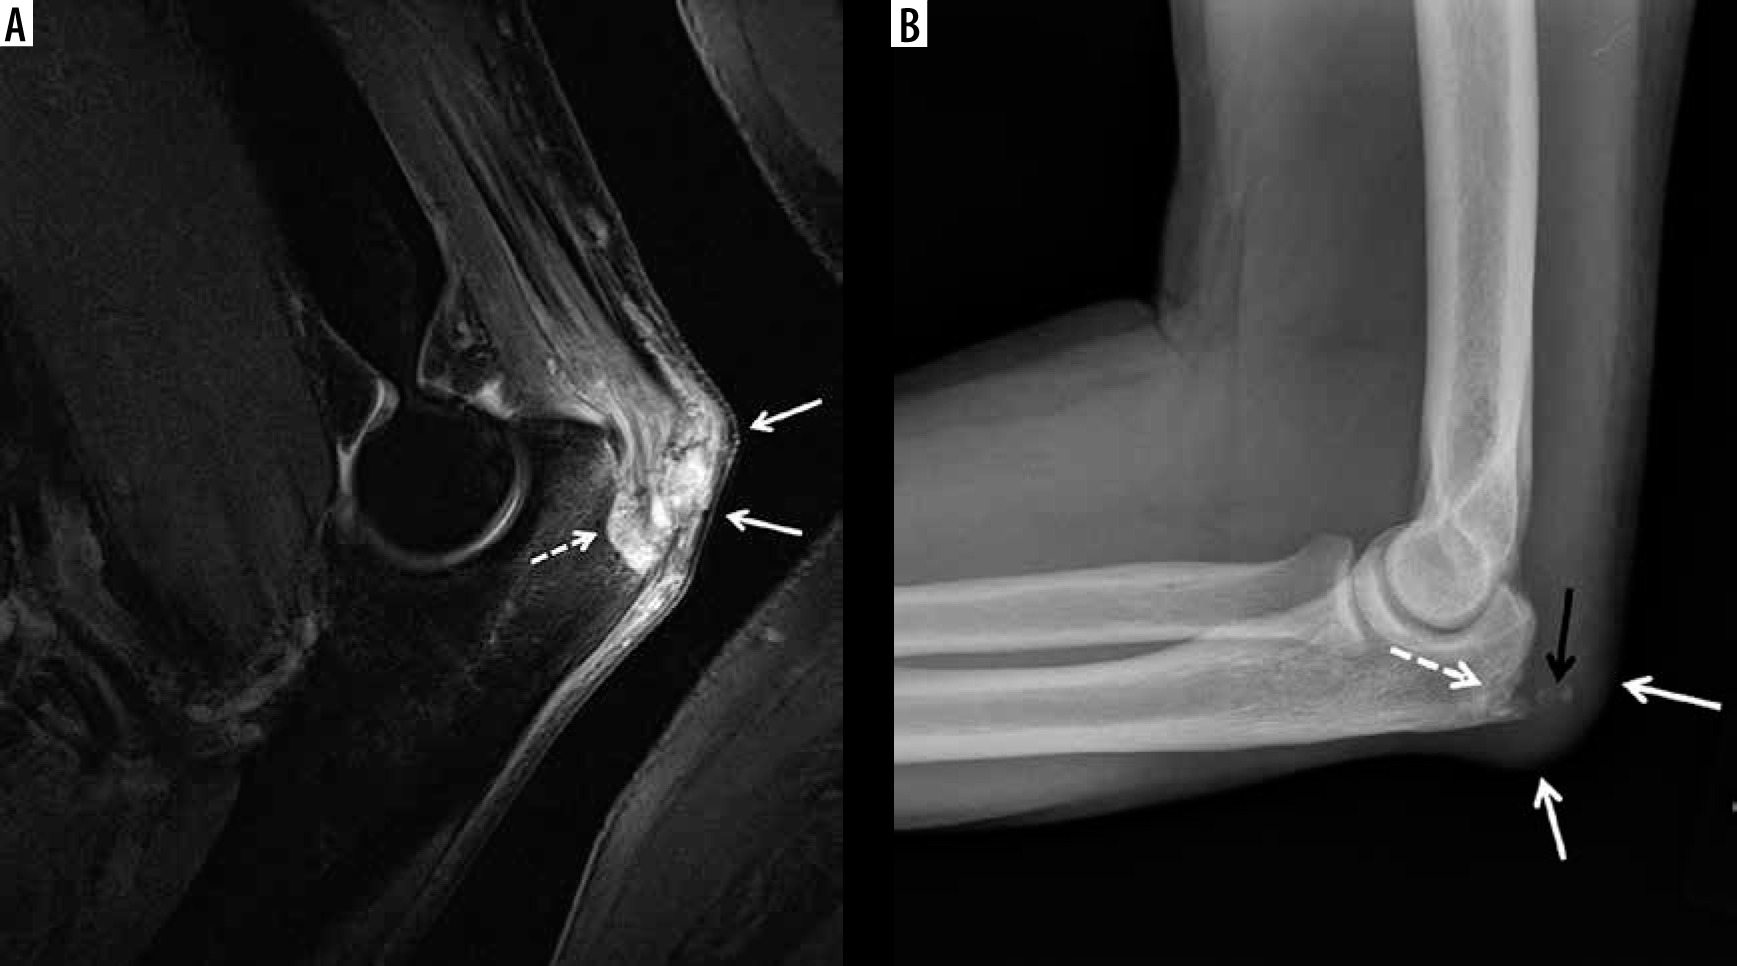
Figure 8
A 66-year-old male with chronic wrist pain and calcium pyrophosphate deposition (CPPD) arthropathy. A) Coronal proton density-weighted with fat-saturation (PDW FS) and (B) coronal T1-weighted (T1W) magnetic resonance (MR) images show numerous cyst-like and erosive changes throughout the carpal bones, metacarpal bases, and distal radius and ulna surrounded by heterogeneous synovial fluid complexes, which show intermediate increased signal in A and intermediate low signal in B consistent with CPPD and chronic synovitis (arrows). C) Coronal reformatted computed tomography (CT) image redemonstrates extensive cyst-like and erosive changes and calcific deposits in all wrist compartments (arrows)
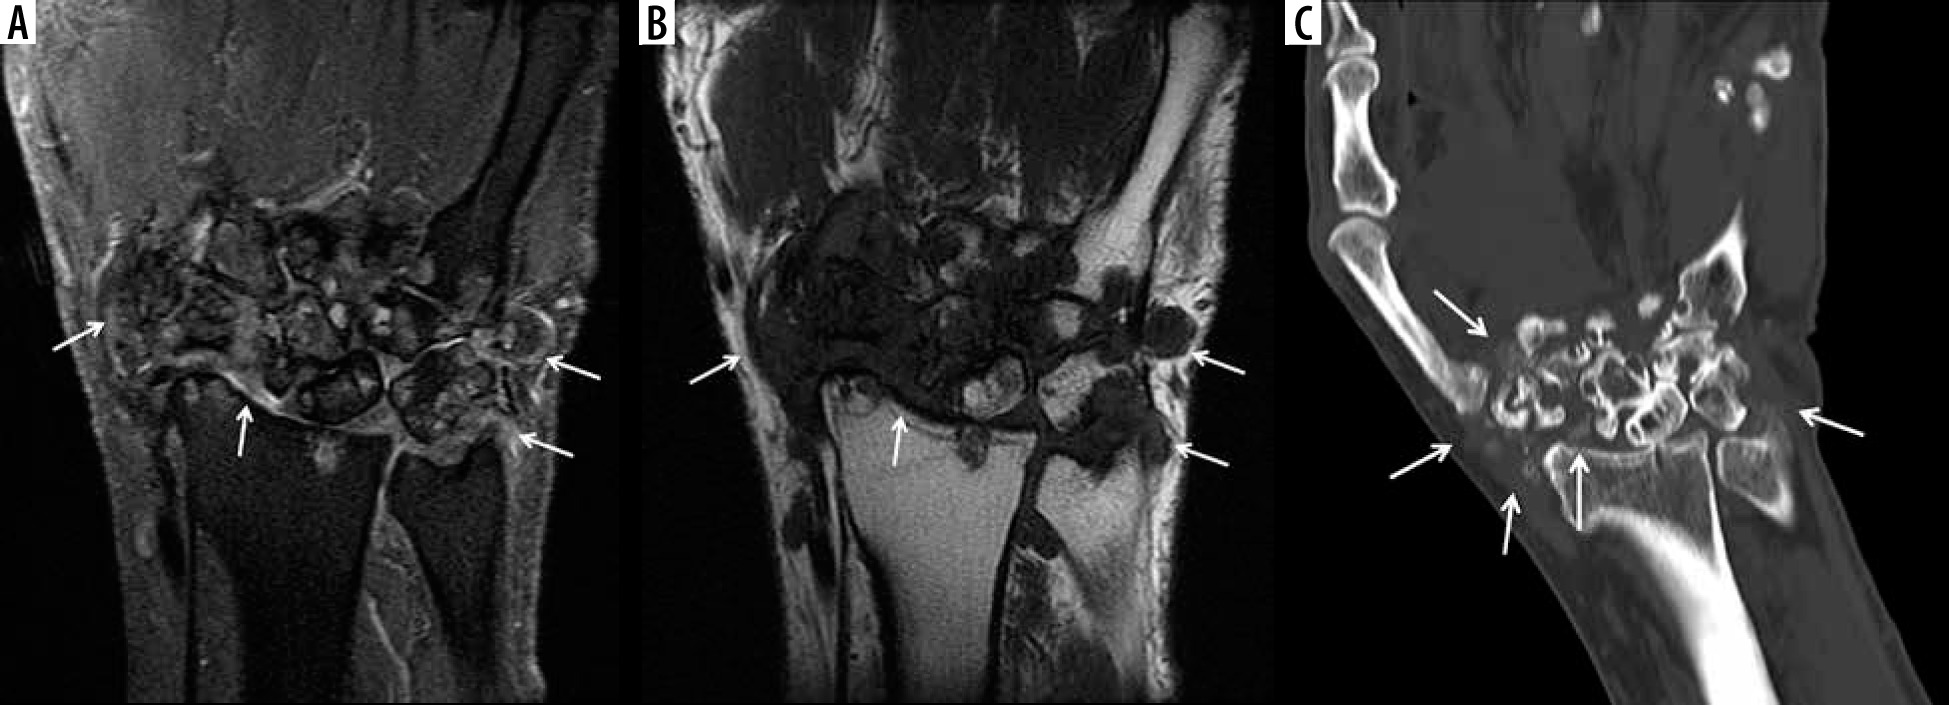
Figure 9
An 84-year-old female with neck pain and calcium pyrophosphate deposition (CPPD) arthropathy with “crowned dens”. A) Axial T2-weighted (T2W) magnetic resonance (MR) image shows a low signal intensity halo within the atlantoaxial joint surrounding dens (arrows) consistent with CPPD. Calcium deposits in the same anatomic location are better characterized on the corresponding axial computed tomography (CT) image (arrows)
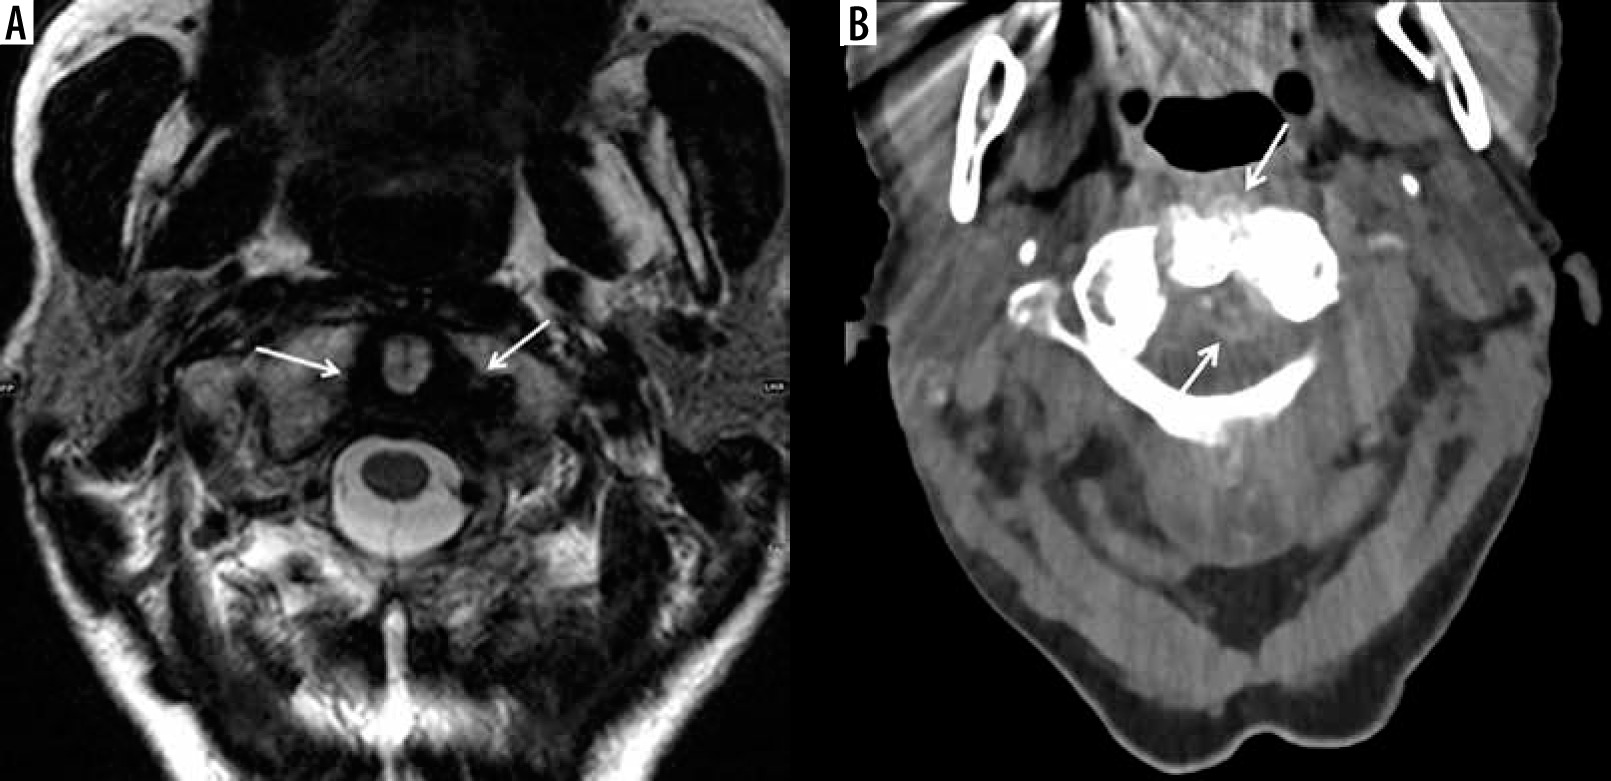
Figure 10
Psoriatic arthritis. Artist’s drawing of the synovial joint demonstrates inflammation at the capsular attachment site consistent with enthesitis (red arrow) and adjacent bone erosion (green arrow) and proliferation (black arrow)
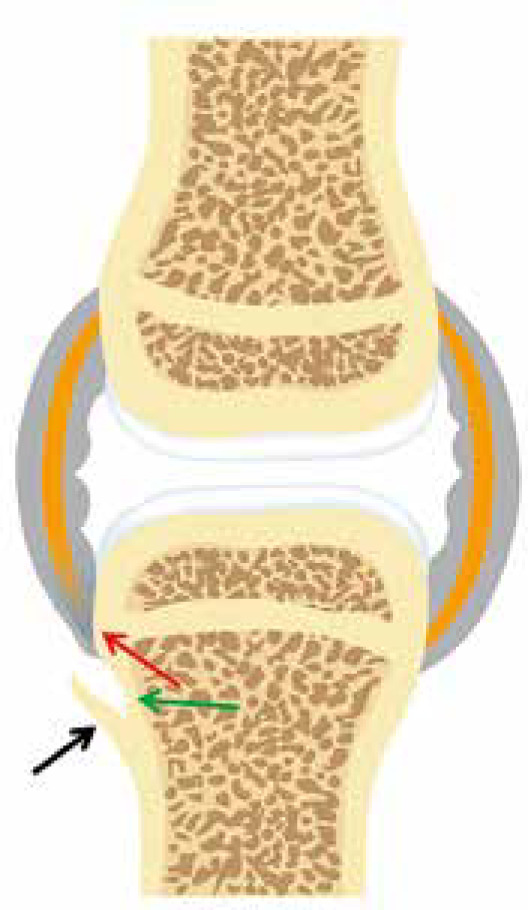
Figure 11
Enthesitis in 2 different patients with psoriatic arthritis. A) Coronal proton density-weighted with fat-saturation (PDW FS) magnetic resonance (MR) image of the knee in a 47-year-old male shows oedema and thickening of the lateral collateral ligament proper with periligamentous oedema (arrow) consistent with enthesitis. Note bone marrow oedema in the subjacent lateral femoral condyle (dashed arrow) [Courtesy of Girish Gandikota MBBS FRCR RMSK, Ann Arbor, Michigan, USA]. B) Coronal T2-weighted with fat-saturation (T2W FS) image of the hand in a 38-year-old female shows high signal intensity involving the periosteum and capsular attachments about the index finger proximal interphalangeal joint consistent with periostitis, enthesitis, and capsulitis (arrows) [Courtesy of Ali Balci MD, Izmir, Turkey]
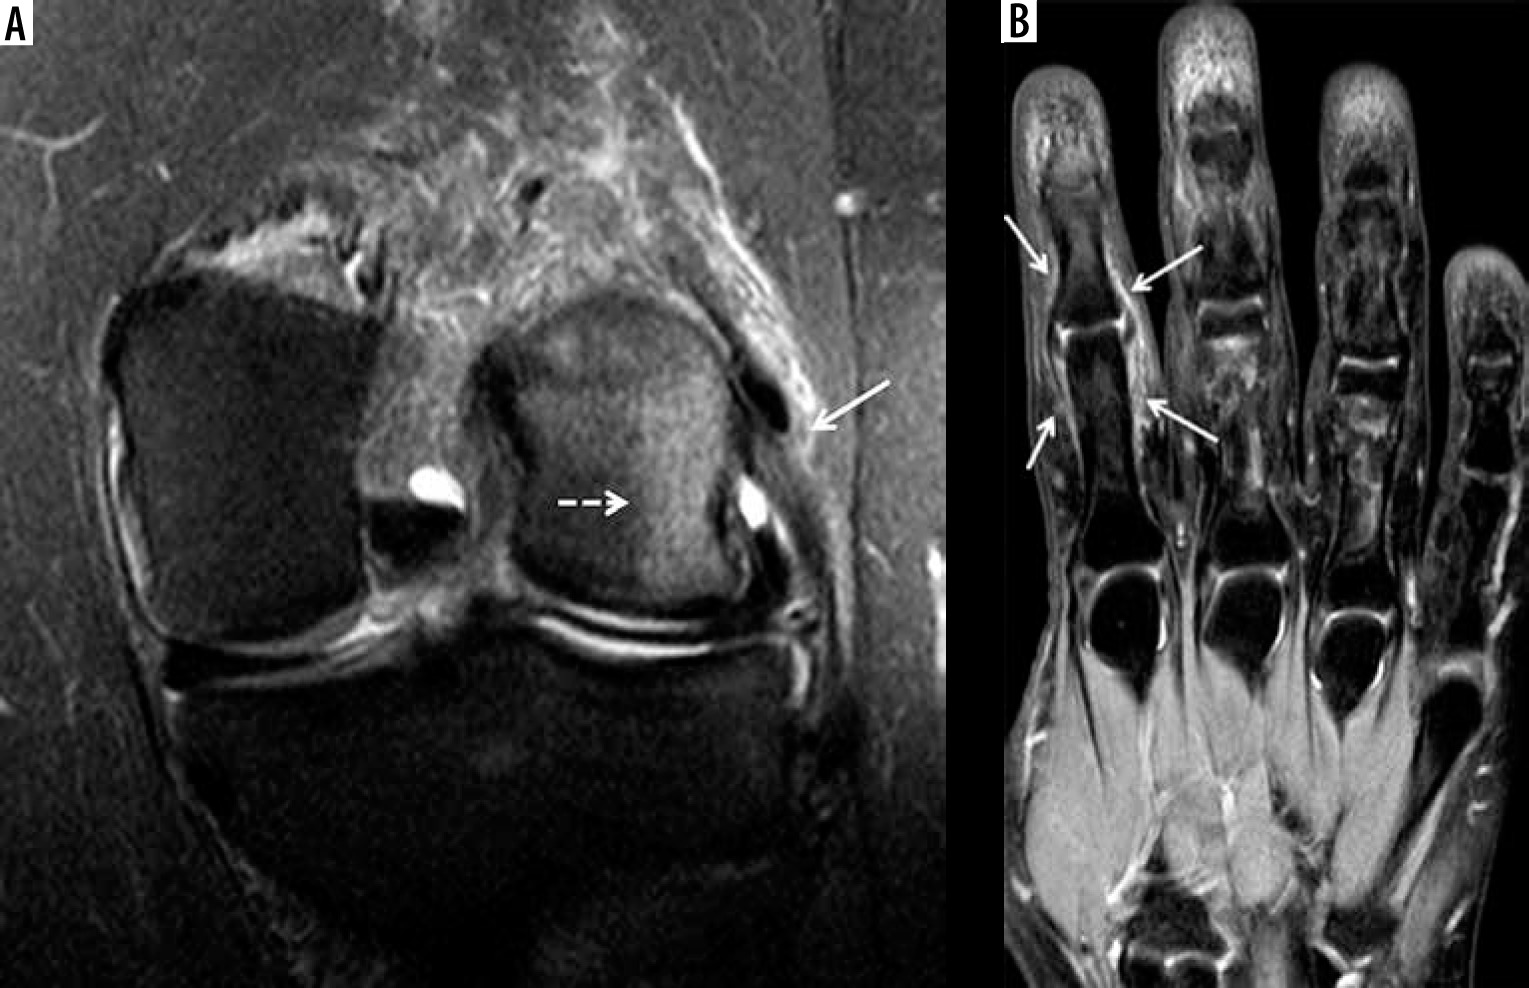
Figure 12
A 39-year-old female with psoriatic arthritis (PsA) and several-year history of intermittent finger pain and swelling. A) Coronal T2-weighted with fat-saturation (T2W FS) magnetic resonance (MR) image shows erosive and proliferative bone changes involving the index finger distal interphalangeal (DIP) joint with associated bone marrow oedema (BMO) (arrow). Note moderate size, high signal intensity synovial fluid complex in the middle finger proximal interphalangeal joints (PIP) joint (dashed arrow) related to synovitis and high signal intensity mild distension of the flexor tendon sheath consistent with tenosynovitis (arrowhead). B) Sagittal T1-weighted (T1W) MR image of the index finger shows erosive changes of the middle phalangeal head and distal phalangeal base in keeping with early pencil-in-cup deformity (arrow). C) Corresponding posteroanterior (PA) radiograph of the hand shows peripheral and central erosive and proliferative bone changes of the index finger DIP joint consistent with psoriatic arthritis
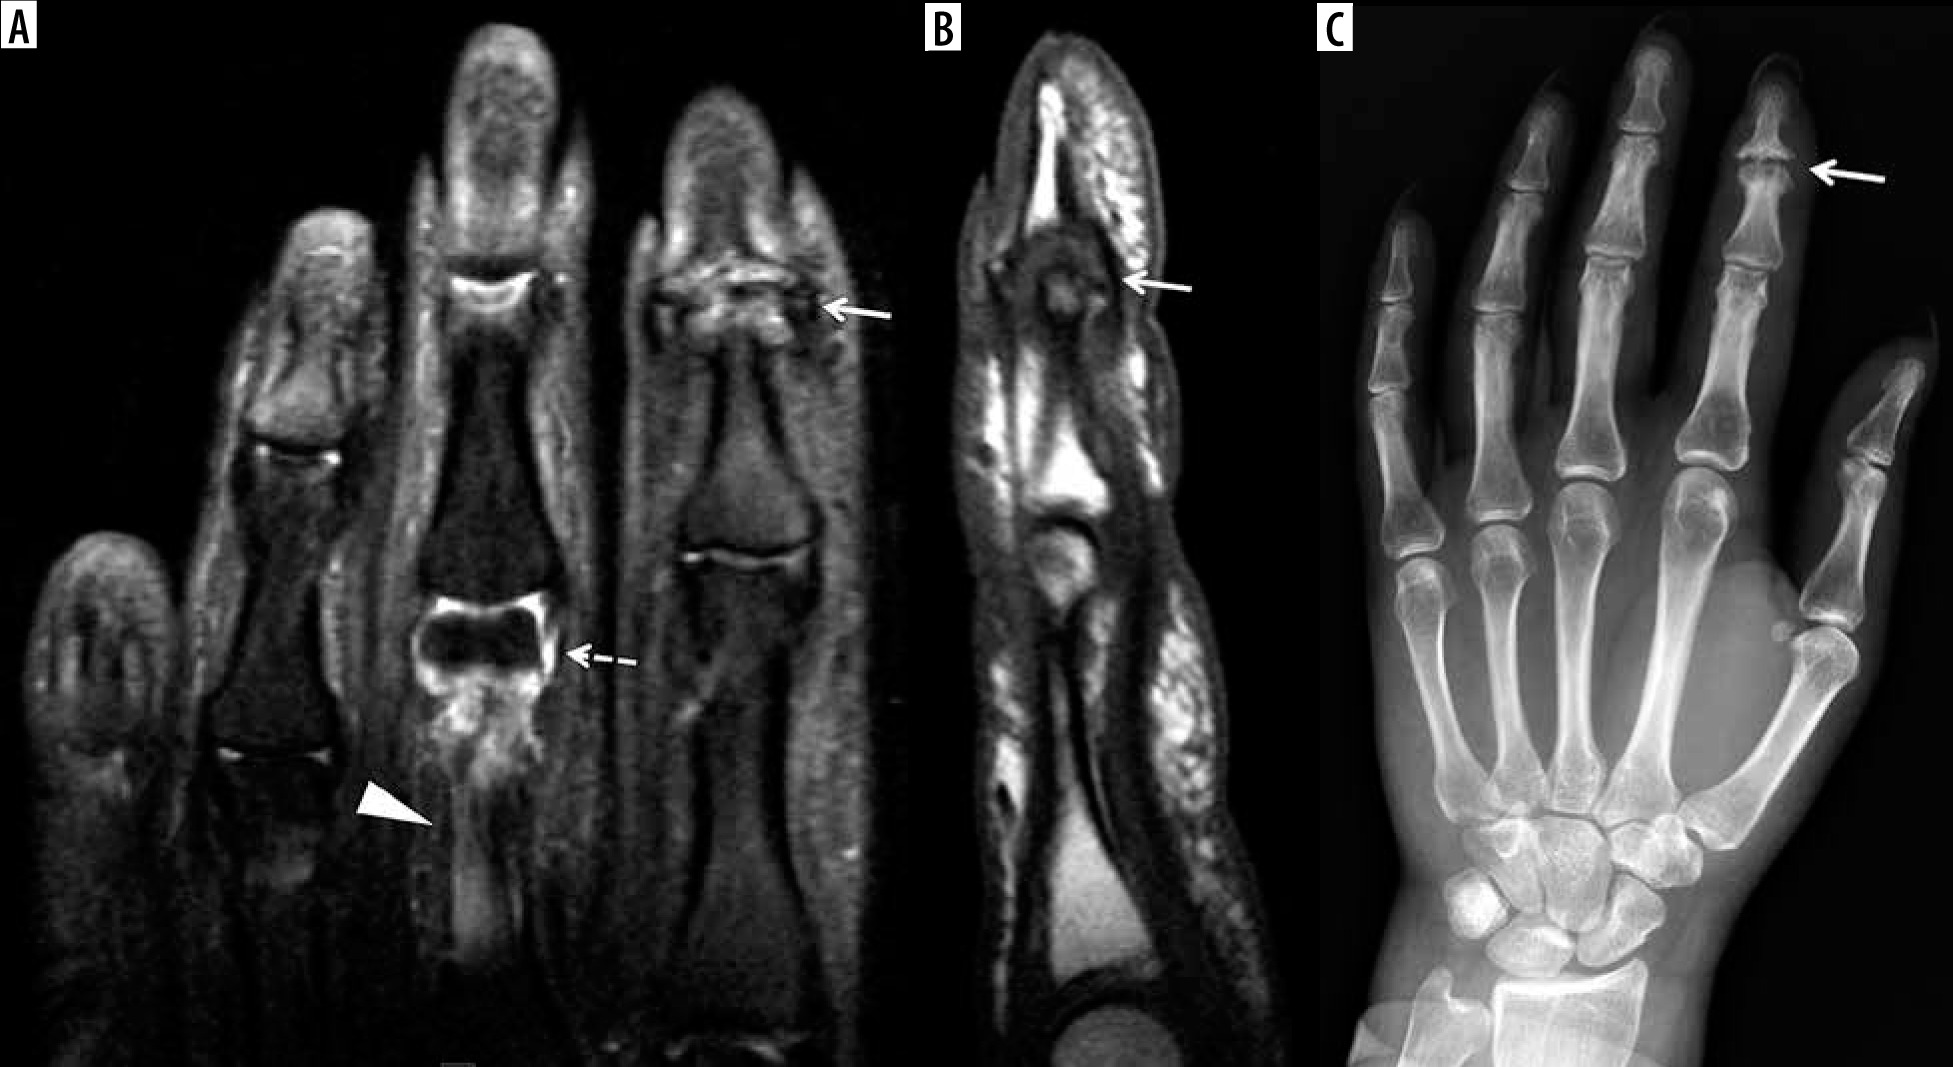
Figure 13
A 29-year-old male with psoriatic arthritis (PsA) and 2-year history of 4th toe pain and swelling. A) Sagittal short tau inversion recovery (STIR) magnetic resonance (MR) image shows high signal intensity bone marrow oedema (BMO) and periosteal oedema involving the 4th toe proximal phalanx with adjacent high signal intensity flexor tenosynovitis at the plantar aspect (arrow) and extensor peritendinitis at the dorsal side (solid arrowhead) and additional surrounding soft tissue inflammation at both plantar and dorsal aspect aspects. There is mild cortical irregularity of the 4th toe proximal phalangeal base and a mildly increased synovial fluid complex in the 4th metatarsophalangeal (MTP) joint (open arrowhead). B) On the post-contrast T1-weighted fat-saturation magnetic resonance (T1W FS MR) image note enhancing BMO and periosteal oedema in the 4th toe proximal phalanx (solid arrowhead), enhancing flexor tenosynovitis (arrows), and surrounding soft tissue inflammation (dashed arrow). C) Corresponding anterior posterior (AP) foot radiograph shows mild soft tissue oedema about the 4th toe with subtle periostitis about the proximal phalanx (arrows)
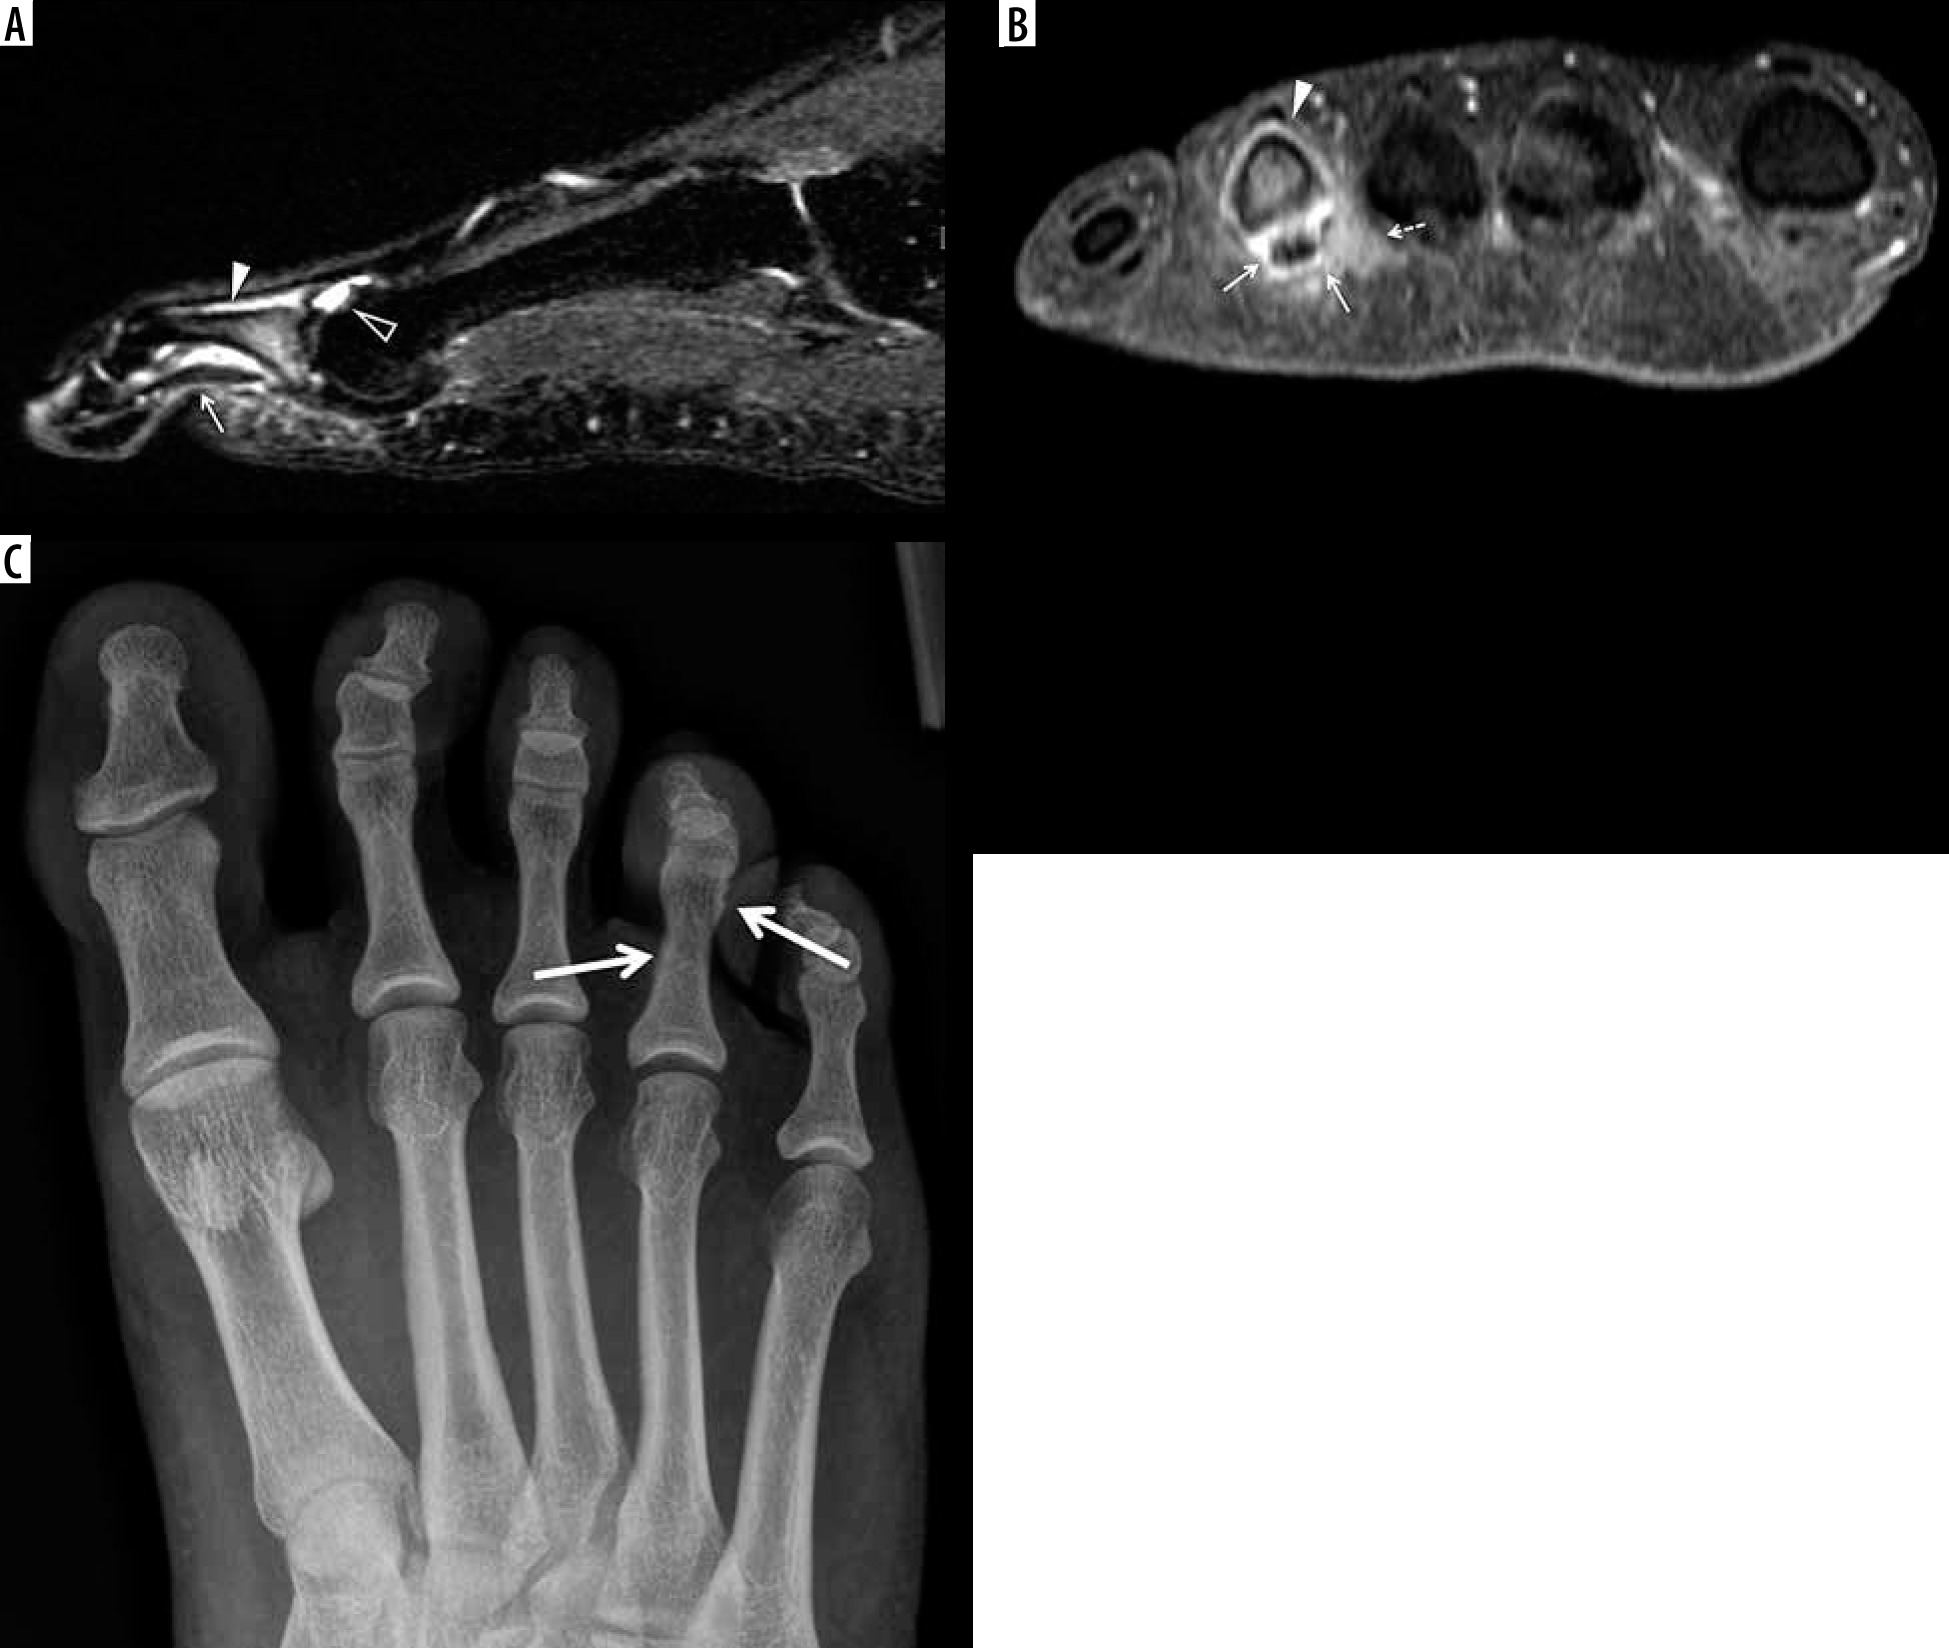
Figure 14
A 53-year-old female with intermittent bilateral hand arthralgias, stiffness, and swelling, right greater than left, for several months after having had COVID. Dynamic contrast-enhanced (DCE) imaging of the right hand was performed with coronal T1-weighted fat-saturation (T1W FS) volumetric interpolated breath-hold examination (VIBE) imaging every 12 seconds for 120 seconds. These images were performed before intravenous contrast administration (A), and at 24 (B), 96 (C), and 120 (D) sec following contrast administration, and show progressive synovial enhancement of the first carpometacarpal (CMC) (arrows) and 5th middle finger metacarpophalangeal (MCP) (dashed arrows) joints, and milder enhancement of the flexor bursa and 4th flexor tendon sheath at the level of the MCP joint (white arrowhead). E) Delayed postcontrast T1W FS spin echo coronal image demonstrates enhancement in a similar distribution, although the flexor bursal and fourth flexor tendon sheath synovitis is more conspicuous (white arrowheads), and there is mild flexor pollicis longus tenosynovitis (black arrowhead) that was not well-seen on the dynamic sequences. F) Axial subtraction imaging of pre- and post-contrast T1 axial SE imaging shows synovial enhancement around the first CMC joint (arrow) and the flexor bursa (arrowhead), consistent with active synovitis. Finally, axial non-contrast diffusion-weighted imaging (DWI) of the hand, including the (G) B50 and (H) B800 imaging and (I) apparent diffusion coefficient (ADC) map, shows areas of restricted diffusion around the 1st CMC joint (arrows) and 4th flexor tendon sheath/flexor bursa (arrowheads), in areas of active synovitis
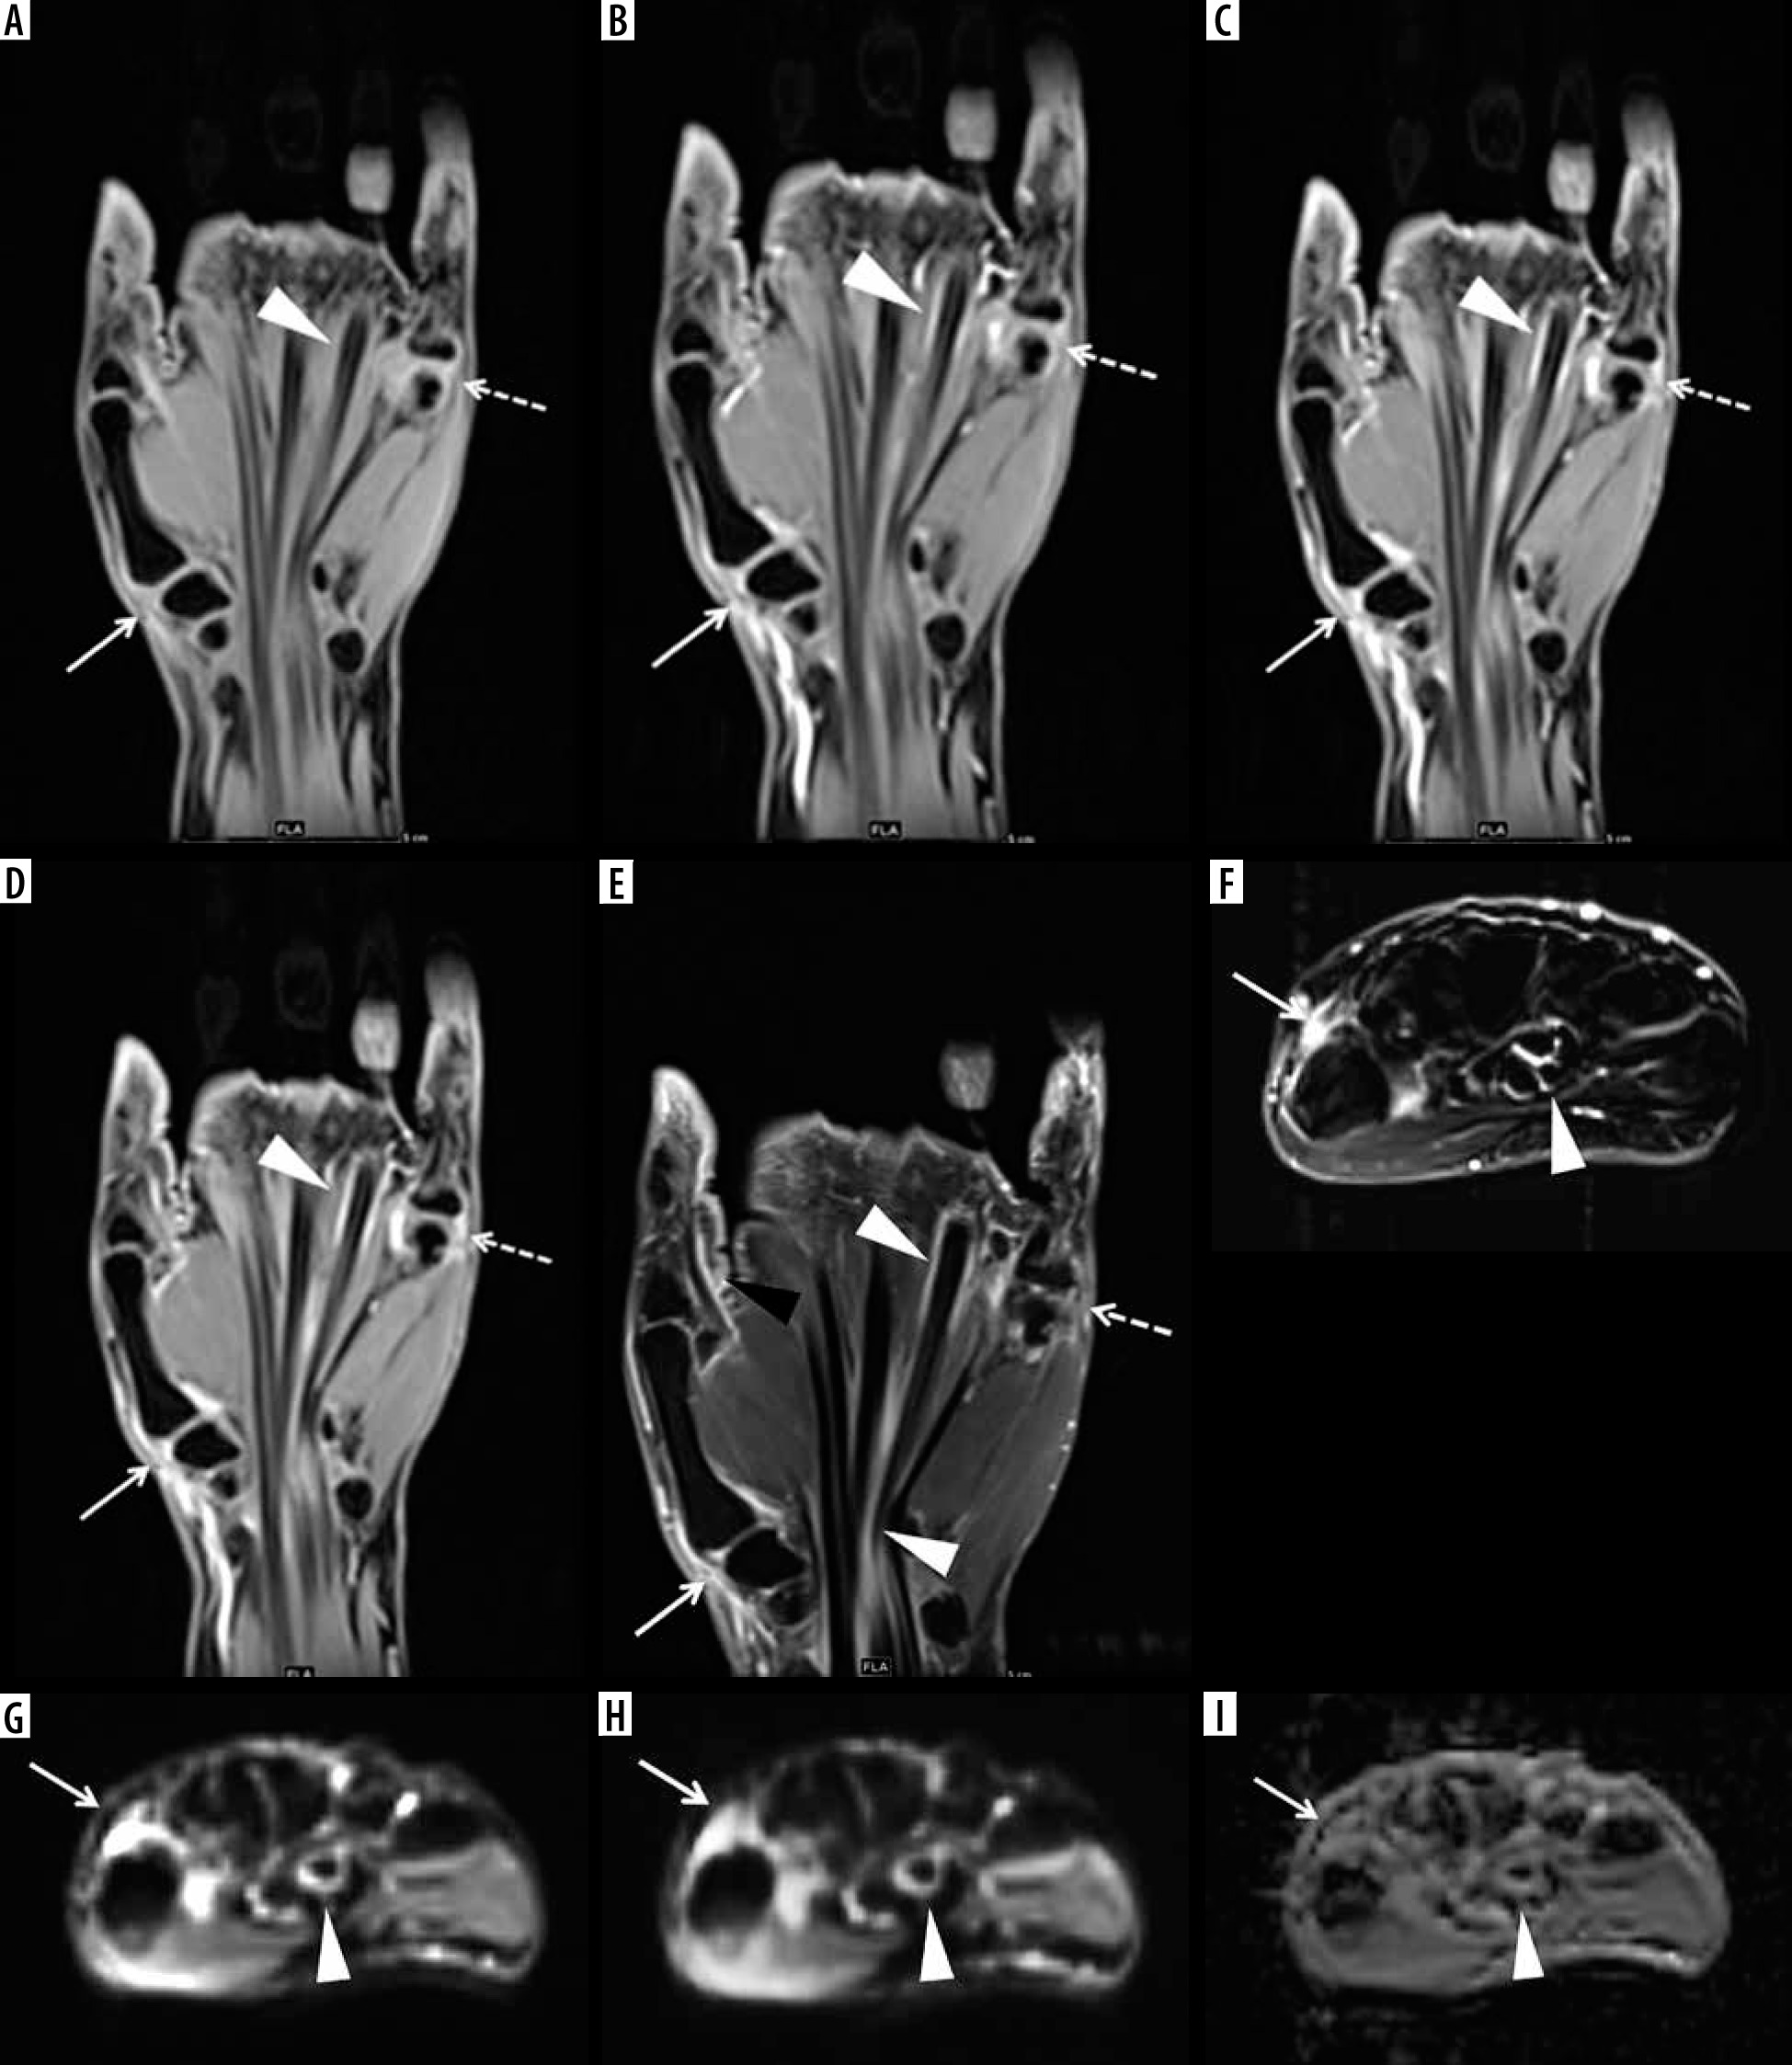
Figure 15
A 61-year-old male with ankylosing spondylitis (AS) and bilateral sacroiliitis. A) Anterior posterior (AP) radiograph of the pelvis shows subchondral sclerosis and cortical irregularities consistent with erosive bone changes about both sacroiliac joints related to sacroiliitis (arrows). B) Axial T1-weighted (T1W), (C) axial short tau inversion recovery (STIR), and (D) axial T1-weighted with fat-saturation (T1W FS) post-contrast magnetic resonance (MR) images of the pelvis redemonstrate erosive bone changes involving both sacroiliac joints with associated bone marrow oedema (BMO), significantly more pronounced about the right sacroiliac joint, showing intermediate signal intensity in B, high signal intensity in C, and enhancement in D consistent with chronic active sacroiliitis. Note enhancing synovial fluid complex in the right sacroiliac joint related to active synovitis
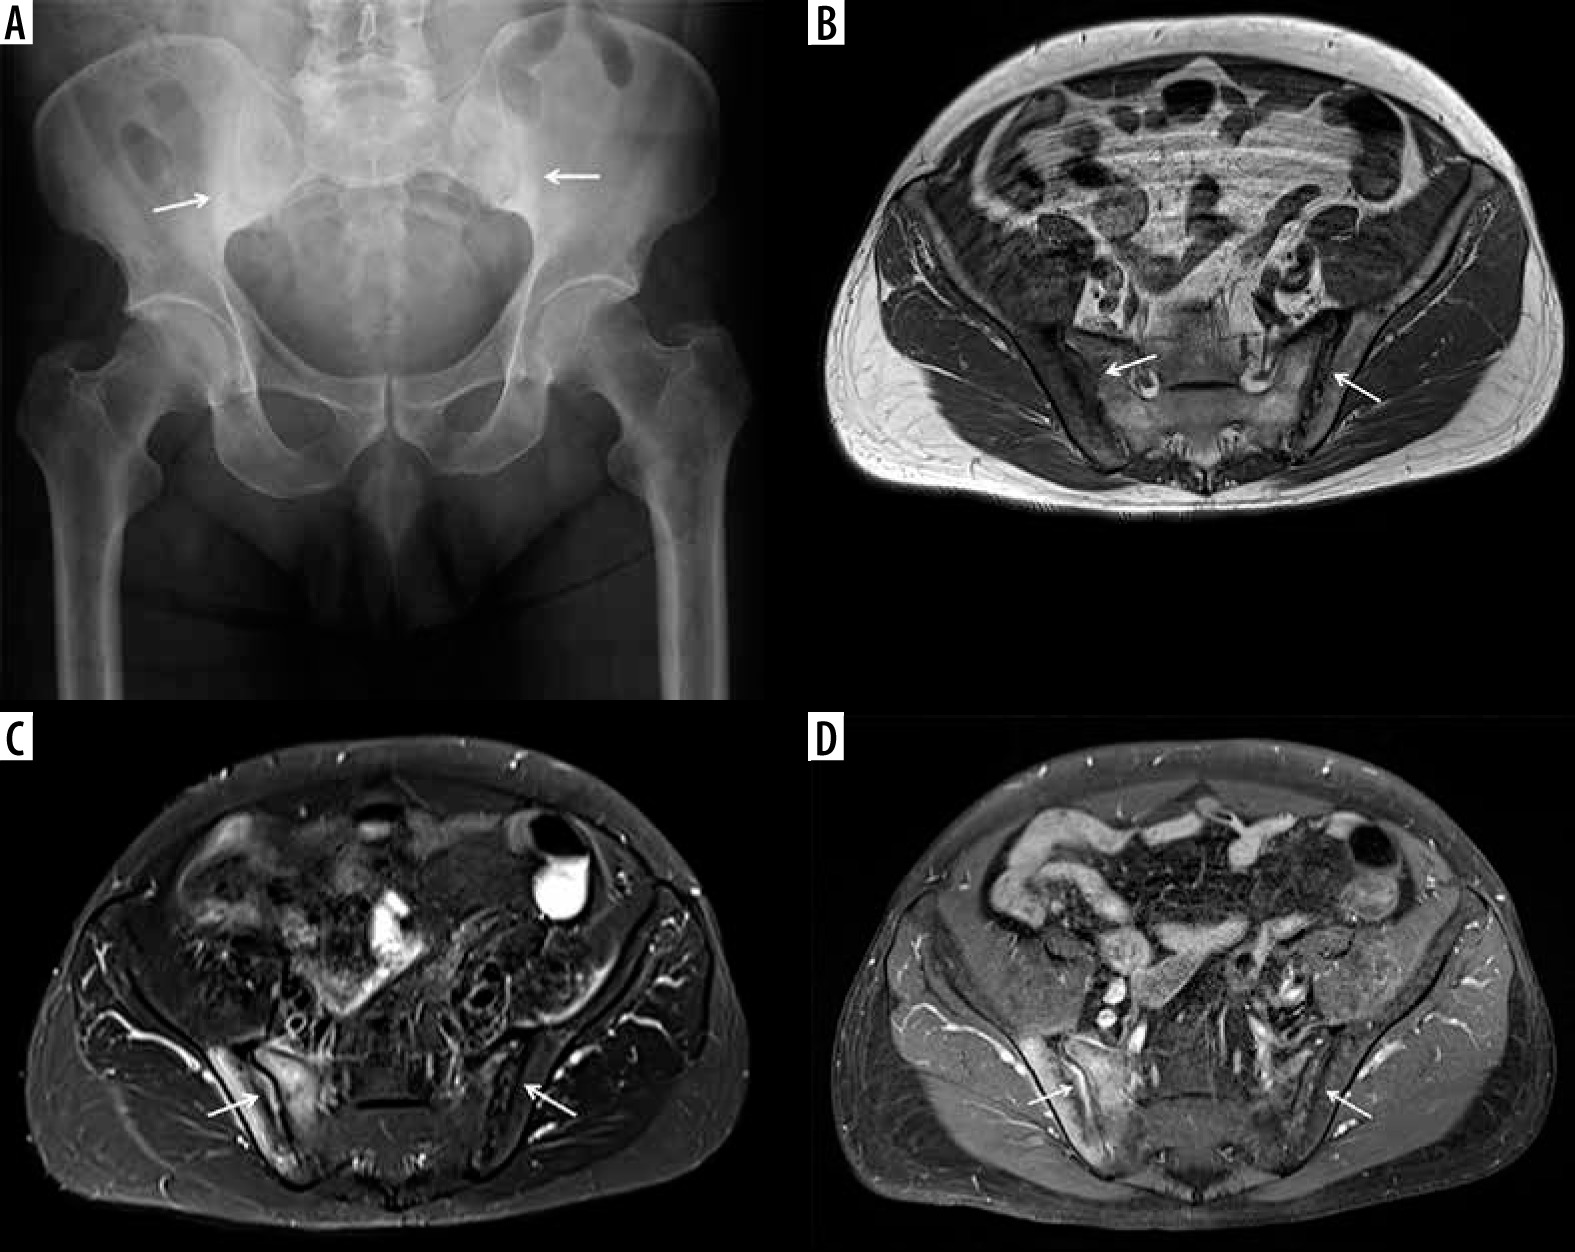
Figure 16
A 40-year-old male with ankylosing spondylitis (AS) and acute on chronic sacroiliitis. Coronal oblique short tau inversion recovery (STIR) magnetic resonance (MR) image of the sacrum and sacroiliac joints shows joint space narrowing with erosive bone changes about both sacroiliac joints with areas of subchondral low signal intensity related to fatty marrow and subchondral sclerosis associated with chronic post-inflammatory changes (arrows). Note scattered ill-defined foci of subchondral high signal intensity, most pronounced at iliac side of the right sacroiliac joint consistent with bone marrow oedema (BMO) related to active inflammation (dashed arrow)
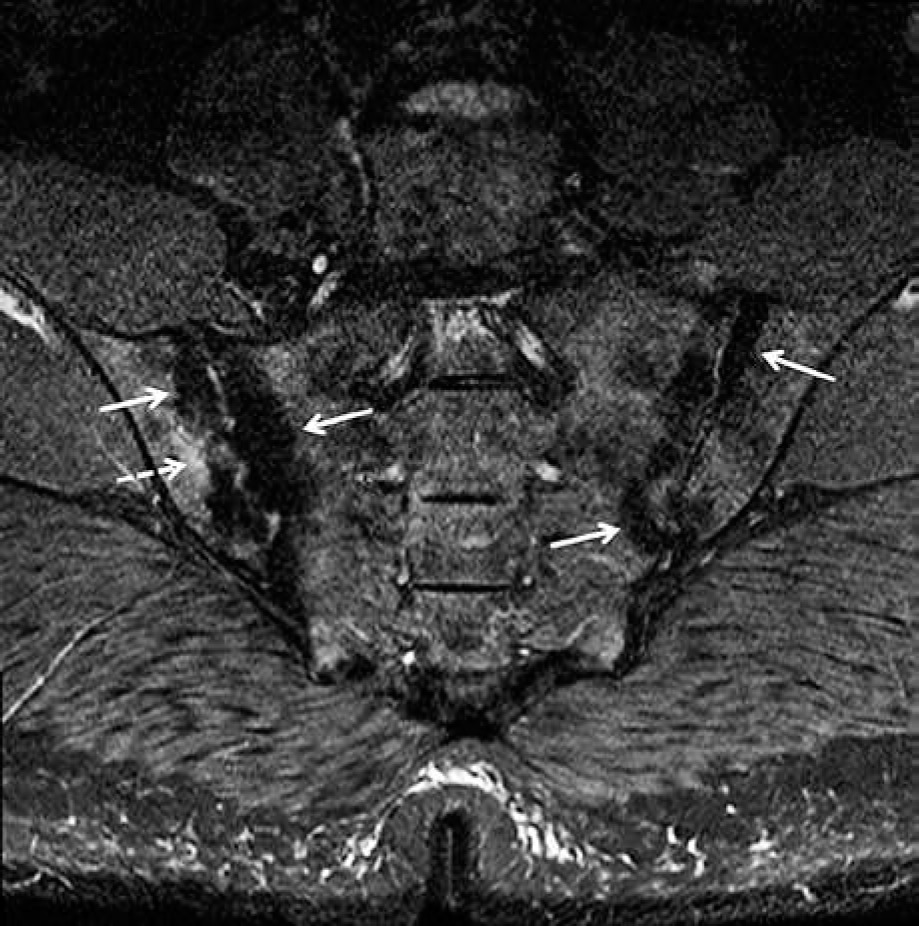
Figure 17
A 57-year-old male with longstanding ankylosing spondylitis (AS). Axial T1-weighted (T1W) magnetic resonance (MR) image shows osseous fusion of the right greater than left sacroiliac joints (arrows) with areas of high signal intensity prominent fatty marrow on the sacral sides in keeping with post-inflammatory change
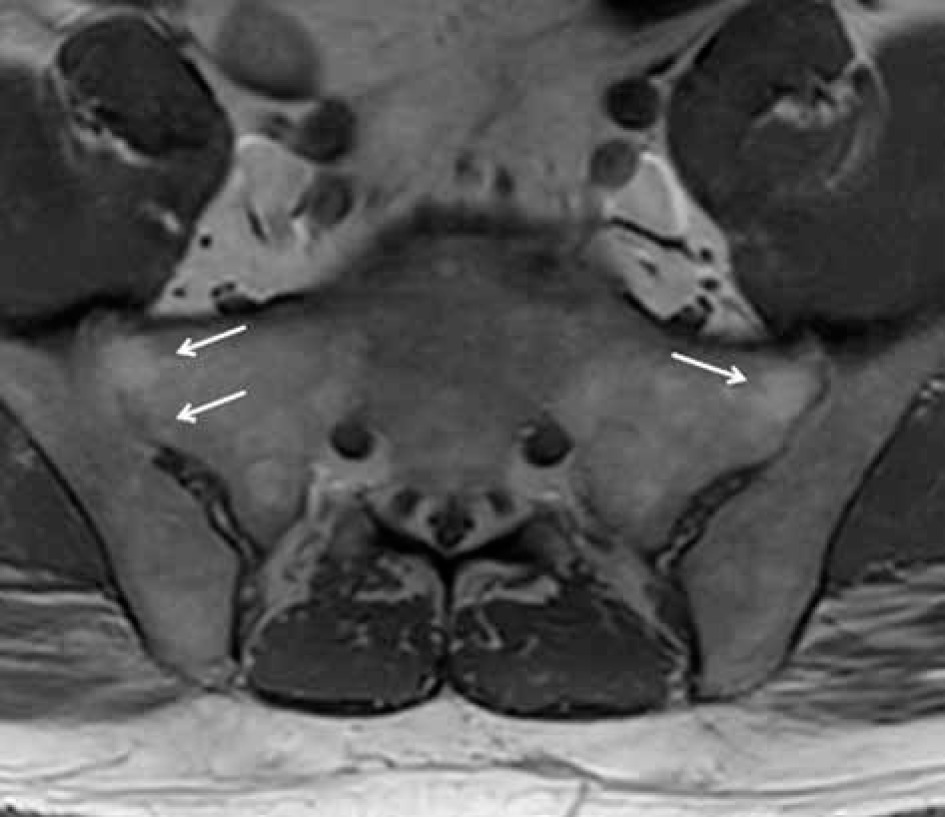
Figure 18
A 73-year-old male with longstanding ankylosing spondylitis (AS). Sagittal T1-weighted (T1W) magnetic resonance (MR) image shows ankylosis throughout the thoracic spine with anterior and posterior syndesmophytes. There is abnormal intermediate signal through the anterior syndesmophyte (arrow) at the inferior T6 vertebral body endplate, and intervertebral disc (fracture equivalent). There is no significant retropulsion
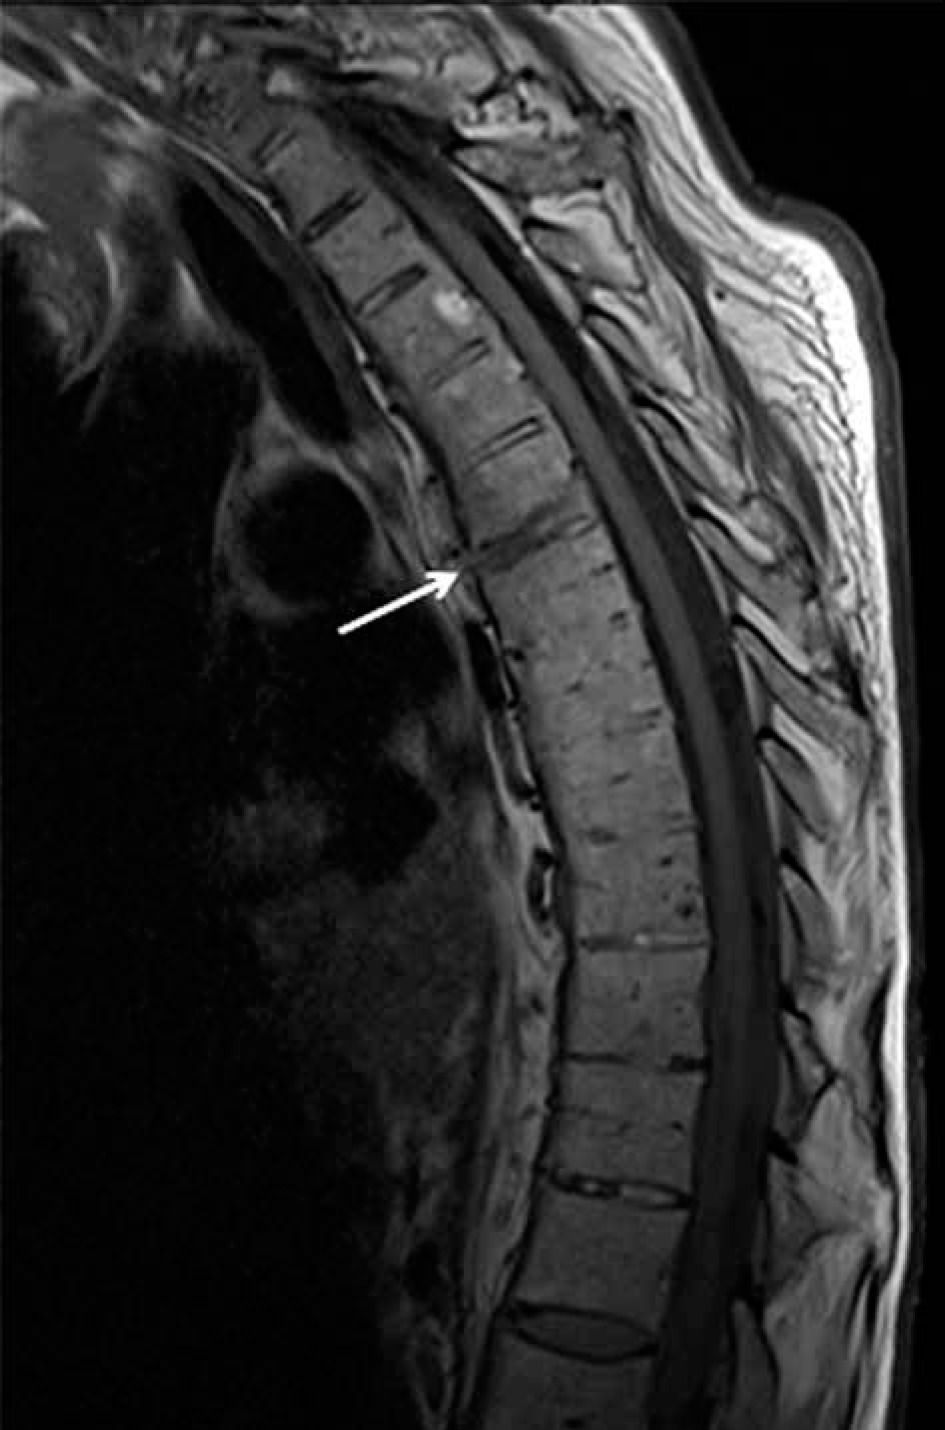
Figure 19
Andersson lesion and shiny corner. Artist’s drawing of the spine shows erosive bone changes at the opposed vertebral body endplates (black arrows) related to Andersson lesion and reactive sclerosis at the periphery of several superior and inferior vertebral body endplates consistent with shiny corners secondary to inflammatory erosions (green arrows)
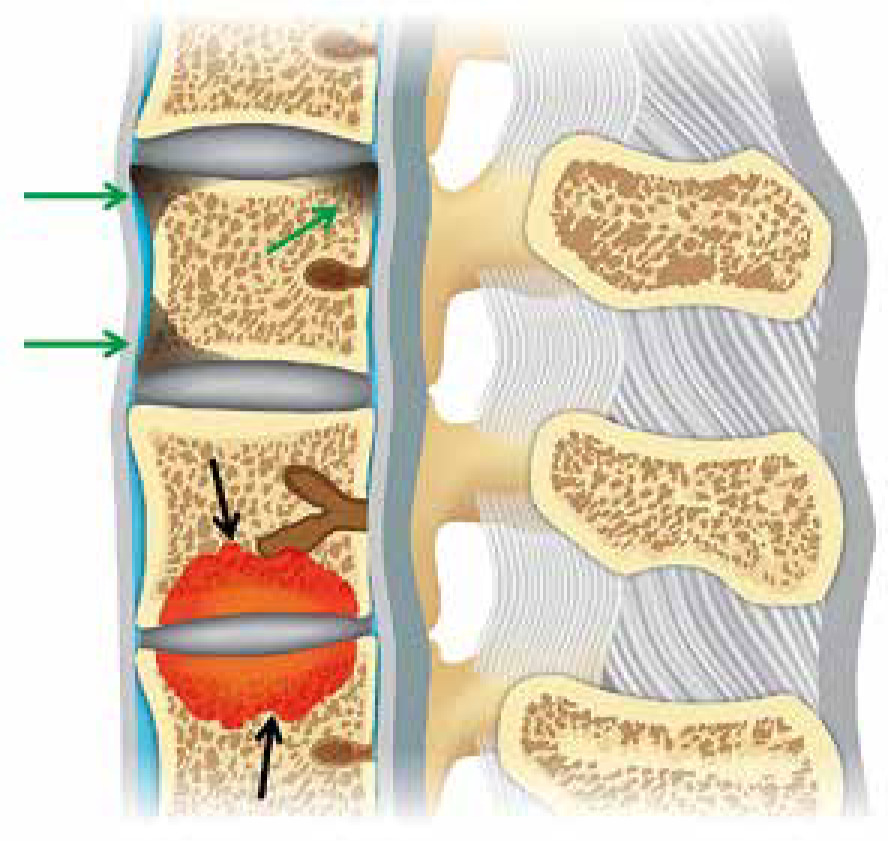
Figure 20
A 32-year-old male with ankylosing spondylitis (AS). A) Sagittal reformatted computed tomography (CT) image of the lumbar spine shows reactive sclerosis at the periphery of the superior and inferior endplates at multiple levels consistent with shiny corners secondary to inflammatory erosions (arrows). Note mild anterior squaring of the vertebral bodies, most prominent at L5 and partial fusion of the posterior elements. Sagittal (B) T2-weighted with fat-saturation and (C) T1-weighted (T1W) magnetic resonance (MR) images show signal hyperintensity at the shiny corners (arrows)
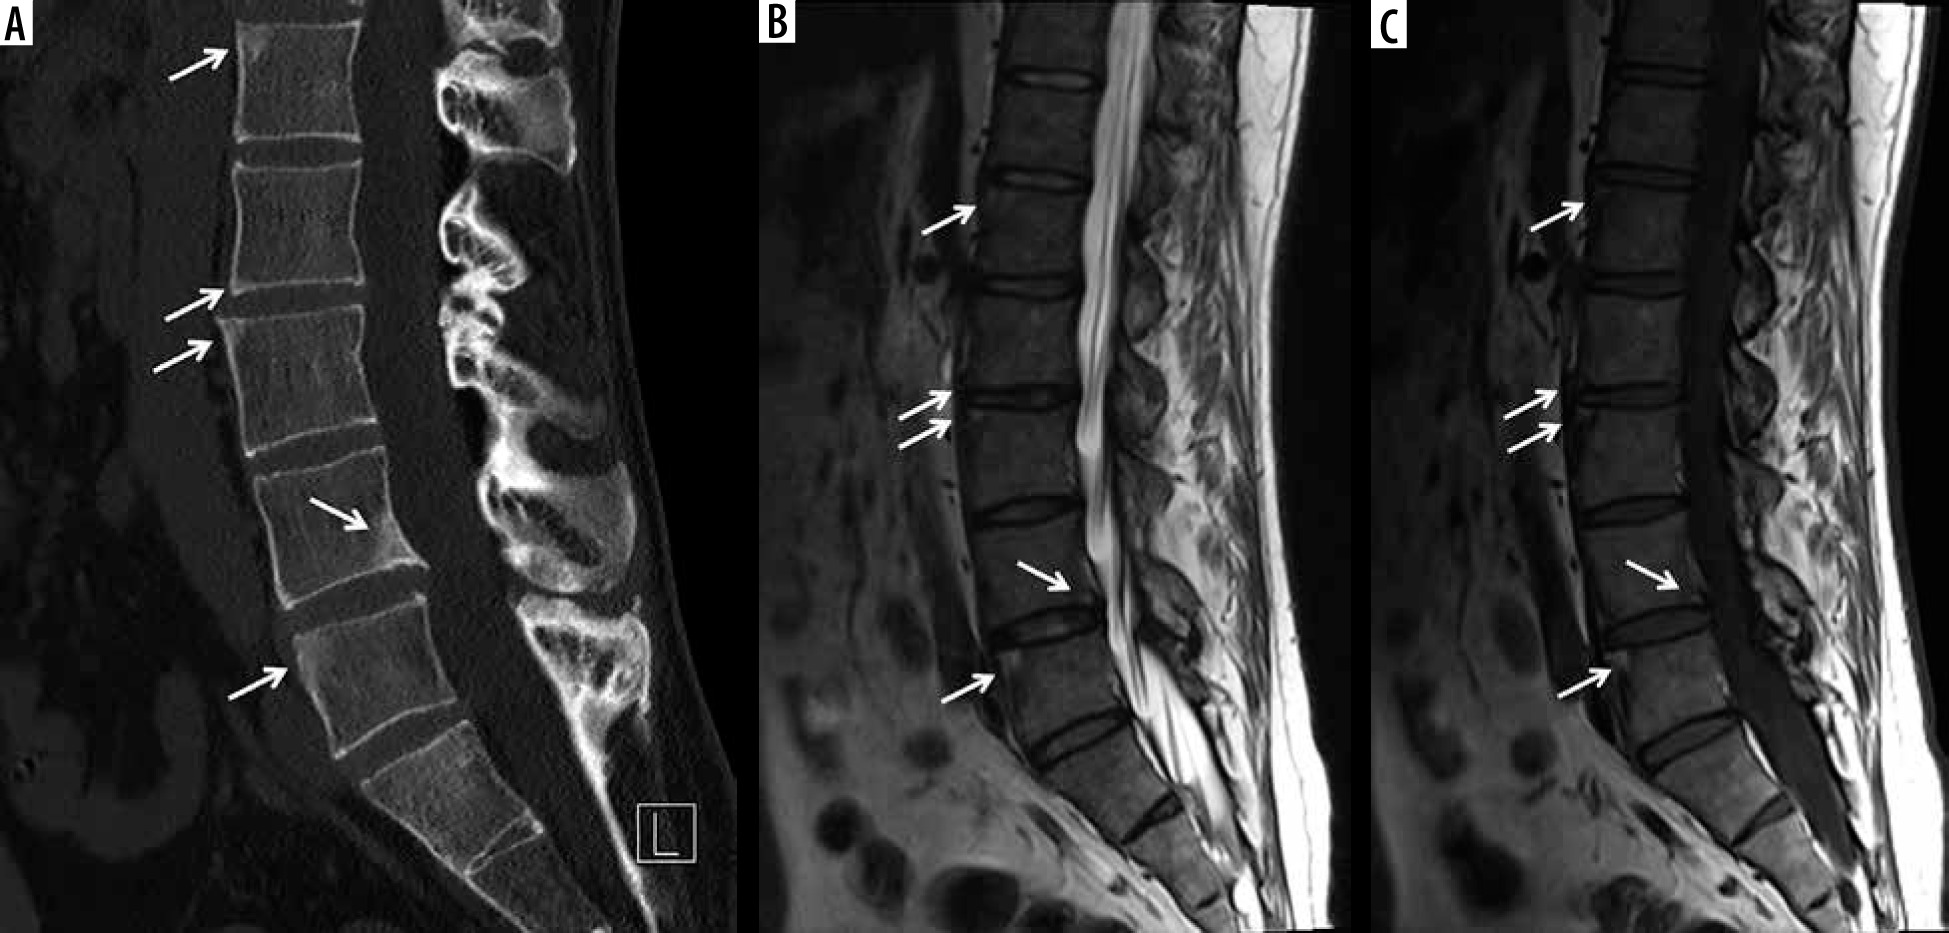
Figure 21
A 31-year-old male HLA-B27 positive with ankylosing spondylitis (AS). A) Sagittal T2-weighted with fat-saturation (T2W FS) and (B) sagittal T1-weighted with fat-saturation (T1W FS) post-contrast magnetic resonance (MR) images show high T2 signal (A) enhancing (B) bone marrow oedema about the erosive bone changes in the opposing vertebral body endplates at the L1-L2 level consistent with Andersson lesion. Note high T2 signal (A), enhancing (B) inflammatory erosion at the posterior superior endplate of L3 related to Romanus lesion (arrowhead). In A there is a high signal intensity throughout the posterior elements (dashed arrows) with enhancement at multiple levels in B related to osteitis and enthesitis [Courtesy of Blair Winegar MD, Salt Lake City, Utah, USA]
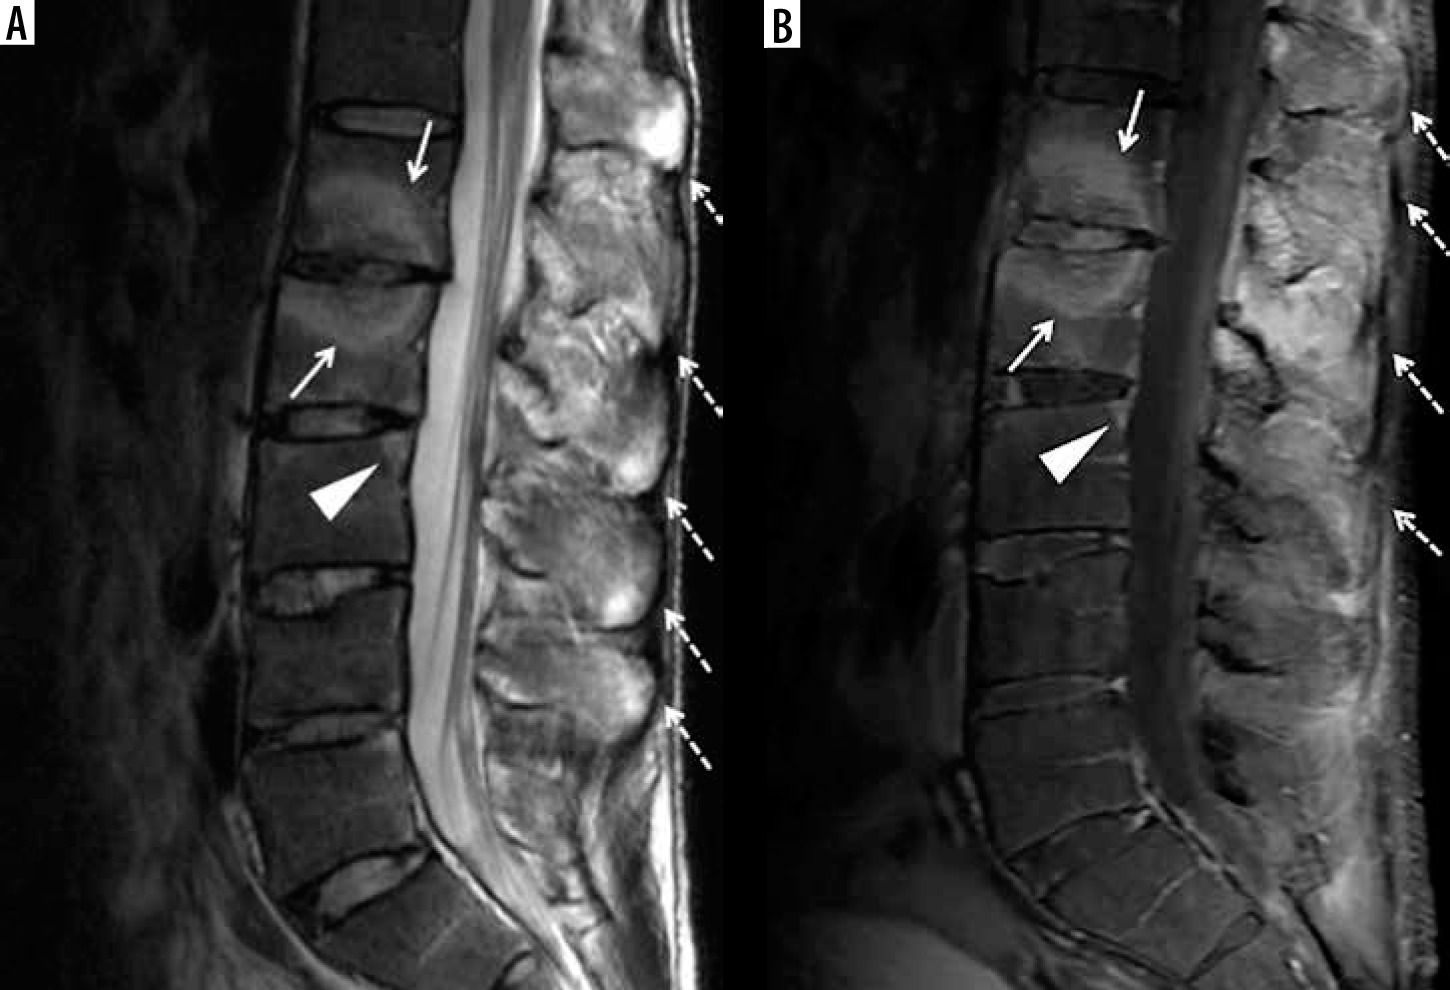
Figure 22
A 77-year-old female with end-stage knee osteoarthritis (OA). Coronal proton density-weighted with fat-saturation (PDW FS) magnetic resonance (MR) image shows scattered minimal subchondral bone marrow oedema (BMO) and cyst-like changes along the weightbearing surfaces of the medial compartment with near denudation of the overlying hyaline articular cartilage (arrows). Note marked narrowing of the lateral joint space compartment with overlying diffuse grade 2-3 chondral loss (dashed arrows) and large marginal osteophytes at the periphery of the femoral condyles (arrowheads)
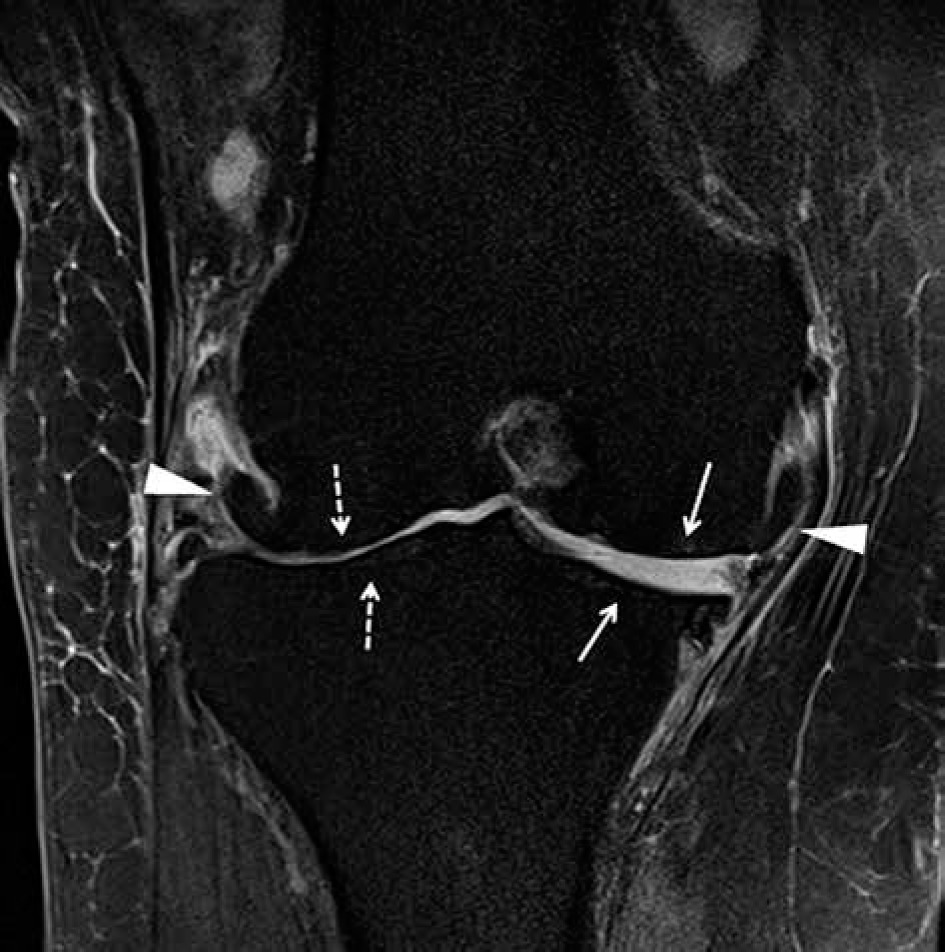
Figure 23
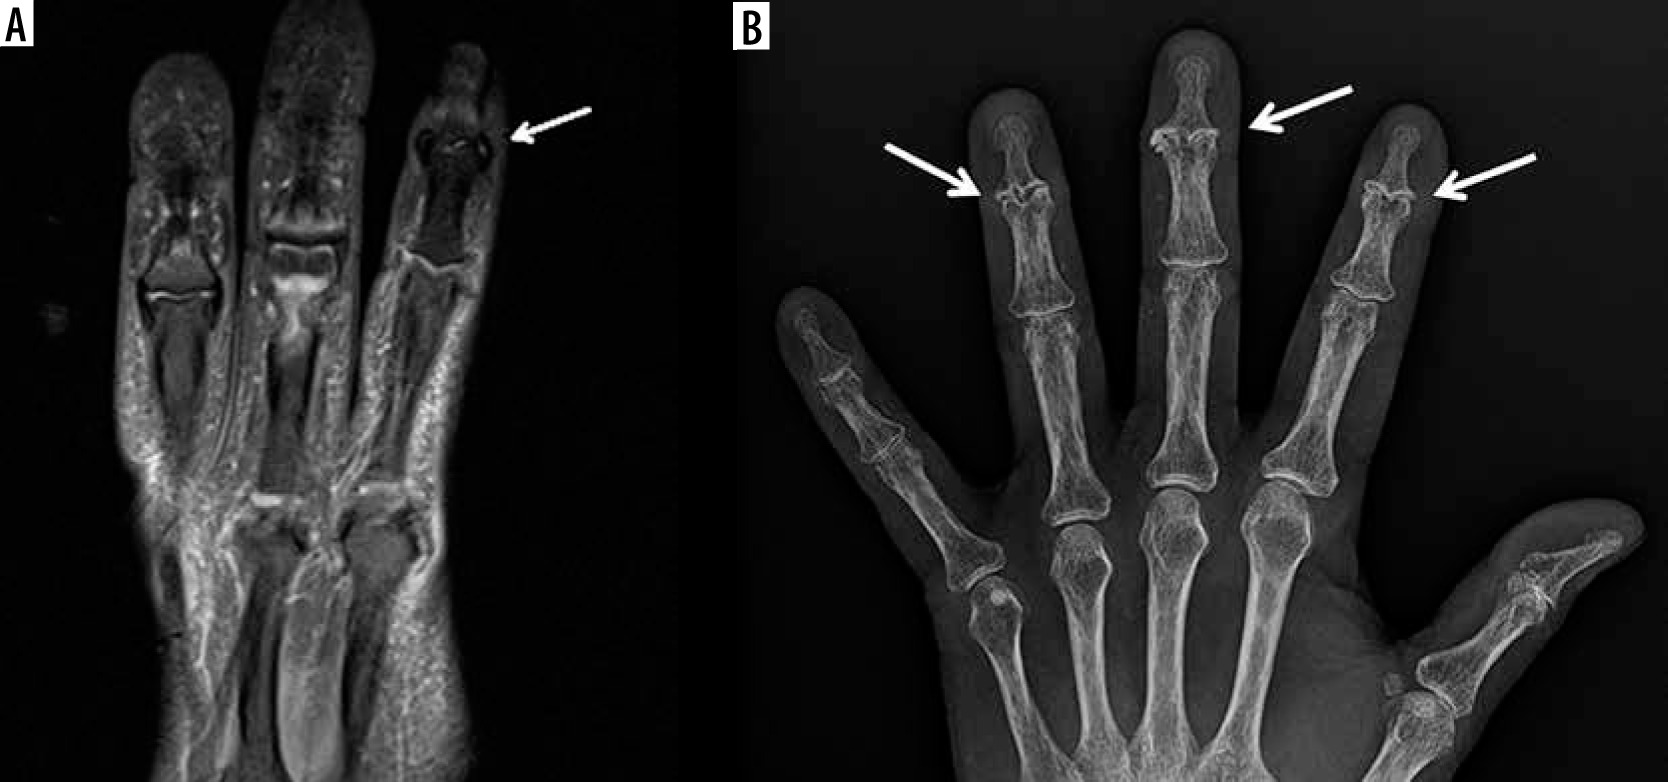
A 62-year-old female with chronic hand/finger pain and erosive osteoarthritis (EOA). A) Coronal proton density-weighted with fat-saturation (PDW FS) magnetic resonance (MR) image shows central erosive bone changes about the index finger distal interphalangeal (DIP) joint (arrow) related to chronic EOA without significant bone marrow oedema (BMO). B) Corresponding PA hand radiograph shows central erosive bone changes with “gull wing” configuration about the index, middle, and ring finger interphalangeal joints in keeping with EOA
Once a diagnosis is suggested, MRI is frequently helpful in assisting the clinician to make treatment decisions based on the clinical severity of disease and the imaging findings [1]. Many disease-specific medications are available for the treatment of rheumatological diseases, including disease modifying anti-rheumatic drugs (DMARDs) and biologic agents [1]. Because many of these drugs have potentially significant toxicities and economic costs, they are carefully selected based on the aggressiveness of the individual patient’s disease, treatment benefits, and risk factors [1].
After treatment is initiated, MRI is frequently used in monitoring the response to therapy, by evaluating changes in disease markers, such as the number and size of erosions, the degree of synovitis, and the persistence of BMO. These MRI findings, combined with clinical evaluation, can be used to assess the efficacy of treatment and to modify treatment as needed with the goal of obtaining remission as quickly as possible [1,3]. Finally, MRI may be critical in monitoring disease remission and is useful in detecting subclinical disease in patients with clinical remission.
Technical considerations
While there are different technical considerations depending on the MRI system being utilized (open versus closed bore, low versus high field strength, and coil technology) as well as the anatomic part to be imaged, most imaging protocols will consist of T1-weighted (T1W) and fluid-sensitive sequences, usually either T2-weighted images with fat saturation (T2W FS), proton density-weighted images with fat saturation (PDW FS), or short tau inversion recovery (STIR) images, obtained in at least 2 planes. Isotropic thin-cut 3D sequences enable subsequent reformatting in other imaging planes. The coil selection will depend on the body part to be imaged, with dedicated surface or closed coils preferred.
Although fluid and synovium may have similar signal intensities on unenhanced MRI, complex (non-simple fluid) fluid collections, synovial thickening, and chronic synovial proliferation can still often be differentiated on unenhanced imaging studies, because they often show lower signal intensity on fluid-sensitive sequences than simple fluid [4]. Intravenous administration of gadolinium-based contrast media allows for easier differentiation between active synovitis, simple effusions, and complex effusions [4,5]. T1W images should be obtained before and after the intravenous administration of contrast; these images are usually obtained with fat saturation to improve visualization of contrast enhancement. Subtraction images may help in determining the degree of enhancement.
Currently, many centres perform MRI of the hands and feet on high-resolution 3T scanners with dedicated closed or surface imaging coils. Unilateral imaging of the more symptomatic extremity or simultaneous bilateral imaging can be performed. If bilateral imaging of the hands is preferred, the hands may be placed palms together, separated by a block, with an MRI-compatible marker on the right hand, within the head coil. The hand MRI protocol is standardized in the Outcome Measures in Rheumatology (OMERACT) Rheumatoid Arthritis MRI scoring (RAMRIS) method, using a standardized scoring system for the assessment of synovitis, BMO, and erosions [5,6]. In this protocol, T1W images are obtained to assess erosions, fluid-sensitive images are obtained to evaluate BMO, and contrast-enhanced T1W fat-saturated images are obtained to evaluate synovitis and tenosynovitis [5-7].
For MRI evaluation of the sacroiliac joints, T1W and fluid-sensitive sequences should be obtained in the oblique coronal and axial planes. Contrast-enhanced imaging and DWI of the sacroiliac joints may be obtained as needed. Thin section gradient recalled echo sequences with fat saturation may help to evaluate subchondral bone plate abnormalities and erosions in the sacroiliac joints.
When imaging the spine, axial and sagittal T1W and fluid-sensitive images should be obtained with the field of view extending laterally to include the paravertebral synovial joints [4]. As with the sacroiliac joints, contrast-enhanced imaging and DWI of the spine may be obtained as needed.
Anatomy of synovial joints
The synovium is an approximately 0.5-5-mm-thick connective tissue layer that lines the inner surface of diarthrodial joint capsules, tendon sheaths, and bursae [8-10]. Synovial fluid, containing hyaluronic acid, is present within joint spaces and serves as a joint lubricant [8-10]. The synovial fluid also provides nutrition to the cartilage [8,10,11].
Hyaline cartilage covers the articular surfaces of the bones within a joint except the bare areas, which are located between the insertion of the joint capsule and the cartilage and where the bone is covered only by synovium [10,11]. The bare area is prone to earlier destructive changes from synovitis, resulting in marginal erosions.
Normal magnetic resonance imaging findings of joints and periarticular soft tissue
In normal joints, bones should have smooth cortical surfaces, without erosions or osseous proliferation [10] (Figure 1A). The joint capsule should not be distended with fluid or synovitis. Normal synovium has minimal, thin enhancement following intravenous contrast administration. Normal hyaline cartilage should have a smooth surface, with a gradient of homogeneous layers of varying signal intensity from the basal layers to the superficial layers. Tendons should have homogeneous low signal intensity, without distention of their tendon sheaths with fluid or synovitis. However, a small amount of fluid in the flexor tendon sheathes of the fingers may be a normal finding, in the absence of other pathologic findings [12]. Finally, normal bursae are not distended with fluid nor synovitis.
The sacroiliac joints have both ligamentous and synovial components. The inferior half of the joint is a true synovial joint, with the sacral surface lined by 3–5-mm-thick hyaline cartilage and the iliac side of the joint lined by 1-mm-thick fibrocartilage [13].
Magnetic resonance imaging findings in arthritides
Common findings in rheumatologic disease include BMO (Figures 2, 4, 7A, 12A, 13A-B, 15B-D, 16, 22), articular erosions (Figures 2, 3D, 6A-C, 7A, 8A-B, 12A-B, 15B-D, 16, 20, 23A), joint effusion (Figures 2, 3B, 4, 12A, 13A), synovitis (Figures 3A-C, 4, 7A, 12A, 13A, 14, 15D), tenosynovitis (Figures 3A-C, 12A, 13A-B, 14), and enthesitis (Figure 11) [10].
Bone marrow oedema and erosions
BMO, while nonspecific, is often present in early and active rheumatologic diseases. It is characterized by high signal intensity on fluid-sensitive sequences (Figures 2, 4, 7A, 12A, 13A, 15C, 16, 22) and enhancement on post-contrast T1W images with fat saturation (Figures 13B, 15D), and it may demonstrate low to intermediate signal on T1W images (Figures 2C, 15B).
An erosion is defined as an intra-articular discontinuity of the bone surface that is visible in 2 perpendicular planes. Acute erosions will enhance and may have irregular margins with adjacent enhancing active synovitis (Figures 2, 16) [14]; chronic erosions may appear more well-marginated with cortication, frequently without adjacent active synovitis (Figures 3D, 8A-B, 23A) [10].
Synovial fluid (joint effusion, synovitis, tenosynovitis)
Joint effusion is defined as distention of the joint capsule with either simple or complex fluid. On MRI, simple joint effusion is characterized by uniform low signal intensity on T1W images and high signal on fluid-sensitive sequences, with only thin peripheral synovial enhancement following intravenous contrast administration. Complex joint effusions show more heterogeneous signal intensity and enhancement (Figures 2, 3B, 4, 13A). Comparing adjacent joints can help to detect and characterize effusions in small joints [9].
In inflammatory arthropathies, joint effusion is often associated with synovial proliferation, which is abnormal thickening of the synovial lining (Figures 3A-C, 4, 7A, 12A, 13A, 14, 15D). Synovial inflammation, or synovitis, occurs when periarticular vasodilatation is followed by synovial proliferation and neoangiogenesis [10,15]. These new vessels promote continued synovial hyperplasia by providing nutrition and inflammatory cells [15]. On MRI, synovial proliferation appears as increased synovial volume [8,9]. Active synovitis is characterized by low to intermediate signal intensity on T1W images, and high signal intensity on fluid-sensitive images [9,11,16,17], which enhances following contrast administration (Figures 14, 15D). Chronic synovitis is lower in signal intensity (Figures 3A-C, 4, 8A-B) and demonstrates little to no enhancement following contrast enhancement. Contrast-enhanced MRI allows easier differentiation between enhancing synovium and fluid; synovium will enhance, while simple joint fluid will not. Enhancement of the synovium following intravenous contrast administration indicates hyperaemia and implies active inflammation and synovitis, similar to the presence of Doppler signal in the synovial tissues at colour Doppler or power Doppler ultrasound (US) [8,10,18]. However, if imaging is delayed more than 10 minutes after intravenous contrast administration, gadolinium may diffuse into the joint fluid, mimicking synovitis, creating an intravenous arthrogram effect [9,11,19].
In DCE MRI, T1W acquisitions are repeated several times following the intravenous injection of gadolinium-based contrast to assess the dynamics of synovial enhancement and thus estimate the degree of synovial vascularity, used more often in research than in clinical practice [7,8,16,20] (Figures 14A-E). In DCE MRI, early enhancement has been shown to reflect the inflammatory activity of the joint [8]. DCE MRI has been shown to be helpful in differentiating RA from OA [8,21]. Synovial volume can be assessed using manual and computer-assisted techniques [8,9,16]. Many semi-quantitative scoring schemes exist for the evaluation of synovitis; however, quantification of synovitis remains predominantly a research tool rather than of current clinical use [1,8,20].
Tenosynovitis and bursitis are defined as distention of the tendon sheath or bursa with either fluid and/or hypertrophied synovial tissue [10,18]. Contrast-enhanced MRI can help differentiate tendon sheath and bursal fluid from synovial hypertrophy, which may be inactive when there is no associated synovial enhancement to suggest hyperaemia, or it may be active when there is associated hyperaemia and inflammation [10,18].
Enthesitis
Entheses are the osseous insertion sites of ligaments, tendons, and joint capsules [22,23]. In active enthesitis, fluid-sensitive sequences will show subenthesial BMO and adjacent soft tissue oedema, which will enhance on post-contrast sequences. In more chronic disease, erosive changes and enthesopathy may be present [2]. Erosions form at the sites of the entheses [24].
Specific disease entities
Rheumatoid arthritis
Rheumatoid arthritis (RA) is a chronic, progressive, systemic autoimmune disease characterized by proliferative synovitis and inflammatory arthritis, resulting in disability and systemic complications [25]. It affects 1% of the world’s population; women are affected 2 to 3 times more than men [9-11,14,16,26]. This disease has a peak age of onset between 45 and 65 years [10,11] and has both genetic and environmental risk factors [4,11,25,26]. The main symptoms of RA are joint pain, stiffness, and impaired function.
In 2010 the American College of Rheumatology and the European League Against Rheumatism (EULAR) revised the classification criteria for RA, with priority placed on findings that occur early in RA, including joint symptoms and duration (< or > 6 weeks duration), serology (rheumatoid factor and anti-citrullinated protein antibodies), and acute-phase reactants (C-reactive protein and erythrocyte sedimentation rate), to predict which patients would eventually develop erosive disease [27].
Synovitis occurs early in RA, leading to the development of pannus, a focal tumourlike proliferation of hypertrophic, inflamed synovium [9,11,14,16] (Figure 1B). This synovial proliferation eventually leads to marginal erosions along the bare areas of the joints (Figures 2, 3B-C). If left untreated, there is eventual fibrous and osseous ankylosis of the affected joints [10]. Involvement of tendons, tendon sheaths, and bursae is common and can occur early or late in the course of the disease [10,11] (Figures 2-4).
RA most commonly involves the proximal small joints of the hands and feet in a bilateral, symmetric distribution without bone proliferation [10,22]. Symmetric arthritis of the hands is the initial presentation in more than 60% of patients presenting with RA [7,16]. Other commonly involved joints include the ankle, knee, hip, glenohumeral, and sacroiliac joints.
In the hands, RA often involves the metacarpophalangeal (MCP), proximal interphalangeal (PIP), midcarpal, radiocarpal, and distal radioulnar joints, and the ulnar styloid process [22]. Ulnar deviation of the fingers occurs at the MCP joints [22]. Deformities of the fingers include swan neck deformity, with hyperextension at the PIP joints and flexion at the distal interphalangeal (DIP) joints, and boutonnière deformity, with flexion at the PIP joints and hyperextension at the DIP joints. Tenosynovitis of the hands and wrists is highly specific for early RA [7,28,29]. Hand and wrist tendon rupture occurs spontaneously in at least 1% of patients with chronic RA [30]. Finger extensor tendons are more commonly torn compared with flexor tendons [30,31]. Tendon rupture can occur due to tendons rubbing along the eroded bone, or due to ischaemia from tenosynovitis or a change in tendon collagen [30].
In the feet, RA often involves the metatarsophalangeal (MTP), PIP, and tarsal joints. The lateral plantar aspect of the fifth metatarsal head is often the first site of bone erosion in the foot [4,22]. A recent postmortem study has shown that the presence of tenosynovitis at the level of the MTP joints is highly specific for RA [28,32]. The retrocalcaneal bursa is a common site of RA involvement, leading to eventual erosive change of the adjacent calcaneus [22].
In the spine, RA may lead to erosions of the odontoid process, resulting in widening of the anterior atlantodens interval (> 3 mm in adults), accentuated with neck flexion [22]. This can lead to instability and subluxation that can result in spinal cord compression [11].
In the pre-erosive stage of RA, radiographs are usually normal; additionally, synovitis can be difficult to appreciate both clinically and on radiographs [16,33]. It is thought that treatment should be initiated within 3-6 months of synovitis onset to prevent irreversible structural damage (erosions, cartilage damage, and tendon rupture) [9,30,34]. Because early initiation of treatment with DMARDs or biologic agents [5,17,26] is important to mitigate irreversible joint destruction and attain clinical remission, there has been increased use of both high-resolution US and MRI for the detection of early disease [7,10]. MRI may detect bone erosions at least 1 year earlier than radiographs [36]. Conaghan et al. showed that MRI assessment of structural damages at months 1 and 3 of treatment for RA was better at predicting response to treatment than clinical evaluation of response to treatment in those 3 months [37]. MRI can also be used to differentiate active from treated disease. Disease activity should be assessed frequently to ensure proper treatment regiments. Despite clinical remission with normal clinical examination and laboratory studies, subclinical active inflammatory disease can persist and result in progressive bone destruction [4,17,38-41]. MRI is useful in detecting this subclinical synovitis in patients with clinical remission, and it can more accurately evaluate the disease status.
For screening of suspected early RA, contrast-enhanced MRI of the hands is useful in detecting active synovitis, and it will frequently show bilateral enhancement of the wrist, MCP, and PIP joints [33]. On MRI, BMO and enhancement, joint effusions, synovitis, and tenosynovitis are the first signs of RA. BMO is a known precursor to erosions [3,14,35,41,42]. In the hand and wrist, BMO is a predictor of future negative outcomes [1,30,35,43-46]. As the disease progresses, the erosions that initially occur at the bare areas will extend centrally leading to progressive cartilage and bone destruction [11]. Destructive cartilage and bone changes may result in intra-articular bodies [11]. Rice bodies, which are small particles of varying substances, are a form of intraarticular body that may form in RA. In the wrist, the dorsal extensor compartments and the extensor carpi ulnaris tendon are frequently involved in early RA to varying extents ranging from tendinosis and tenosynovitis to partial-thickness tears and tendon ruptures [9,31,47]. The flexor tendons of the hand are also often affected, and tenosynovitis of these tendons is more specific for the diagnosis of early RA than for other arthropathies. However, flexor tenosynovitis decreases in frequency as the disease progresses [1,7,41].
Crystalline arthropathies: gouty and calcium pyrophosphate deposition arthropathies
Gouty arthropathy
Gout is a metabolic disease with a genetic predisposition that affects 1-2% of the population; it is more common in older individuals, with more than 95% of cases occurring in males [10,48-51]. Disordered purine metabolism associated with underexcretion or overproduction of uric acid causes hyperuricaemia, leading to eventual monosodium urate (MSU) crystal deposition in joints, periarticular soft tissues, and tendons [10,48] (Figures 5-7). Gout can be exacerbated by certain dietary factors.
Gout has 4 phases: asymptomatic hyperuricaemia, and acute, intercritical, and chronic gout. Acute gouty arthritis most often begins in the lower extremity and involves the first MTP joint, known as podagra, in approximately 50% of patients [10,48,52,53] (Figure 6). Other frequent sites of involvement include the tarsal joints, ankles, and knees, elbows (Figure 7), and hands [10,48]. In an acute gouty attack, patients will present with pain, swelling, and erythema of the affected joint, which may mimic infection and typically resolves within a few days. The asymptomatic intervals between episodes of acute gouty attacks are known as intercritical gout. Later attacks may last longer and affect several joints [10,48,49].
Repetitive attacks of acute arthritis often progress to chronic arthropathy, with chronic synovitis, tophus formation and deposition, and erosions [48-50] (Figures 6, 7). If untreated, 30% of patients develop tophaceous gout within 5 years [10,54]. Tophaceous gout consists of painless soft-tissue masses that occur in the periarticular soft tissues, tendons, and bursae, from chronic granulomatous reaction to MSU crystals [48,50,53]. Tophi occur most often in the hands and wrists and on the extensor surface of the knees and elbows [48,51]. These tophaceous deposits can cause eventual osseous erosions.
In early gouty arthropathy, radiographs are often normal. Erosions may not be radiographically apparent until 6-12 years after the initial acute gout attack [55]. US, dual-energy CT (DECT), and MRI can be used for early diagnosis and assessment of gout. MRI can show bone marrow and soft tissue oedema as well as simple or complex joint effusions and synovitis in early gout [48,52].
Carter et al. found that synovial pannus persists on MRI even during periods of intercritical gout [56], showing that chronic inflammation maybe present even if clinically silent.
In chronic gout, erosions are visible as cortical disruption with overhanging edges on MRI with associated intra-articular and extra-articular soft-tissue tophi that may calcify. Erosions often have minimal surrounding BMO until late disease, and cartilage surfaces are also spared from erosive changes until late disease [52,53,57]. While BMO and synovitis do not predict eventual erosions in gout, the presence of tophi does [52,58]. Cartilage damage is generally less severe and more focal in gout than in RA, usually involving 1-2 joints. On the other hand, RA is often more diffuse and affects multiple joints [59,60]. When cartilage damage occurs in chronic gout, it is associated with erosions, synovitis, and tophi [48,57], and it is often associated with OA [57].
Crystal deposition may also occur in periarticular soft tissues, hyaline cartilage, tendons, and bursae, and MRI can localize gouty deposits and demonstrate the extent of gout involvement of the bursae and tendons [48,50] (Figure 7). On MRI, tophi display heterogeneously low signal on T1W images and heterogeneously high to intermediate signal on fluid-sensitive images, with usually heterogeneous enhancement on post-contrast sequences. Areas of low signal and non-enhancement may be seen due to calcification. Intratendinous tophaceous deposits are also readily visible on MRI. Unlike ultrasound, which can detect crystal deposition on hyaline cartilage (the “double contour” sign), MRI does not permit visualization of gout crystal deposition on the surfaces of the hyaline cartilage [48,50].
Calcium pyrophosphate deposition arthropathy
CPPD is a metabolic arthropathy secondary to deposition of calcium pyrophosphate dihydrate crystals in the articular and periarticular tissues, and may be sporadic, hereditary, or secondary [61-63]. Sporadic CPPD typically occurs equally in middle aged to elderly males and females, and it is associated with OA [10,61-64]. Hereditary CPPD is more common in females [62,63], while primary CPPD occurs in younger patients (< 55 years) [10,62,65]. Secondary CPPD occurs in metabolic diseases such as hyperparathyroidism, haemochromatosis, ochronosis, hypophosphatasia, and others [61].
CPPD leads to chondrocalcinosis, which is calcification of the synovium, joint capsule, tendons, ligaments, hyaline articular cartilage, and fibrocartilage [10,61,66]. Not all chondrocalcinosis is the result of CPPD; it can also occur secondary to dicalcium phosphate dihydrate or calcium hydroxyapatite crystals [63]. Clinically, CPPD can lead to pseudogout, which is an acute inflammatory process of the joint from shedding of crystals into the joint that mimics a gouty attack or infection. CPPD can eventually lead to joint destruction, known as pyrophosphate arthropathy [63]. The most common sites of involvement include the knee, wrist, hand, pubic symphysis, and hip joints [10,52].
CPPD arthropathy imaging findings are similar to those found in OA, but often with an atypical joint distribution, including the radiocarpal joint, the second and third MCP joints, and the patellofemoral compartment of the knee [61,66] (Figure 8). In the spine, CPPD can present as “crowned dens syndrome”, with calcification around the dens within the transverse ligament of the atlas, the cruciate ligaments, the alar ligaments, and the articular capsule [52] (Figure 9).
In CPPD, MRI may be associated with either simple or complex joint effusions and synovitis. Chondrocalcinosis, particularly in its early stages, may be difficult to detect on radiographs and MRI (Figure 8). In the knee, signal abnormality from chondrocalcinosis can mimic a meniscal tear on MRI. Calcium pyrophosphate deposition in tendons can result in intrasubstance low signal intensity.
Psoriatic arthritis and reactive arthritis
PsA and reactive arthritis are seronegative spondyloarthropathies with a high association with HLA-B27 [67]. The hallmarks of PsA and reactive arthritis include joint inflammation and erosions, bone proliferation, periostitis, and enthesitis [22,23,68]. PsA and reactive arthritis have similar imaging findings, and the diagnosis is often made clinically and with laboratory data.
Psoriatic arthritis
Psoriasis affects approximately 1-2% of the population; PsA is an asymmetric inflammatory arthritis that occurs in 10-15% of people with psoriasis; up to 60% of these patients are HLA-B27 positive [22,67]. Psoriasis occurs equally in males and females, with an average age of onset of 30-50 years [10,67]. Clinical evidence of psoriasis, with characteristic skin and nail changes, can aid in the diagnosis of PsA, but arthritis can occasionally occur before dermatological changes [22,67]. Early diagnosis of PsA is important, and even a 6-month delay in treatment initiation affects the functional prognosis [69].
PsA primarily involves the entheses, with secondary joint and spine involvement [10,23], enthesitis may occur before synovitis [68] (Figures 10, 11). This disease may present as a monoarthropathy or a polyarthropathy, and it varies widely in severity. Erosions and periarticular new bone proliferation occur in PsA. PsA tends to affect the small joints of the hands (Figure 12) and feet (Figure 13) more than the larger joints of the extremities [67]. In the hands, the DIP joints are most commonly involved, and acro-osteolysis may occur. PsA also often affects the spine and the sacroiliac joints. It may also involve the knees, elbows, ankles, and glenohumeral joint [22].
MRI is useful in detecting early inflammatory changes [23] in PsA, such as inflammatory enthesopathy with BMO and erosions, and periarticular inflammation, as well as tenosynovitis and synovitis of the affected joint [23,51,70,71] (Figures 12, 13). Unlike RA, BMO does not predict the eventual appearance of erosions in PsA [70,72,73]. On MRI, enthesitis is demonstrated by extracapsular BMO at ligamentous and tendinous insertions [70,71,74,75]. From the phalangeal entheseal sites BMO may extend into the diaphyseal region and possibly involve the entire bone [3,9,24,73,75] (Figures 11, 12A, 13A-B). Enthesitis in PsA may involve multiple peripheral and axial skeletal sites, and whole-body MRI may be useful in determining the extent of disease [74].
In the extremities, findings may be bilateral or unilateral and symmetric or asymmetric [22,76]. The hand is involved in approximately 40% of patients with PsA [73], and generally occurs in 1 of 2 patterns: the row pattern, commonly affecting the distal interphalangeal joints, and the ray pattern, which is mainly confined to the tendon sheath (Figure 12). Dactylitis, which reflects involvement of several joints with soft tissue swelling in a single digit, produces the classic “sausage digit” that occurs in more than 40% of patients with PsA, but it can also occur in patients with reactive arthritis [10,22,23,51,70,77,78]. Dactylitis may present as either an acutely painful swollen digit or as a chronically swollen, non-tender digit [77,78]. Dactylitis occurs predominantly secondary to flexor tenosynovitis, but it can also result from extratendinous soft tissue thickening, joint effusions, and extensor tendon inflammation [4,24,70,75,77-79]. MRI of dactylitis will show tenosynovitis of the flexor tendon, synovitis of the interphalangeal joints, and occasionally extensor tenosynovitis; enthesitis may also be present [10,23,51,74,77-79] (Figures 11, 12).
Nail thickening and involvement of the distal phalanx, with erosions and bone proliferation, are often present on MR in patients with PsA, and involvement of the DIP joint is more often present if there is clinical nail disease [70,80,81].
Early PsA can be difficult to differentiate from early RA both clinically and with imaging. Abrar et al. showed that with high-resolution MRI extracapsular inflammation was more common with PsA, while flexor tenosynovitis was associated with RA at the MCP joint [82]. Peritendinitis of the extensor tendon at the MCP joints where the tendon sheath is absent, thought to represent functional enthesitis between the metacarpal head and extensor digitorum tendon, is more common in PsA than RA [3]. RA tends to involve the carpal joints as well as the MCP and PIP joints of the hand, while PsA primarily affects the DIP joints of the hand.
PsA involves the axial skeleton in 20-40% of persons with peripheral articular disease [67,83]. Bilateral, either symmetric or asymmetric, sacroiliitis may occur. Sacroiliac disease is one of the early manifestations of PsA [83], and patients may have MRI findings of acute sacroiliitis before presenting with back pain [83]. Spine disease without sacroiliitis is uncommon and occurs in only 5% of patients with PsA [67]. Ankylosis is much less common than in ankylosing spondylitis [67]. Large, asymmetric, predominantly lateral comma-shaped paravertebral ossifications are typical in the thoracolumbar spine and may have skip levels [22,67]. Coronal MRI sequences are often useful in identifying these ossifications.
Reactive arthritis
Reactive arthritis is a sterile asymmetric inflammatory oligoarthropathy that often occurs after an enteric or urogenital infection and is associated with urethritis and conjunctivitis [10,22,67]. It is most common in men aged 25-35 years [22]. Recently, the authors have seen several patients who developed reactive arthritis in their hands post COVID19 infection [84].
Reactive arthritis involves the small joints of the upper and lower extremities, with strong predilection for the small joints of the foot, the calcaneus, and the ankle. Enthesitis of the distal Achilles tendon and plantar fascial attachment and retrocalcaneal bursitis are common [10,67]. In the axial skeleton, reactive arthritis may manifest as bilateral symmetric or asymmetric sacroiliitis. Large, comma-shaped, paravertebral ossification may be present in the spine.
Reactive arthritis may be unilateral or bilateral and symmetric or asymmetric [22]. Enthesitis, joint effusions, synovitis, bursitis, bone erosions, bone proliferation, acro-osteolysis, and tenosynovitis occur in reactive arthritis [10] (Figure 14).
Ankylosing spondylitis (AS)
AS is the most common seronegative spondyloarthropathy [4,85,86]. This is an inflammatory arthritis with up to 96% of patients HLA-B27 positive [22,87]. Age of onset of AS is between 20 and 40 years, and men are 3 times more likely to be affected than women [22,87]. Early clinical symptoms include back pain and stiffness as well as peripheral joint pain.
The hallmark of AS is inflammation at entheses, most commonly involving the sacroiliac joints and spine, with eventual ankylosis [87]. Involvement of the axial skeleton is more common than peripheral joint involvement, and it usually occurs earlier and more severely than peripheral joint involvement [87].
Sacroiliac joint disease in AS usually precedes spinal involvement [22]. In early AS radiographs of the sacroiliac joints are often normal and may remain normal for many years. Therefore, MRI is useful in detecting early changes of sacroiliitis before radiographic changes are apparent [88]. MRI demonstrates both active and chronic inflammatory changes in the sacroiliac joints [89] (Figures 15-17). In active sacroiliitis, there is periarticular BMO, often with joint effusion or synovitis, and erosions of the subchondral bone plate, with absence of periarticular muscle oedema (Figures 15, 16). With chronic sacroiliitis, the periarticular bone marrow signal may be diffusely low on both T1W and fluid-sensitive sequences, secondary to sclerotic changes, with eventual ankylosis (Figure 17). Although sacroiliitis in AS is typically bilateral, it is less often symmetric on MRI than on radiography; only 60% of cases on MRI demonstrate bilaterally symmetric involvement, while 86% of cases show bilaterally symmetric involvement on radiographs [4,90]. Wick et al. found that BMO and enhancement did not predict eventual formation of erosions of the sacroiliac joints. DWI and DCE MRI can be used to differentiate active from inactive sacroiliitis in patients with AS [91-95].
Spine involvement in AS includes osteitis, syndesmophyte formation, and facet joint inflammation, with eventual facet joint and vertebral body ankylosis, typically occurring at the thoracolumbar or lumbosacral junctions [22,87,96] (Figure 18). Characteristic radiographic features of AS in the spine include vertebral body squaring, osteopaenia, syndesmophytes, joint capsule and ligament ossification, vertebral osteitis, and spondylodiscitis. Spine radiographs may also be normal in early AS [87].
Early inflammation, enthesitis, and erosions occur at the anterior and, to a lesser extent, posterior margins of the vertebral body at the discovertebral junction, at the attachments of the annulus fibrosus and longitudinal ligaments, known as the Romanus lesion [22,87]. On MRI, Romanus lesions show decreased signal intensity on T1W images and increased signal intensity on fluid-sensitive sequences, often with homogeneous enhancement, due to active inflammation and hypervascularity [87]. Eventual healing and resulting sclerosis in these regions of vertebral body corner inflammation, known as the “shiny corner” sign on radiographs, will result in low MRI signal on all pulse sequences [22,76,87] (Figures 19, 20). Vertebral body corner inflammation as well as vertebral body corner fat deposition, presumably from prior inflammation, have been shown to be precursors of syndesmophyte formation [96].
Inflammatory spondylodiscitis, known as the Andersson lesion, occurs in AS (Figures 19, 21). On MRI, there is usually hyperintense signal intensity within the disc space and surrounding vertebral bodies on fluid-sensitive images, due to increased inflammation, BMO, and vascularization, which is surrounded by a hypointense rim due to sclerosis [76,87].
Ossification of the posterior longitudinal ligament occurs in AS and is seen as a linear band of low signal intensity on all pulse sequences, posterior to the vertebral bodies, which may narrow the spinal canal [87].
Bilateral hip involvement can be seen with AS, with uniform joint space narrowing, acetabular protrusion, subchondral cyst-like changes, and femoral neck rim osteophytes [22]. Involvement of the glenohumeral joint can also occur with AS.
Osteoarthritis (OA)
OA is the most common arthropathy, most often resulting from repetitive microtrauma to articular cartilage as a result of overuse and aging [10,66,97]. It is also thought that the subchondral trabecular bone can undergo changes prior to cartilage damage, with resulting BMO-like lesions that are associated with pain and eventual cartilage loss [98] (Figure 22). Synovitis is also often present in OA, due to low-grade inflammation caused by trauma and inflammatory factors [8]. OA can also occur secondary to inflammatory arthritis, acute trauma, and prior infection [97]. This disease commonly involves the acromioclavicular joint, the small joints of the hands and feet, the knee, the hip, the shoulder, and the spine.
Erosive OA is a subtype of OA that occurs most commonly in the hands of postmenopausal females [99]. Erosive OA typically involves the DIP joints, followed by the PIP joints, and has a characteristic pattern of central erosions, which produces a “gullwing” deformity at the joint (Figure 23).
MRI shows various degrees of cartilage loss in the affected joint, which may be focal or diffuse with cartilage denudation in end-stage disease (Figure 22). The modified Outerbridge grading system is often used to describe cartilage loss (Table 1) [100-105]. Osseous findings include marginal osteophyte formation, subchondral/subcortical bone sclerosis, and subchondral bone marrow oedema and cyst-like changes. Joint effusions and synovitis may also be present [10].
Table 1
Modified Outerbridge grading system of cartilage loss with findings at magnetic resonance imaging (MRI), arthroscopy, and pathology
Conclusions
MRI facilitates the early diagnosis of rheumatological diseases, thus allowing prompt initiation of the appropriate therapeutic regimen. This powerful imaging modality is also very useful in monitoring therapeutic response and disease progression of rheumatological diseases, allowing clinicians to tailor treatment to optimize clinical outcomes.