Introduction
Renal cell carcinoma (RCC) is a common oncological condition, ranking among the ten most prevalent malignancies in both sexes and occupying the sixth position in terms of incidence in men. The global incidence of RCC increases annually by 2%, and the disease develops in approximately 1 in 63 individuals over the course of their lifetime. Each year, approximately 271,000 new cases of RCC are diagnosed, with an associated mortality of around 116,000 [1,2].
It is well established that the biological behavior of RCC, the clinical course of the disease, the efficacy of surgical or pharmacological treatment, the propensity for metastasis, and patient survival are determined by a combination of factors, including anatomical, histological, clinical, and molecular characteristics [3]. Currently, the only method that enables preoperative diagnosis of RCC while simultaneously providing information on the histological subtype and tumor grade is percutaneous biopsy (PB), which is rarely employed in routine clinical practice. This method is invasive, carries a risk of complications, and requires considerable procedural time. Moreover, its clinical utility remains controversial, as the proportion of non-diagnostic biopsies reaches up to 40% [4]. Core biopsies of cystic renal masses demonstrate even lower diagnostic yield and accuracy compared to solid lesions and are not recommended unless solid components are present, as in Bosniak IV cysts [3]. Moreover, tumor grading on core biopsies is challenging, with overall accuracy of 62.5% [5]. All of this contributes to the infrequent use of this procedure in many medical centers, with the European Association of Urology Guidelines recommending PB mainly in selected patients being considered for active surveillance, or prior to ablative or systemic therapy [3].
Although advanced cross-sectional imaging techniques, such as magnetic resonance imaging (MRI), demonstrate a sensitivity and specificity of approximately 75-90% for the diagnosis of RCC, certain studies have reported that the diagnostic accuracy of preoperative computed tomography (CT) in differentiating benign from malignant renal masses may be as low as 17%, particularly in certain cohorts [6]. This may be primarily explained by the fact that reliable differentiation from certain benign renal tumors, such as fat-poor angiomyolipoma (AML) or oncocytoma (OC), remains challenging [3]. Currently, all solid enhancing renal masses lacking microscopic fat are considered malignant until proven otherwise, as there is substantial overlap in imaging characteristics between benign and malignant lesions, particularly between clear cell RCC (ccRCC) and OC [7]. In addition, the diagnostic accuracy of CT for complex renal cysts (Bosniak IIF-III) is limited, with sensitivity as low as 36% and poor interobserver agreement [8]. Emerging modalities such as PSMA PET-CT, 99Tc-sestamibi SPECT/CT, and 89Zr-DFO-girentuximab PET-CT show promise in differentiating RCC subtypes, benign from malignant tumors, and high- from low-grade lesions, with some also under evaluation for staging [9,10]. However, current evidence lacks sufficient external validation to support their routine clinical application [3]. Given these limitations, the high rate of false-positive RCC diagnoses is not unexpected; indeed, published data indicate that approximately 12% to 34% of nephrectomies performed for presumed malignant renal tumors ultimately reveal benign histopathology [11–14].
To date, several studies have demonstrated promising results in differentiating RCC from benign renal neoplasms using both standard CT imaging parameters, such as attenuation measurements, and CT-based radiomic features, including histogram parameters, texture parameters, form factor parameters, gray-level co-occurrence matrix features, and gray-level run-length matrix features. These have also been investigated in combination with machine learning, deep learning, and their hybrid approaches. However, despite substantial progress in this area, none of these models has yet been widely accepted or implemented in routine clinical practice due to insufficient evidence, lack of external validation, and absence of methodological standardization [15–18]. Moreover, fundamental imaging metrics, such as signal intensity (SI) across different phases of multiphase contrast-enhanced CT (MCECT) and their derived indices, remain insufficiently characterized, although emerging evidence indicates their potential diagnostic value in differentiating RCC from benign renal lesions and enhancing the performance of radiomic-based models [19,20].
In our previous study, we demonstrated that MCECT-derived parameters, particularly SI and tumor-to-cortex signal intensity ratio (TCSI), provide valuable non-invasive biomarkers for the characterization of small renal masses, achieving high diagnostic accuracy in differentiating RCC from benign lesions, identifying histological subtypes, and grading tumors [21]. In this context, we hypothesized that these parameters could also enable such differential diagnosis in renal masses larger than 4 cm.
Therefore, the aim of this study was to assess the role of MCECT in evaluating renal masses > 4 cm by measuring SI and the TCSI to differentiate benign from malignant lesions in both solid and cystic masses, as well as to predict RCC histologic subtypes and tumor grades.
Material and methods
Compliance with ethical standards
This retrospective study received approval from the local bioethical committee. All procedures were conducted in accordance with institutional and national ethical standards, consistent with the principles outlined in the 1964 Declaration of Helsinki and its subsequent amendments or equivalent guidelines. Written informed consent was obtained from all participants. The authors report no conflicts of interest. The study was carried out between 2015 and 2024.
Study population and design
To identify eligible cases, we analyzed medical records and postoperative pathology reports of patients with renal tumors and retrieved the corresponding CT datasets from institutional electronic archives. To assess the diagnostic performance of CT-based biomarkers in differentiating RCC > 4 cm, only cases with histologically confirmed diagnoses derived from postoperative pathology reports were included. Inclusion criteria were as follows: adult age; tumor size > 4 cm in the largest dimension based on imaging; absence of contraindications to CT such as allergy to contrast agents, severe renal or hepatic insufficiency, body weight > 150 kg, and pregnancy; and a clinical indication for or availability of CT data either stored on electronic media or accessible in an institutional electronic database. Patients were excluded if they had active urinary tract infections, bilateral or multifocal renal tumors, or advanced chronic kidney disease defined as chronic kidney disease stage 4 or higher (estimated glomerular filtration rate < 30 ml/min/1.73 m2), due to contraindications for contrast-enhanced CT. Prior to inclusion, no patient had undergone PB or any treatment of the renal mass.
The study included 190 patients with renal masses measuring over 4 cm in the dimension (120 cases of solid and 70 cases of cystic lesions). Among the 190 patients with renal tumors, 115 (60.61%) were male and 75 (39.39%) were female. The mean patient age was 58.11 ± 9.20 years, ranging from 37 to 73 years. The mean age of male patients was 58.67 ± 3.45 years, and that of female patients was 57.25 ± 3.53 years. Left kidney involvement was more frequent, observed in 103 (54.29%) patients, while right kidney tumors occurred in 87 (45.71%) patients. The mean maximum tumor diameter was 7.56 ± 2.54 cm, ranging from 4.05 to 12.95 cm.
Pathomorphological evaluation
Pathological classification was performed according to the World Health Organization (WHO) criteria. Given the sample size, the International Society of Urological Pathology (ISUP) grades I and II were categorized as well-differentiated tumors, whereas grades III and IV were classified as poorly differentiated. Tumor staging for RCC and upper tract urothelial carcinoma (UTUC) was conducted using the Tumor-Node-Metastasis (TNM) Classification of Malignant Tumors established by the American Joint Committee on Cancer (AJCC).
Solid renal masses
The study cohort comprised 120 patients diagnosed with solid renal neoplasms: 84 (70.0%) with RCC, 14 (11.67%) with UTUC of the renal pelvis, and 22 (18.33%) with benign renal tumors. The mean patient age was 58.86 ± 8.25 years (range: 40-73 years). The gender distribution was as follows: 75 (62.30%) males and 45 (37.70%) females.
According to the AJCC TNM classification and postoperative histopathological reports, all 120 cases of RCC were staged as follows: 79 patients (66.09%) had pT1bN0M0, 3 patients (2.50%) had pT1bN1M0, 15 patients (12.50%) had pT2aN0M0, 3 patients (2.50%) had pT2aN1M0, 10 patients (8.33%) had pT2bN0M0, 3 patients (2.50%) had pT2bN1M0, 2 patients (1.67%) had pT3aN0M0, and 1 patient (0.83%) had pT3aN1M0. All 14 cases of UTUC of the renal pelvis were also classified according to the TNM system: 2 patients (14.29%) had pT1N0M0, 9 patients (64.29%) had pT2N0M0, 2 patients (14.29%) had pT3N0M0, and 1 patient (7.14%) had pT3N1M0.
Based on the WHO classification, the histological subtypes of RCC were determined postoperatively in all cases: ccRCC was diagnosed in 53 patients (66.25%), papillary RCC (pRCC) in 16 patients (20.0%), and chromophobe RCC (chRCC) in 15 patients (18.75%). Among pRCC cases, 87.10% were type I and 12.90% were type II; due to the limited number of type II cases, statistical analysis by papillary subtype was not performed. In the ccRCC group, 28 tumors (52.83%) were classified as low ISUP grade and 25 (47.17%) as high ISUP grade. Among pRCC tumors, 8 cases (50.0%) were low ISUP grade and 8 (50.0%) were high ISUP grade. All UTUC cases were high grade.
The histopathological diagnoses of benign tumors were distributed as follows: OC in 8 patients (36.36%), AML in 7 patients (31.82%), and papillary adenoma (PA) in 7 patients (31.82%). Moreover, in 5 of 7 (78.57%) cases, AMLs were classified histologically as low-fat AML.
Cystic renal masses
The study included 70 cases of cystic renal lesions. The mean patient age was 57.16 ± 7.57 years (range: 37-68 years). The gender distribution among patients with renal cysts was as follows: 41 males (57.89%) and 29 females (42.11%). In patients with simple renal cysts (Bosniak categories I and II), MCECT of the abdomen was performed in cases with radiologically equivocal findings on prior ultrasound or MRI. All Bosniak IIF cysts included in the analysis had been followed for a minimum of one year (mean follow-up: 1.2 years) using contrast-enhanced cross-sectional imaging. During follow-up, these cysts demonstrated radiological features suggestive or indicative of malignancy, such as rapid growth, septal or wall thickening, and increased contrast enhancement, which prompted surgical resection and subsequent histopathological evaluation. All patients with Bosniak category III or IV cysts also underwent surgical treatment, and inclusion in the study was contingent upon histological confirmation.
Based on postoperative histopathological reports, the group of 18 Bosniak IIF cysts included 9 patients (50.0%) with benign cysts and 9 patients (50.0%) with cystic RCC. Among the 16 Bosniak III cysts, there were 11 cases (68.75%) of RCC, 1 case (6.25%) of a cystic variant of fat-poor AML, 2 cases (12.50%) of OC with a prominent cystic component, 1 case (6.25%) of cystic nephroma, and 1 case (6.25%) of renal leiomyoma with extensive cystic degeneration. Among the 15 Bosniak IV cysts, 12 patients (80.0%) had cystic RCC, 1 patient (6.67%) had a fat-poor cystic AML, 1 patient (6.67%) had a cystic form of OC, and 1 patient (6.67%) had a metanephric adenoma with a significant cystic component. In total, cystic RCC was confirmed in 32 of 49 (65.31%) patients with Bosniak IIF-IV lesions.
According to histopathological and imaging findings, all 32 patients with RCC were classified using the TNM system as follows: 23 patients (71.88%) had pT1bN0M0, 1 patient (3.13%) had pT1bN1M0, 4 patients (12.50%) had pT2aN0M0, 1 patient (3.13%) had pT2aN1M0, 1 patient (3.13%) had pT2bN0M0, 1 patient (3.13%) had pT2bN1M0, and 1 patient (3.13%) had pT3aN0M0. In all RCC cases, the histological subtype was ccRCC. According to the two-tier ISUP grading system, 18 tumors (56.25%) were classified as low grade and 14 tumors (43.75%) as high grade.
CT examination
In all cases, abdominal MCECT was performed using a 16-slice BrightSpeed scanner (General Electric, USA). Examinations were carried out with patients in the supine position using a spiral acquisition protocol in the craniocaudal direction. To minimize motion artifacts, patients were instructed to hold their breath during image acquisition. Scanning parameters followed the manufacturer’s protocol and included: slice thickness = 5.0 mm, pitch = 1.375 : 1, table speed = 27.5 mm/rotation, reconstruction interval = 5.0 mm, gantry tilt = 80.0°, field of view (FOV) = 46×46 cm, tube voltage = 130 kV, current = 350 mA, and an estimated total radiation dose of 20-30 mSv.
The MCECT protocol comprised four phases: the non-contrast phase (NCP), corticomedullary phase (CMP), nephrographic phase (NP), and excretory phase (EP). The CMP, characterized by intense cortical enhancement with minimal medullary uptake, was acquired at 35-40 s after contrast administration. The NP, defined by homogeneous enhancement of both cortex and medulla without contrast excretion into the collecting system, was performed after 70-75 s. The EP, marked by contrast excretion into the collecting system, was obtained at 8-10 min after injection.
Intravenous contrast agents – either iopromide or iohexol – were administered at a dose of 1-1.2 ml/kg body weight using an 18-gauge catheter placed in the antecubital vein. A semi-automated power injector (Dual Shot alpha 7, Nemoto, Japan) was used to deliver the contrast at a flow rate of 3 ml/s, followed by a 40 ml saline flush. No contrast-related adverse events were reported. All examinations were performed following a preparatory regimen that included fasting and ingestion of 1.5 liters of fluid. CT images were subsequently transferred to a picture archiving and communication system for interpretation at dedicated workstations.
CT image analysis
For all lesions, a comprehensive topographic assessment was performed, including evaluation of tumor size and maximal diameter (in cm), shape, anatomical position, margin characteristics (well-defined vs. irregular), location relative to the renal pole (upper/mid/lower), and spatial configuration (exophytic vs. endophytic). Additional features assessed included the presence of a central scar, necrotic regions, nodular contrast enhancement, ill-defined margins, cystic components, hypervascularity, calcifications, macroscopic fat, angular interface sign, multicentric growth, vascular invasion, and perirenal fat infiltration. The analysis also covered invasion of the collecting system or renal sinus, tumor extension into adjacent structures (including the adrenal gland), evaluation of tumor thrombus within the renal vein or inferior vena cava (size and extent), and assessment of regional lymph node involvement. All imaging characteristics were reviewed by a radiologist with substantial expertise in urogenital imaging.
SI values of renal tumors and normal renal cortex were analyzed across all MCECT phases and TCSI values were calculated. The TCSI ratio was computed by dividing the SI of the lesion by the SI of the normal renal cortex in the contralateral kidney. Measurements were performed on anatomically corresponding slices from each phase, with regions of interest (ROIs) precisely drawn over the tumor to conform to its margins, excluding areas of necrosis or cystic degeneration in solid tumors. Attenuation was recorded in Hounsfield units (HU). In heterogeneous lesions, the ROI was placed in the most hyperattenuating region.
Cystic renal lesions were classified according to the Bosniak system [22], which guided the categorization and ROI placement. For Bosniak I, II, and IIF cysts, the ROI encompassed the entire cystic area, conforming to its contours, while for Bosniak III and IV lesions, ROIs were positioned over enhancing solid components (e.g., thickened septa or walls), targeting the regions with the highest attenuation. For each lesion, three measurements were obtained, and the arithmetic mean was calculated. For cortical measurements, a circular ROI with an average diameter of 1.5 ± 0.5 cm was placed in a symmetrical region of uninvolved cortex, and attenuation values were obtained across all CT phases in a manner identical to tumor assessment. All CT image data were processed using the RadiAnt DICOM Viewer (https://www.radiantviewer.com).
Reference values
Reference values for imaging biomarkers were obtained from individuals without clinical or radiological evidence of renal pathology (control group), as confirmed by clinical assessments and imaging studies, including complete blood count, urinalysis, serum urea and creatinine levels, and renal ultrasound. These individuals (n = 30) underwent abdominal imaging for suspected extrarenal pathology, which was subsequently excluded based on radiologic findings. The CT protocol, including contrast agent type, dosage, and phase timing, was identical to that used for patients with renal tumors. The mean age of the reference group was 53.67 ± 8.64 years (range: 37-69 years).
During CT imaging, reference values for SI of normal renal parenchyma were established by placing ROIs, averaging 1.5 ± 0.4 cm in diameter, over the parenchyma of the healthy kidney. In the control group, the TCSI value was defined as 1.0.
Statistical analysis
Descriptive statistics were applied to summarize baseline demographic and tumor-related characteristics of the study population. Categorical variables were compared using either the Pearson c2 test or Fisher’s exact test, as appropriate. The Shapiro-Wilk test was employed to assess the normality of data distribution. Differences in imaging biomarker values across patient groups and subgroups were evaluated using one-way analysis of variance. Receiver operating characteristic (ROC) curve analysis was conducted to determine the diagnostic performance of the models in differentiating malignant from benign lesions, with the area under the curve (AUC) and corresponding 95% confidence intervals (CI) reported. A p-value of <0.05 was considered statistically significant. Hierarchical cluster analysis using Ward’s method was performed on averaged CT-derived markers across four phases to identify enhancement pattern-based grouping among histologic subtypes. Principal component analysis (PCA) was applied to standardized SI and TCSI values to reduce dimensionality and visualize intergroup variance in a two-dimensional feature space. All statistical analyses were conducted using SPSS software, v.22 and Python v. 3.11.
Results
Differentiation of solid renal masses > 4 cm in size
Differentiation of malignant and benign solid renal tumors
In patients with RCC, the mean maximum tumor diameter was 7.69 ± 2.74 cm (range: 4.05-12.95 cm); in UTUC of the renal pelvis, 5.64 ± 2.43 cm (range: 4.25-6.95 cm); and in benign renal tumors, 6.89 ± 2.41 cm (range: 4.15-8.86 cm).
Evaluation of tumor SI across the CT phases in patients with RCC, UTUC, and benign renal lesions demonstrated intergroup variability; however, a statistically significant difference in mean SI values among all groups was identified only in the EP. The highest mean SI on CT images of EP was observed in the control group (85.52 ± 11.34 HU), while the lowest was recorded in the UTUC group (37.33 ± 5.75 HU), with a statistically significant difference between them (p < 0.001). The mean attenuation value for RCC was 71.69 ± 10.26 HU, which also differed significantly from the other groups (p < 0.001). In the group with benign renal tumors, the mean SI was 60.0 ± 14.36 HU, and the difference compared to other groups was likewise statistically significant (p < 0.001). Although the CMP and NP also provided useful differentiation among the groups, no statistically significant difference in mean SI was observed between UTUC and benign tumors in the CMP (p = 0.109), nor between RCC and benign tumors in the NP (p = 0.993) (Figure 1, Table 1).
Figure 1
Boxplot of signal intensity values for malignant and benign renal lesions during the phases of computed tomography
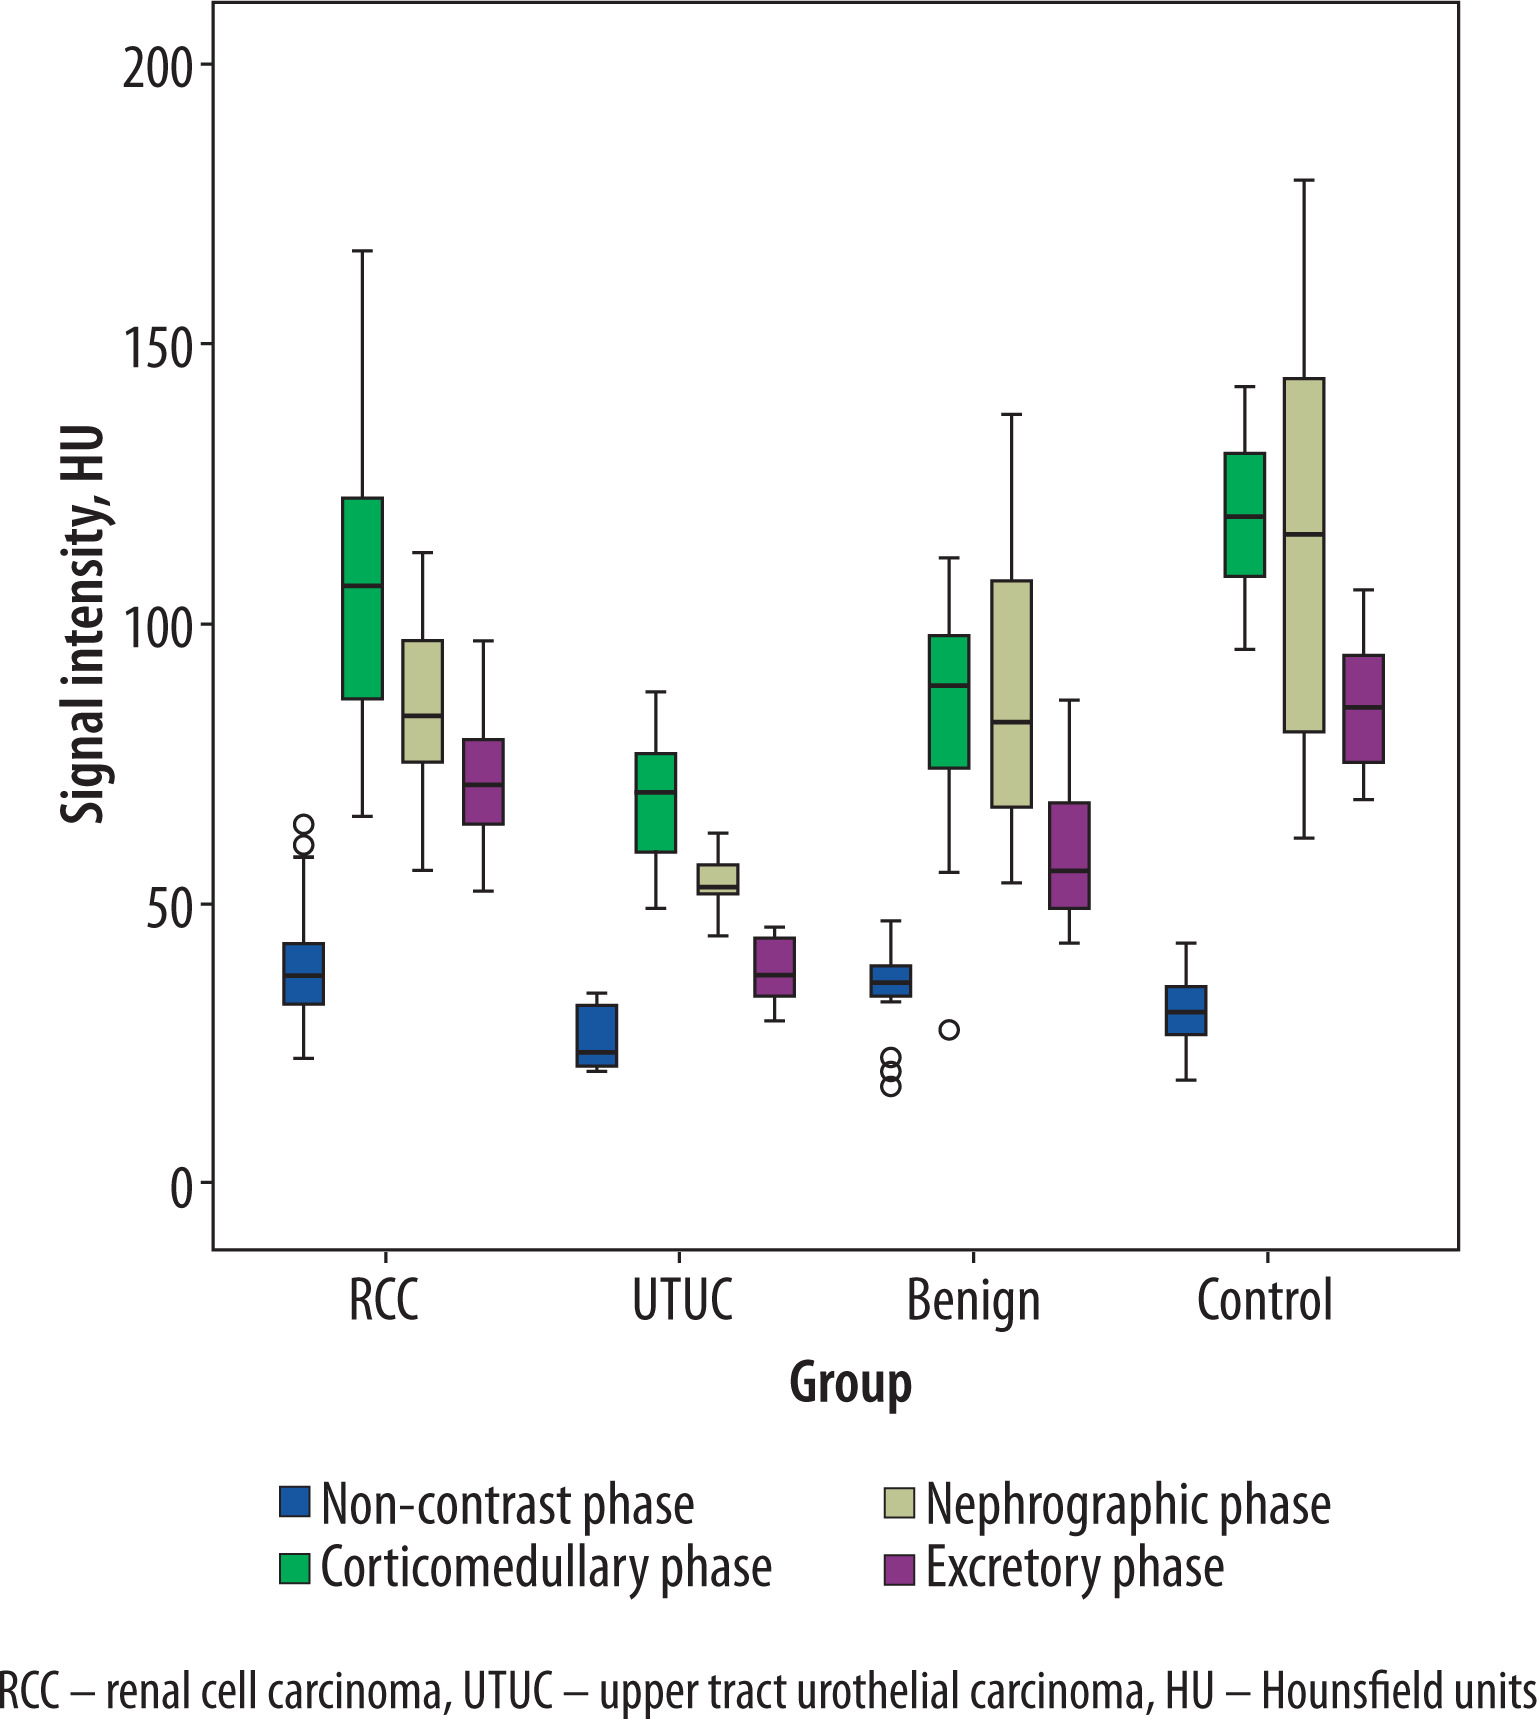
Table 1
Mean attenuation values of solid renal masses on computed tomography images across phases
Subsequently, the TCSI ratio was assessed across all phases of CT. Notable intergroup differences in mean TCSI values were observed; however, consistent with the findings for SI, statistically significant differences among all study groups were identified exclusively in the EP. In this phase, the highest mean TCSI was recorded in the RCC group (0.85 ± 0.19), followed by the benign tumor group (0.68 ± 0.15), and the lowest values were observed in the UTUC group (0.45 ± 0.11). The differences across all groups, including the control cohort, were statistically significant (p < 0.001). Although TCSI measurements derived from the CMP and NP also contributed to lesion characterization, these phases did not yield statistically significant differences between several subgroup comparisons. The mean TCSI values across CT phases for malignant and benign renal tumors are summarized in Table 2.
Table 2
Mean tumor-to-cortex signal intensity ratio of solid renal masses on computed tomography images across phases
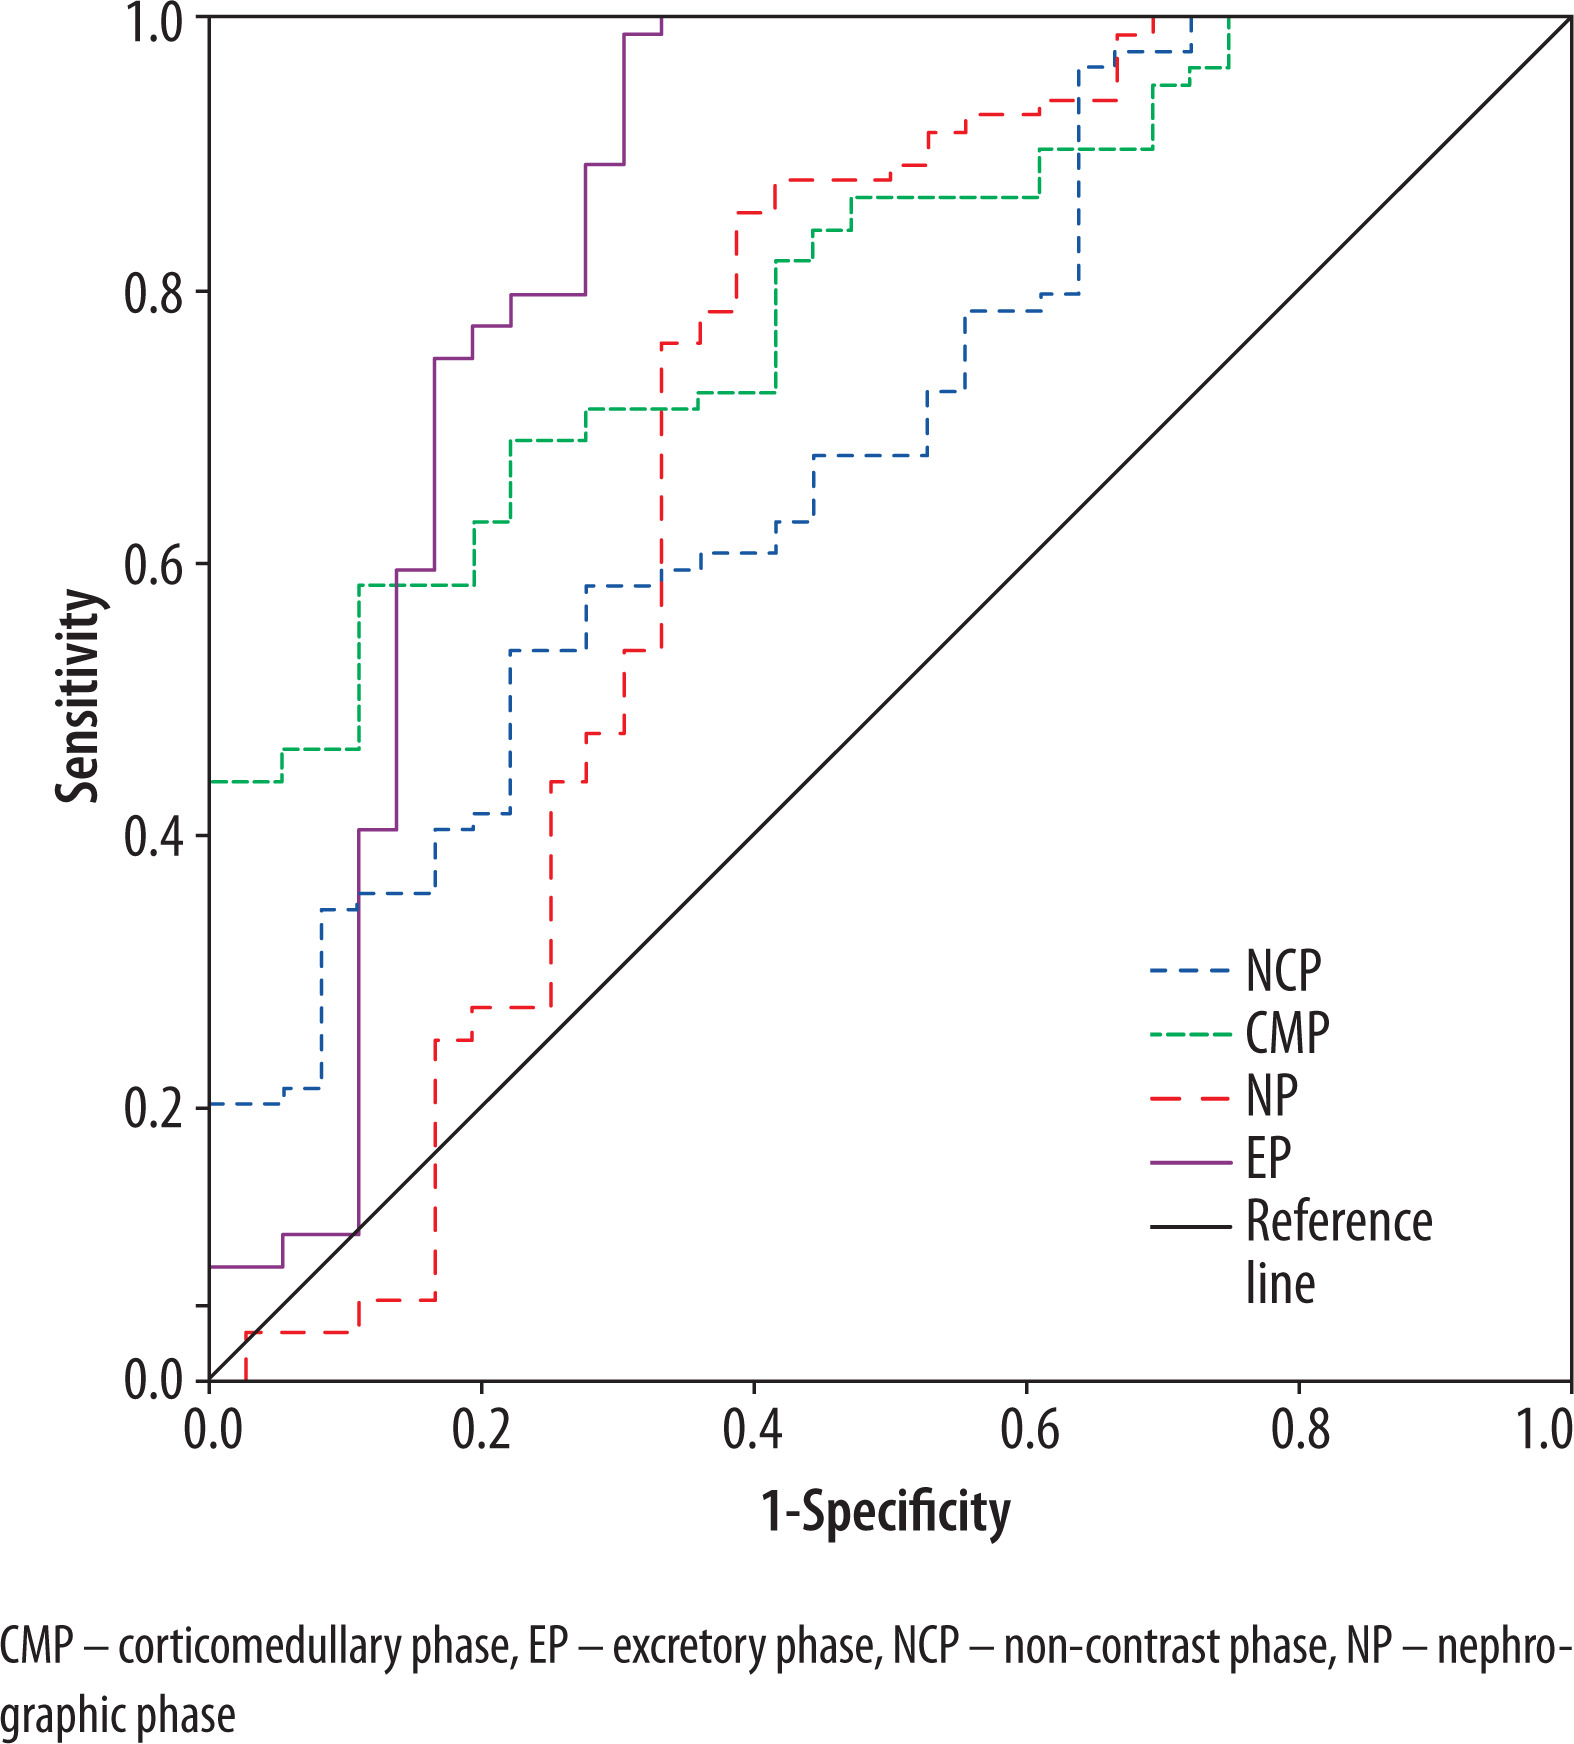
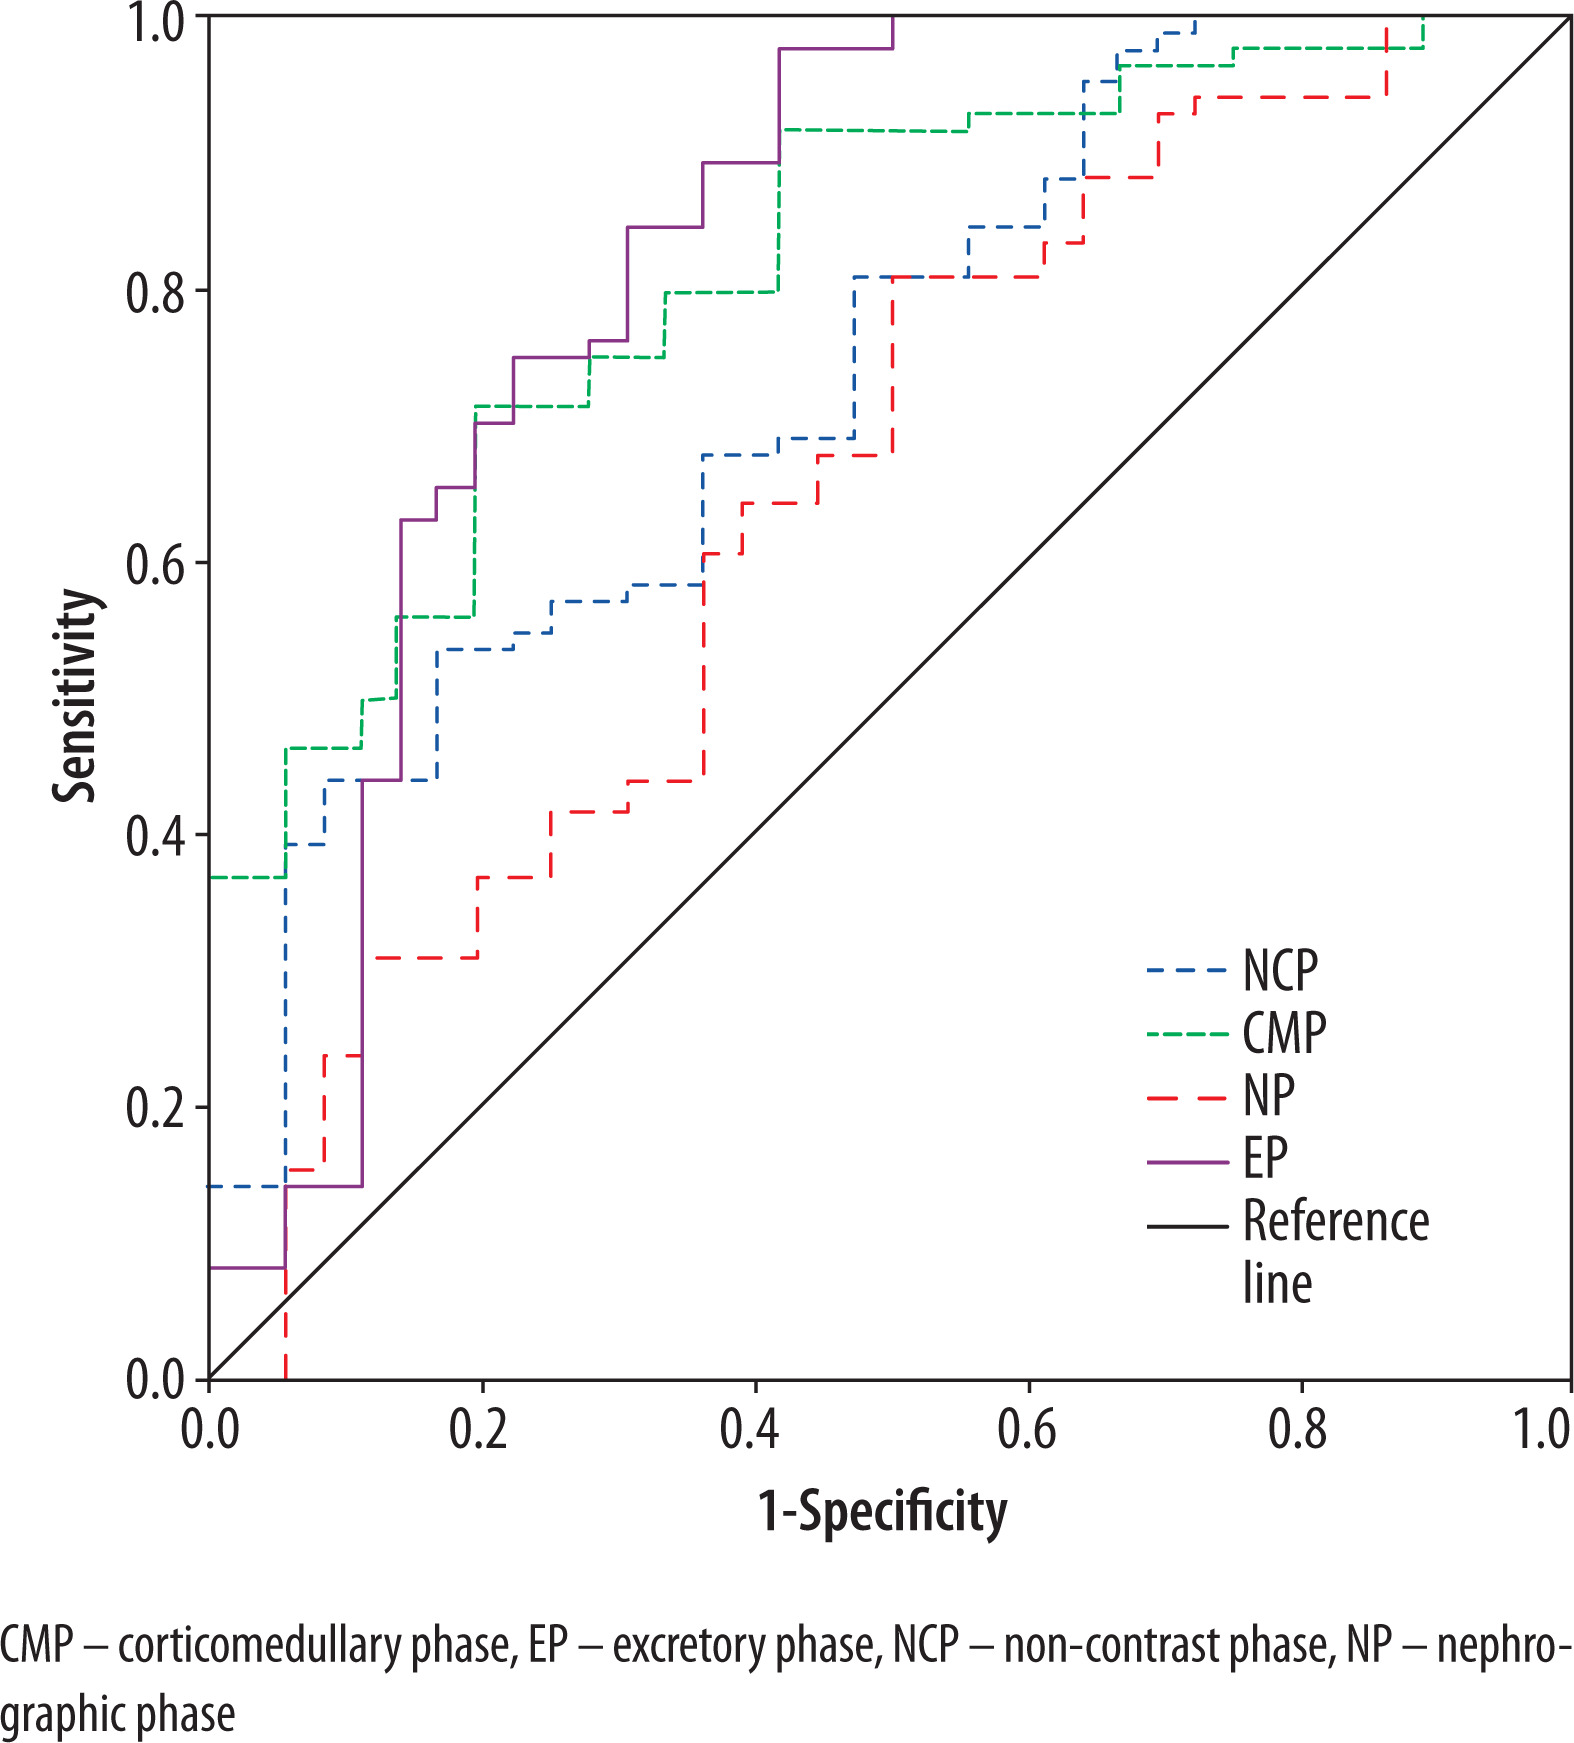
ROC analysis demonstrated that among the evaluated imaging biomarkers, tumor SI measured on CT images acquired in the EP provided the highest diagnostic performance for distinguishing RCC from other renal tumors. At an optimal threshold of 54.80 HU, the sensitivity and specificity reached 98.8% and 69.4%, respectively (AUC = 0.844; 95% CI: 0.746-0.942; p < 0.001). In comparison, the application of TCSI for the same diagnostic purpose yielded inferior sensitivity and specificity, indicating reduced discriminatory capability (Figures 2 and 3). Differentiation of RCC from benign renal neoplasms was also feasible, albeit with slightly reduced diagnostic accuracy. The most favorable results were obtained using tumor SI derived from EP images, where a threshold of 61.84 HU provided a sensitivity of 79.8% and a specificity of 63.6% (AUC = 0.745; 95% CI: 0.599-0.891; p < 0.001).
Differentiation of solid RCC histological subtypes
In analysis of SI values across different histological subtypes of RCC in various phases of contrast-enhanced CT, it was determined that the most pronounced differences among RCC subtypes were observed in the CMP. The highest mean attenuation was noted in pRCC (118.66 ± 9.17 HU), followed by conventional RCC (107.99 ± 26.68 HU), while the lowest values were recorded for chRCC (86.60 ± 13.08 HU). These differences are attributable to variations in contrast agent uptake and the underlying histoarchitectural features of the respective subtypes. As illustrated in Figure 4, ccRCC demonstrated the widest range of SI values and the highest peak values among all subtypes, which may reflect the considerable heterogeneity in microvascularization characteristic of this histological variant.
Figure 4
Boxplot of signal intensity values for renal cell carcinoma (RCC) histologic subtypes during the phases of computed tomography
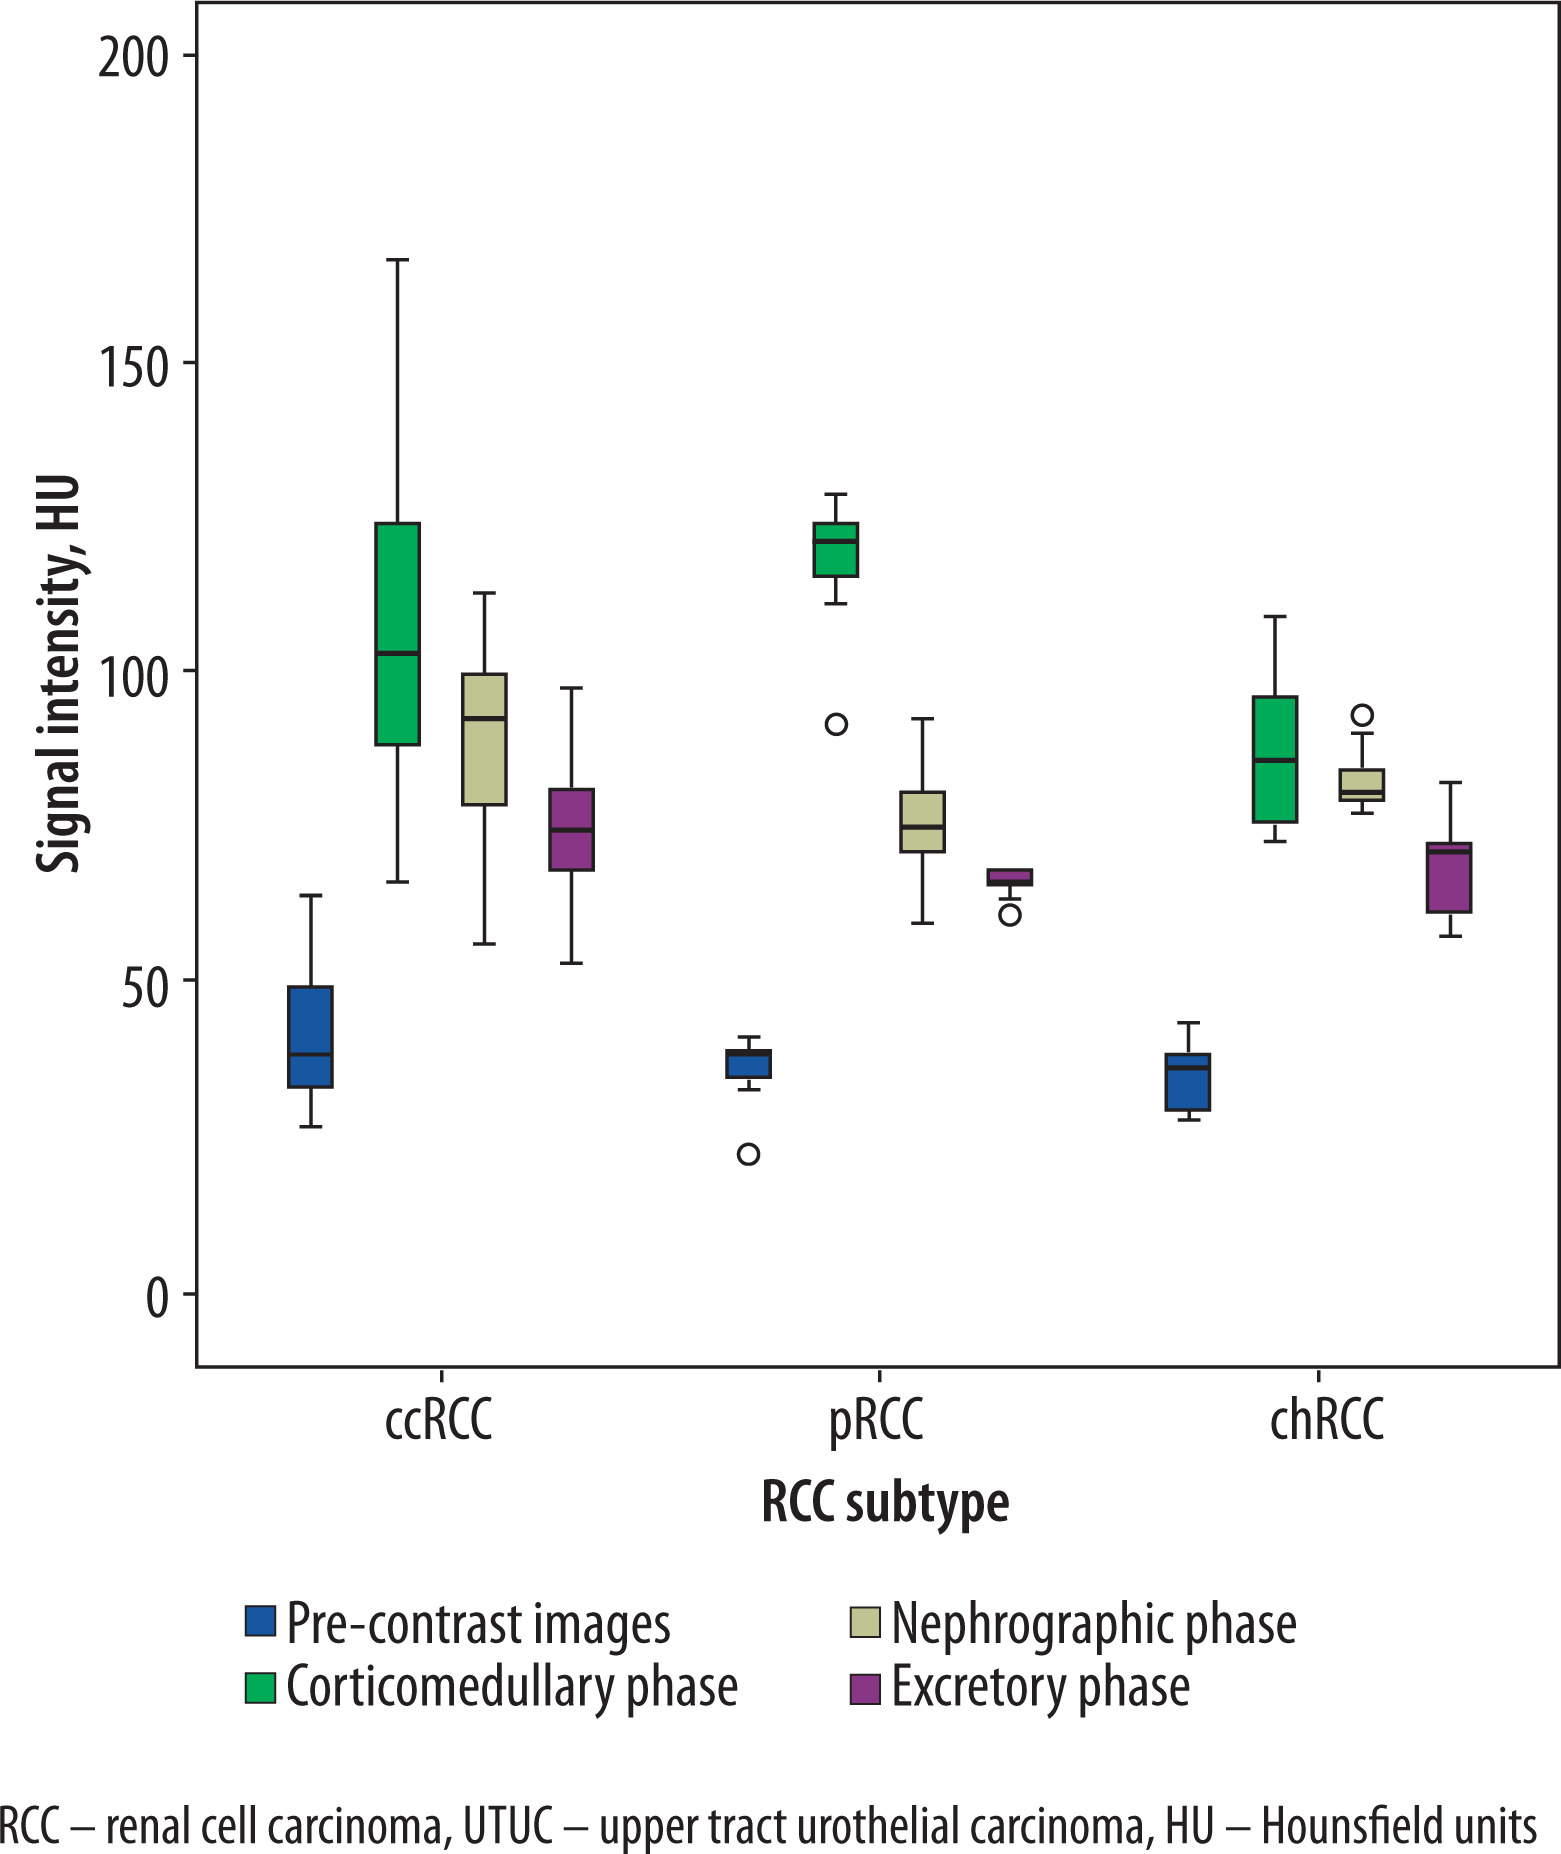
On CMP CT images, statistically significant differences in mean SI were identified between chRCC and both ccRCC (p = 0.005) and pRCC (p < 0.001). However, no significant difference was observed between clear cell and papillary RCC subtypes (p = 0.223). Analysis of the TCSI across histological RCC subtypes and CT phases revealed considerable overlap in value distributions, which limited the ability to distinguish between subtypes. A statistically significant difference in mean TCSI values was observed only between pRCC and chRCC in the CMP (Table 3).
Table 3
Mean tumor signal intensity (SI) and tumor-to-cortex signal intensity ratio (TCSI) on computed tomography (CT) images across different phases in clear cell, papillary, and chromophobe renal cell carcinoma (ccRCC, pRCC, chRCC)
In the context of distinguishing conventional RCC from non-conventional RCC subtypes, the overall diagnostic performance was modest. The highest values were recorded for tumor SI in the NP, with a cutoff of 79.39 HU achieving a sensitivity of 71.7% and a specificity of 54.8% (AUC = 0.718; 95% CI: 0.610-0.826; p = 0.001). In contrast, the differentiation between pRCC and chRCC subtypes demonstrated markedly superior test characteristics. The most accurate results were obtained in the CMP, where a threshold of 90.57 HU yielded a sensitivity of 100%, specificity of 73.3%, and excellent overall accuracy (AUC = 0.983; 95% CI: 0.946-1.000; p < 0.001).
Differentiation of solid RCC grade
Statistically significant differences in SI values between low- and high-grade ccRCC were observed on CT images across multiple contrast-enhanced phases. Low-grade tumors exhibited consistently higher SI values compared to high-grade lesions in all phases, with the exception of the EP. In the CMP, for instance, the mean SI for low-grade ccRCC was 123.97 ± 24.06 HU, which was significantly greater than that observed in the high-grade subgroup (90.10 ± 16.11 HU; p < 0.001). An analogous trend was noted for the TCSI between the two subgroups. Although the difference did not reach statistical significance in the EP (p = 0.155), it was significant in the NCP, CMP, and NP. In each of these phases, tumors of lower ISUP grades demonstrated higher TCSI values relative to high-grade tumors. Specifically, in the CMP, the mean TCSI for low-grade ccRCC was 1.10 ± 0.20, in contrast to 0.76 ± 0.14 for high-grade ccRCC (p < 0.001). Detailed results are presented in Table 4 and Figure 5.
Figure 5
Multiphase computed tomography (CT)-derived signal metrics differentiate low- and high-grade clear cell renal cell carcinoma
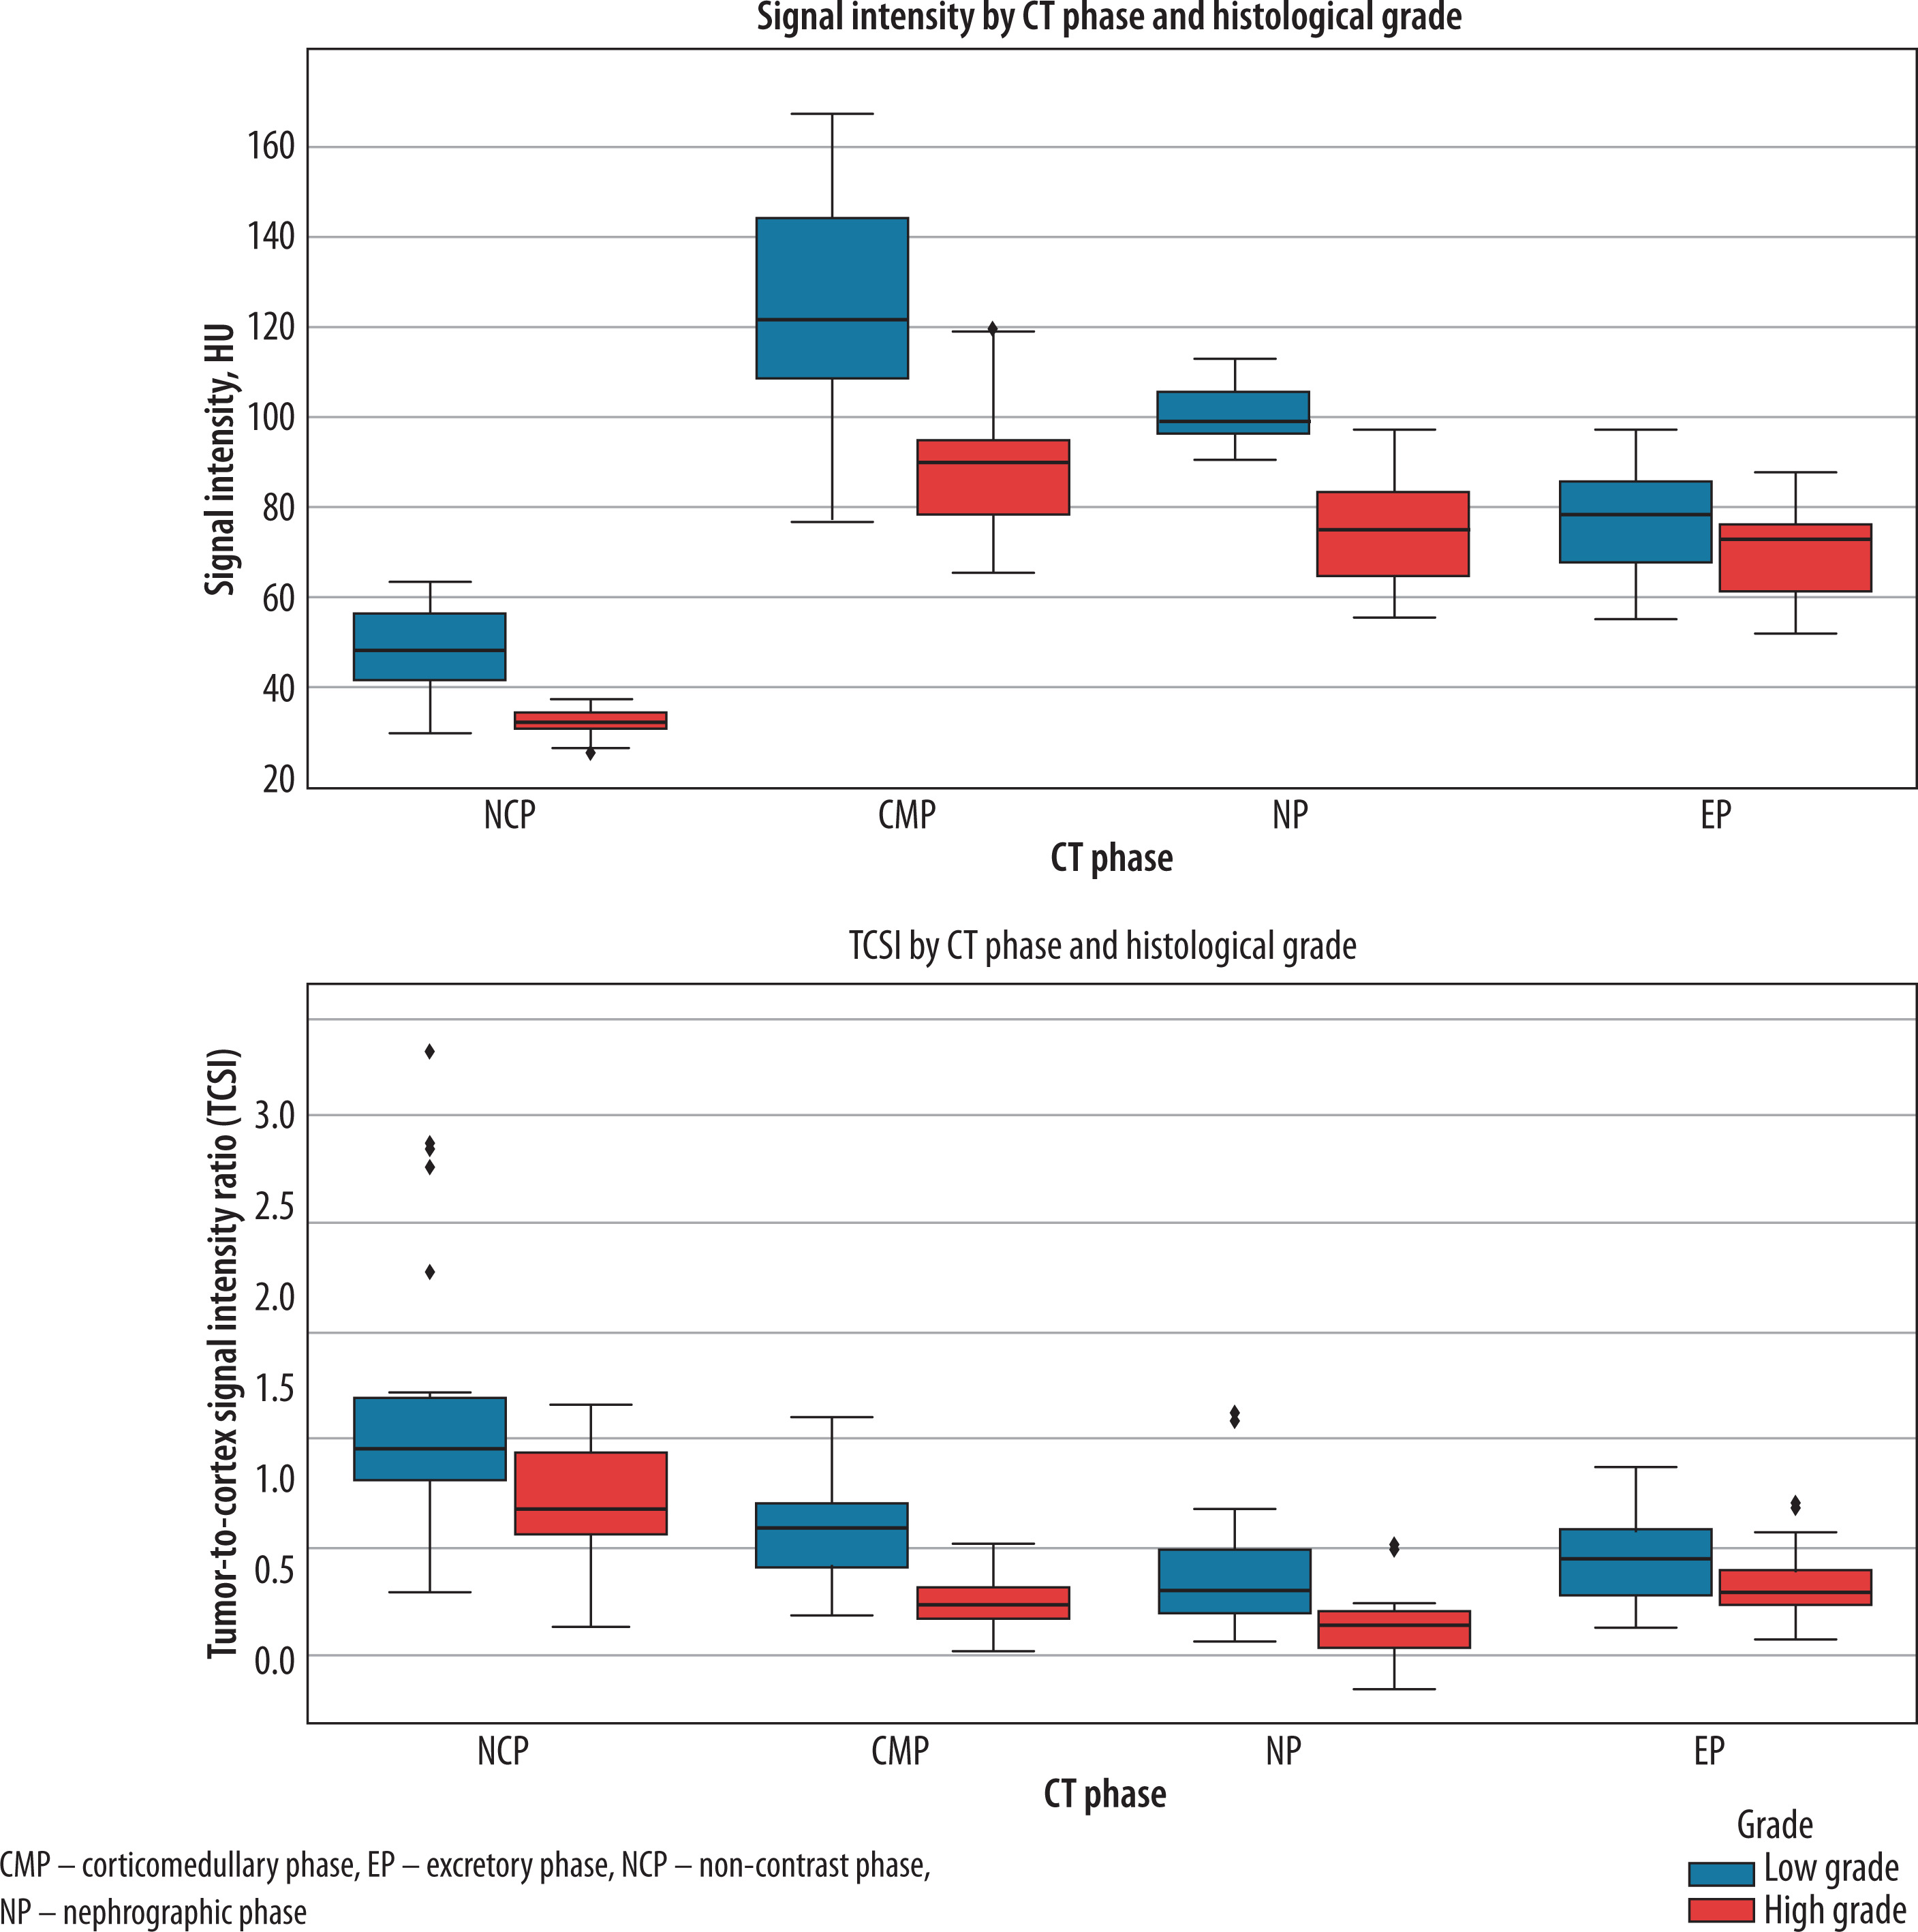
Table 4
Mean tumor signal intensity (SI) on computed tomography (CT) images across different phases in low-grade and high-grade conventional renal cell carcinoma (RCC)
In contrast, no statistically significant differences were observed in the mean SI or TCSI values between low-grade and high-grade of pRCC across any of the evaluated CT phases (p > 0.05).
For the stratification of low-versus high-grade ccRCC, the highest diagnostic performance was achieved using tumor SI measured in the NP. At a threshold of 87.78 HU, the resulting test demonstrated outstanding accuracy, with a sensitivity of 100%, specificity of 90.9%, and AUC = 0.969 (95% CI: 0.922-1.000; p < 0.001). However, neither tumor SI nor TCSI achieved satisfactory discriminatory performance for differentiating low- from high- grade pRCC.
Differentiation of benign solid renal masses
Attenuation properties were also assessed in subgroups of benign renal tumors. A statistically significant difference in mean SI was observed exclusively in the NP. Specifically, mean SI values were 107.29 ± 13.43 HU for OC, 81.79 ± 13.64 HU for AML, and 64.59 ± 6.48 HU for PA. Pairwise comparisons demonstrated significant differences between OC and AML (p = 0.001), OC and PA (p < 0.001), as well as AML and PA (p = 0.034). Additionally, TCSI analysis across contrast-enhanced phases revealed no significant differences among the three benign tumor subgroups, with statistical significance observed only intermittently between specific pairs. These findings indicate that TCSI does not offer incremental diagnostic value over absolute tumor SI for the characterization of benign renal neoplasms.
Multivariate visualization of tumor enhancement patterns
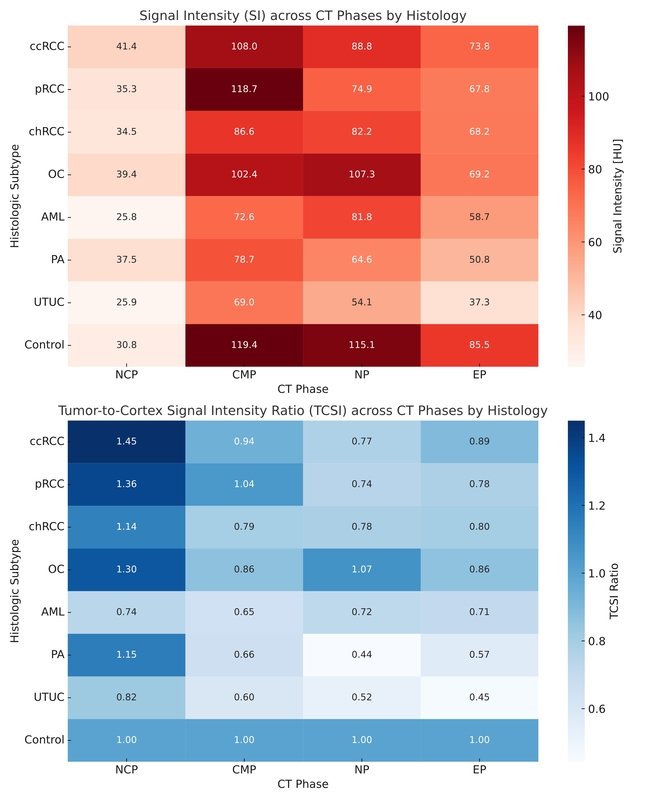
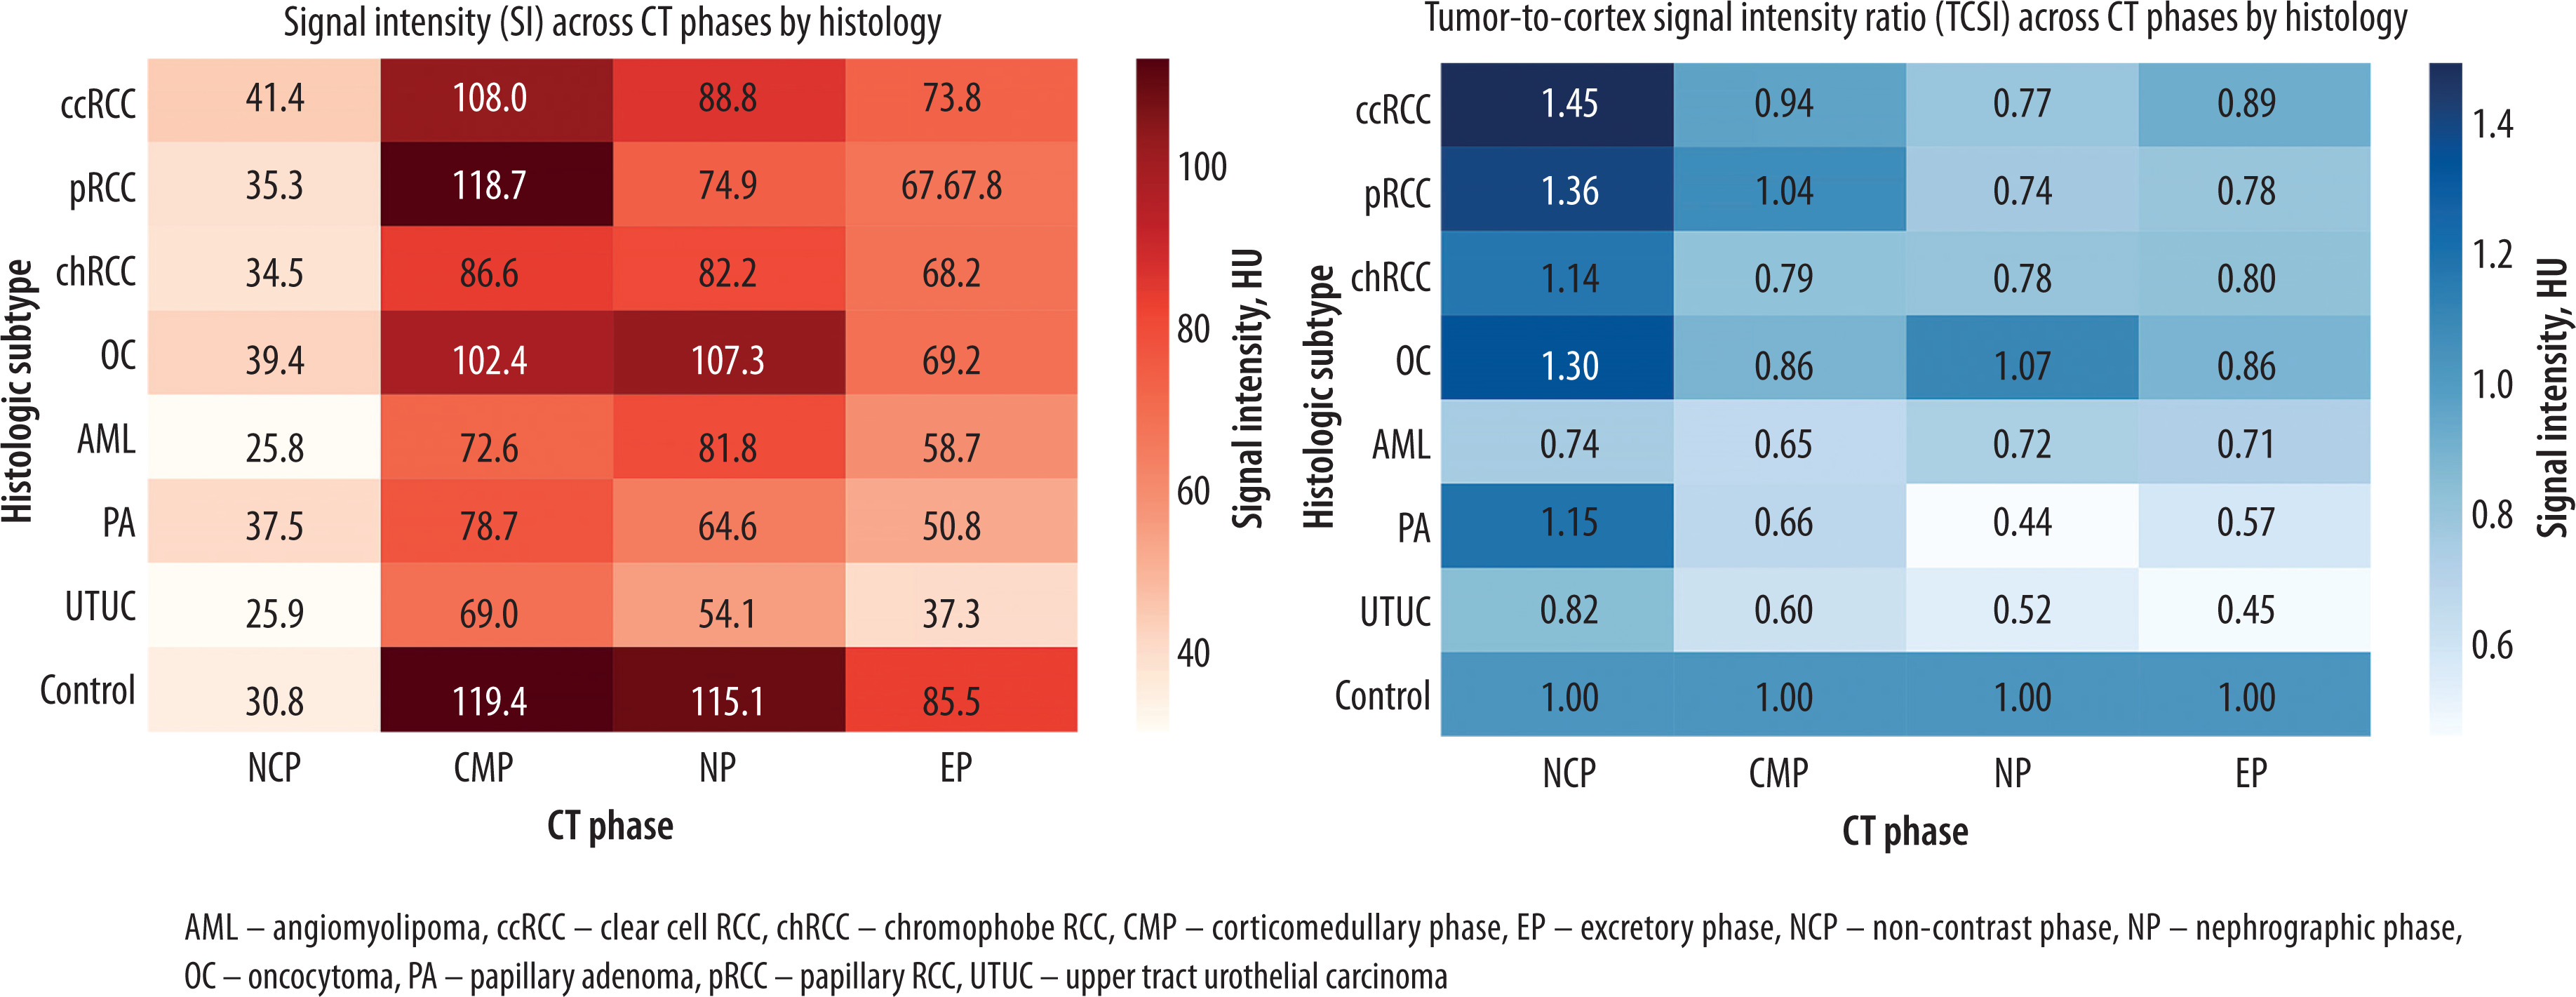
Hierarchical clustering based on the averaged SI and TCSI across all CT phases enabled stratification of histologic subtypes into biologically plausible groups. Cluster analysis revealed two dominant branches with clear phenotypic coherence. The first cluster comprised ccRCC and pRCC, both exhibiting peak enhancement in the CMP and maintaining relatively elevated TCSI values into the EP (e.g., TCSI of EP in ccRCC = 0.89 vs. in pRCC = 0.78), consistent with their pronounced vascularity. The second cluster grouped chRCC, OC, and AML, characterized by flatter enhancement curves (e.g., SI of CMP in chRCC = 86.6 HU vs. ccRCC = 108 HU) and lower TCSI ratios, reflecting reduced perfusion or stromal attenuation. A distinct outlier cluster was formed by PA and UTUC, both demonstrating consistently low SI and TCSI values across all phases (e.g., SI of EP in PA = 64.6 HU; TCSI of EP in UTUC = 0.45), aligning with their avascular or hypovascular growth patterns. Notably, the mean Euclidean distance between centroids of ccRCC and UTUC across the combined SI-TCSI matrix exceeded 1.84 (z-normalized units), indicating robust inter-cluster separability (Figure 6).
Figure 6
Heatmap visualization of signal intensity and tumor-to-cortex ratio across computed tomography (CT) phases in renal masses and their histologic subtypes
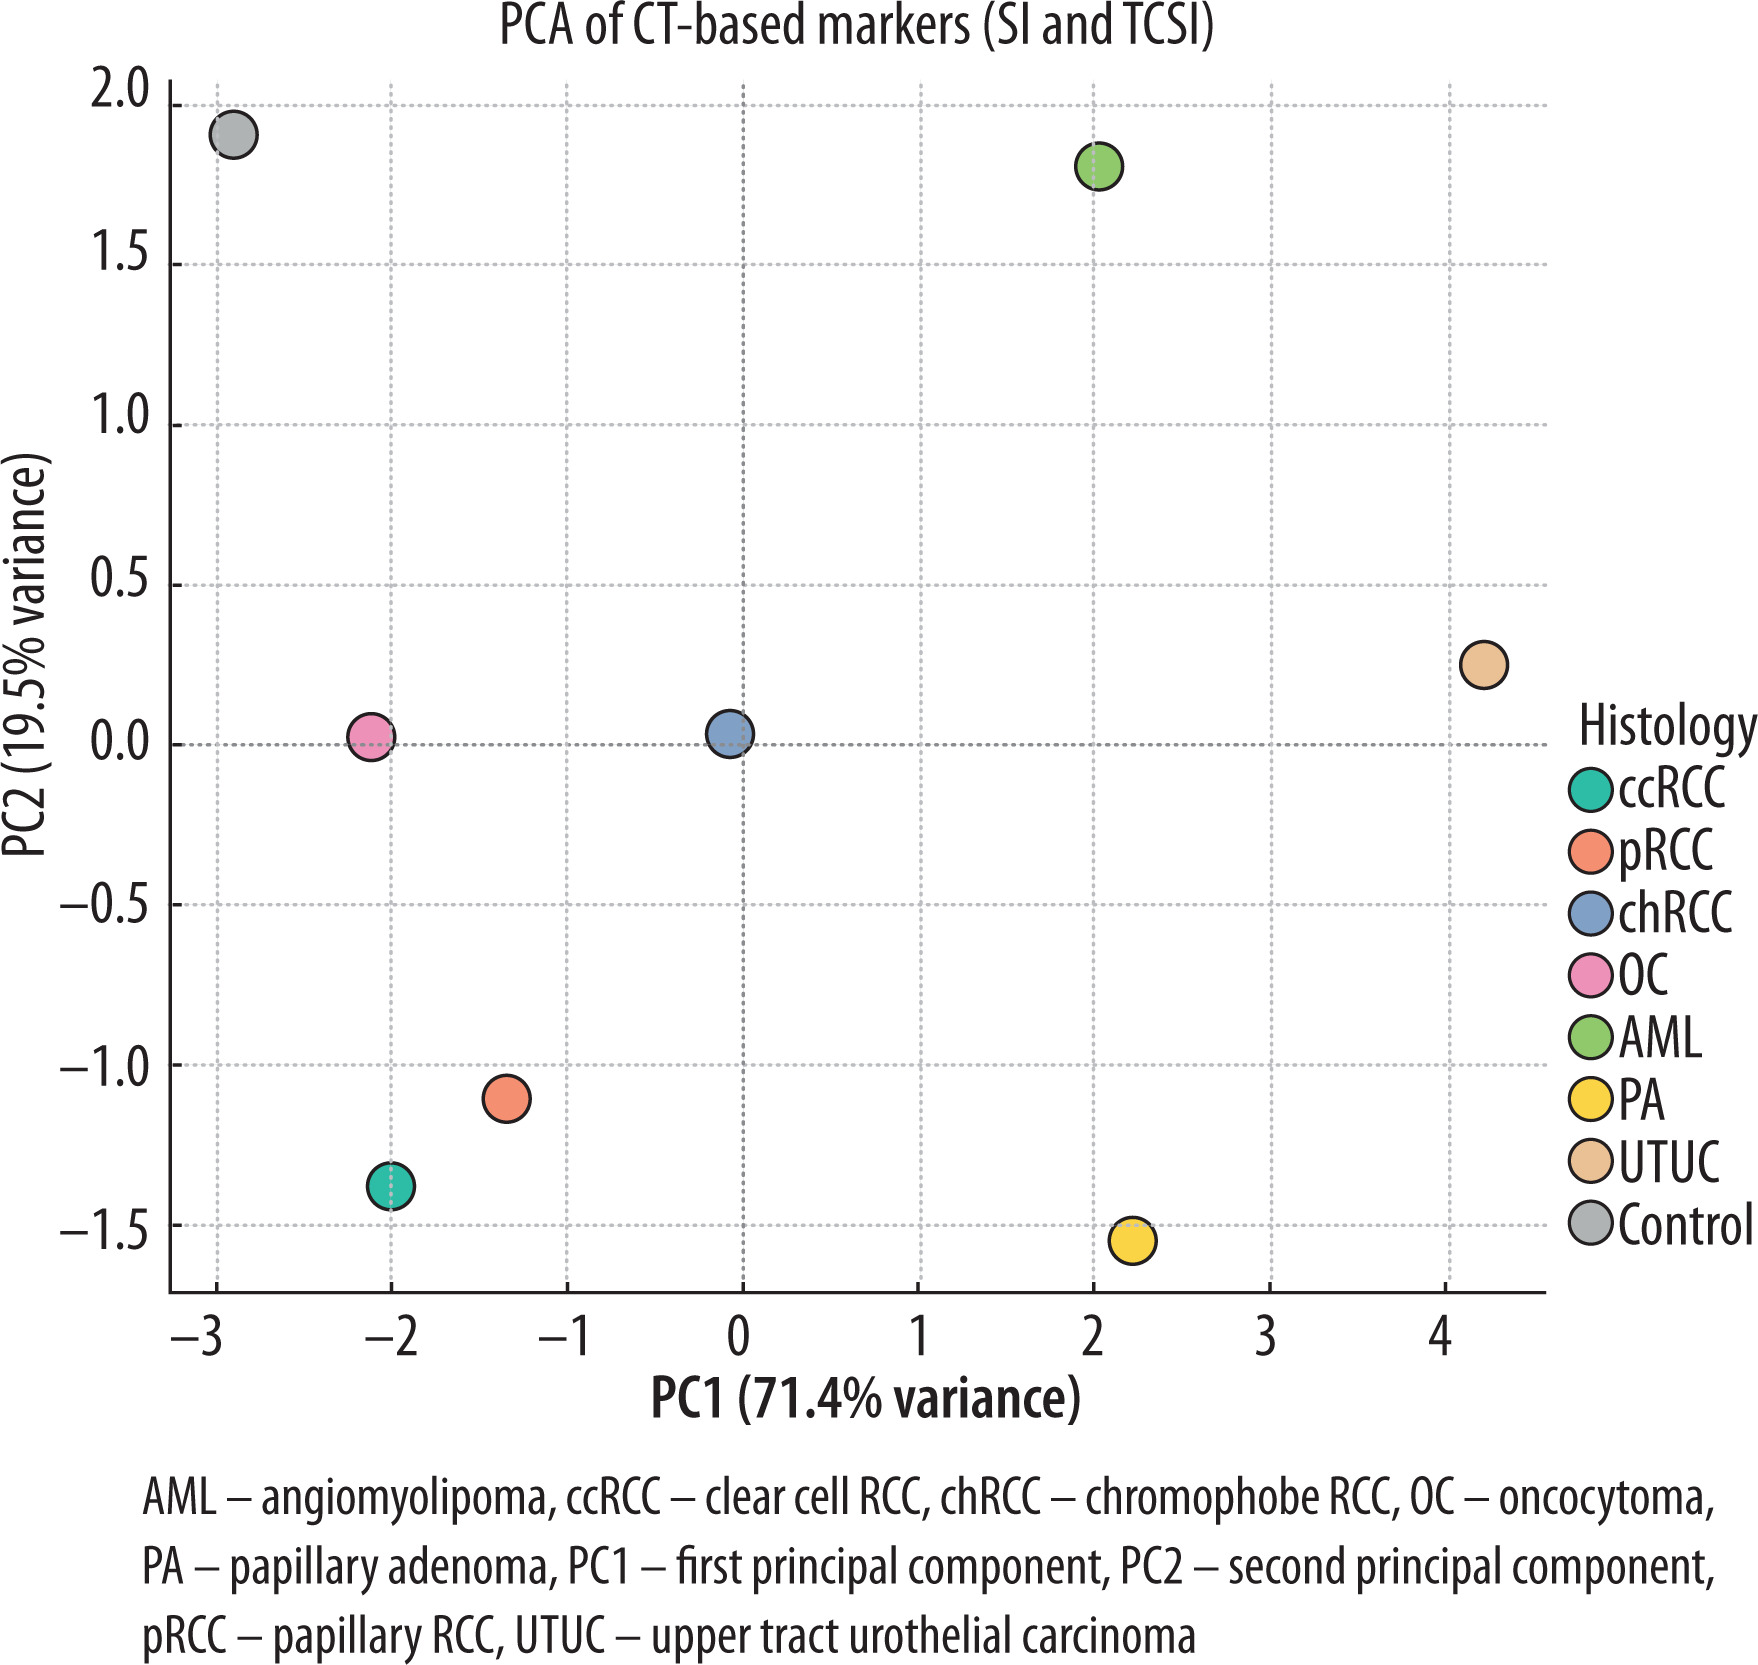
PCA was conducted on standardized multiphase CT-derived enhancement metrics, including SI and TCSI across all four contrast phases, resulting in dimensionality reduction from an 8-dimensional to a 2-dimensional space. The resulting biplot demonstrated clear spatial separation of major histologic subtypes. Conventional RCC and pRCC clustered along the positive PC1 axis, reflecting their relatively high vascular enhancement profiles. In contrast, chRCC, OC, and AML grouped along the negative PC2 axis, corresponding to lower and more homogeneous enhancement patterns. Importantly, UTUC and PA formed a distinct subgroup in the lower-left quadrant, consistent with their avascular or hypovascular nature. This multivariate visualization confirms the discriminative potential of phase-specific CT enhancement parameters and supports their application in the non-invasive classification of renal masses (Figure 7).
Figure 7
Principal component analysis (PCA) of computed tomography (CT)-based markers – signal intensity (SI) and tumor-to-cortex signal intensity ratio (TCSI)
The following figures illustrate the application of tumor SI and TCSI ratio in renal tumors larger than 4 cm (Figures 8–10).
Figure 8
Multiphase computed tomography data of 55-year-old patient, with an exophytic tumor of the posterior segment of the left kidney measuring 4.21 × 4.10 × 3.60 cm. The region of interest is located above the tumor. A) Axial projection, corticomedullary phase, signal intensity (SI) = 91.45 HU, tumor-to-cortex signal intensity ratio (TCSI) = 0.75; B) axial projection, nephrographic phase, SI = 76.15 HU, TCSI = 0.63; C) axial projection, excretory phase, SI = 73.12 HU, TCSI = 0.82; D) sagittal projection, corticomedullary phase, tumor indicated by arrow. The patient underwent partial nephrectomy. Pathologic diagnosis: clear cell renal cell carcinoma of the left kidney, pT1bN0M0, International Society of Urological Pathology (ISUP) grade III
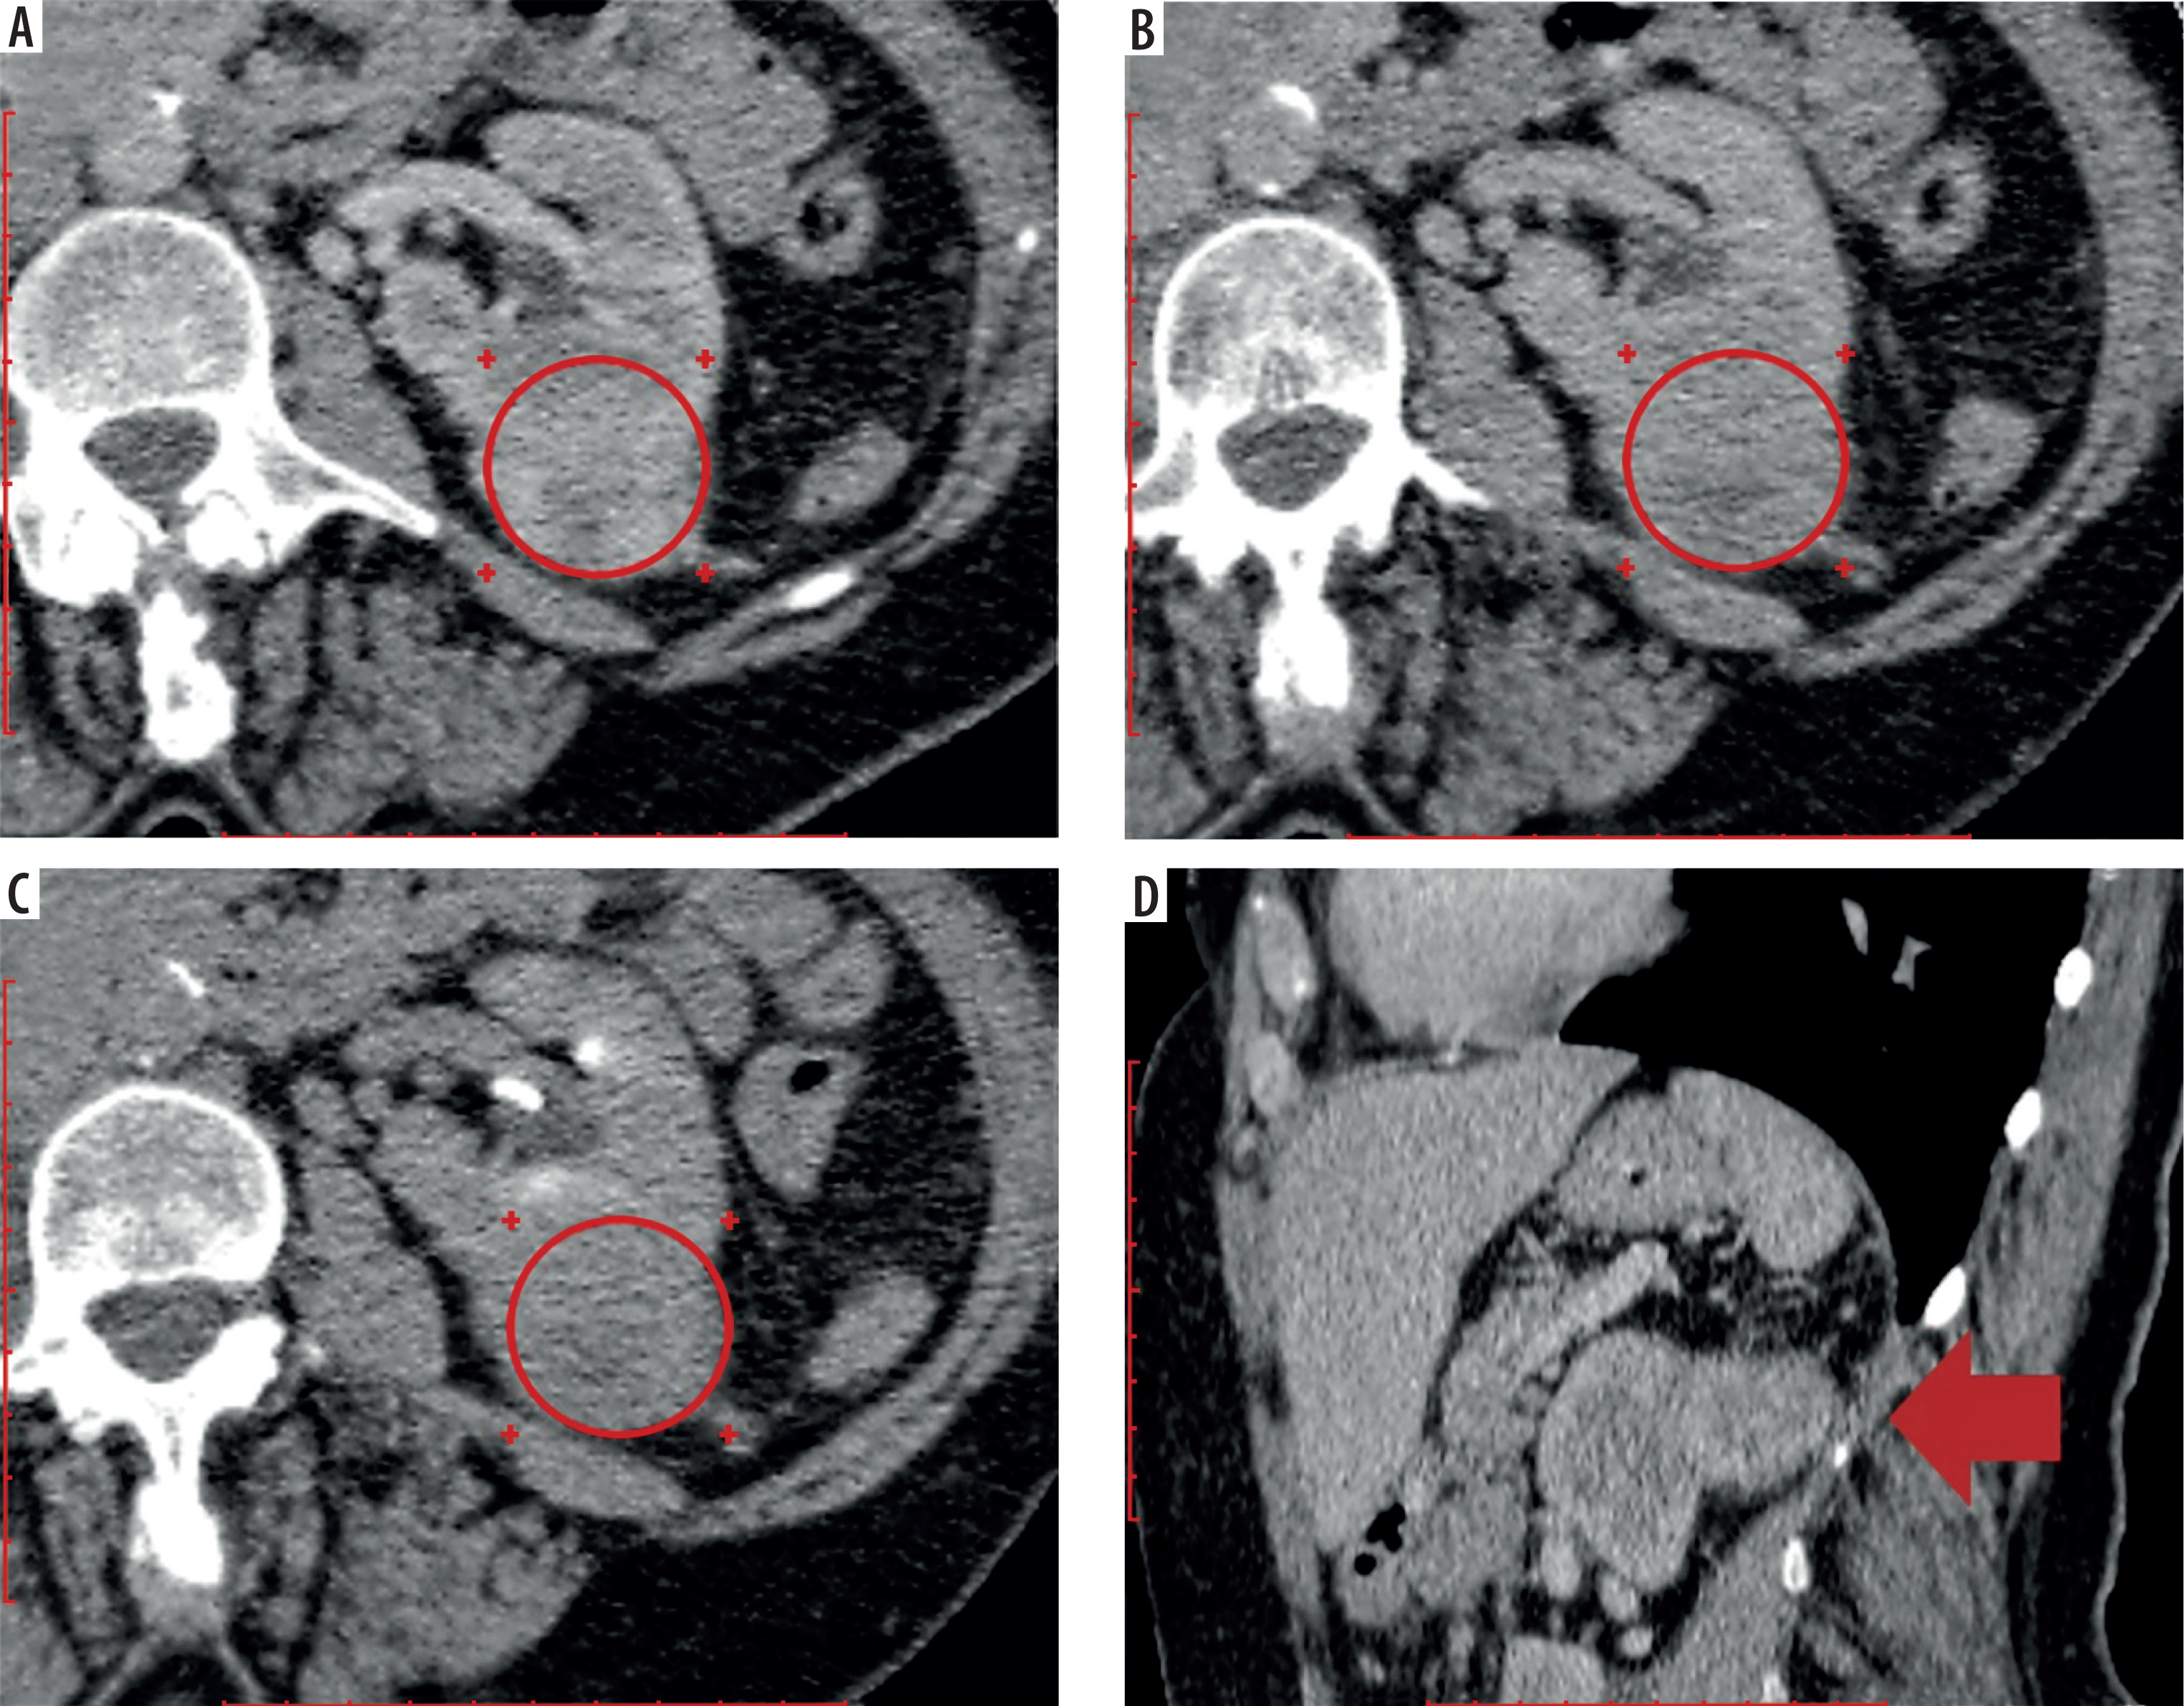
Figure 9
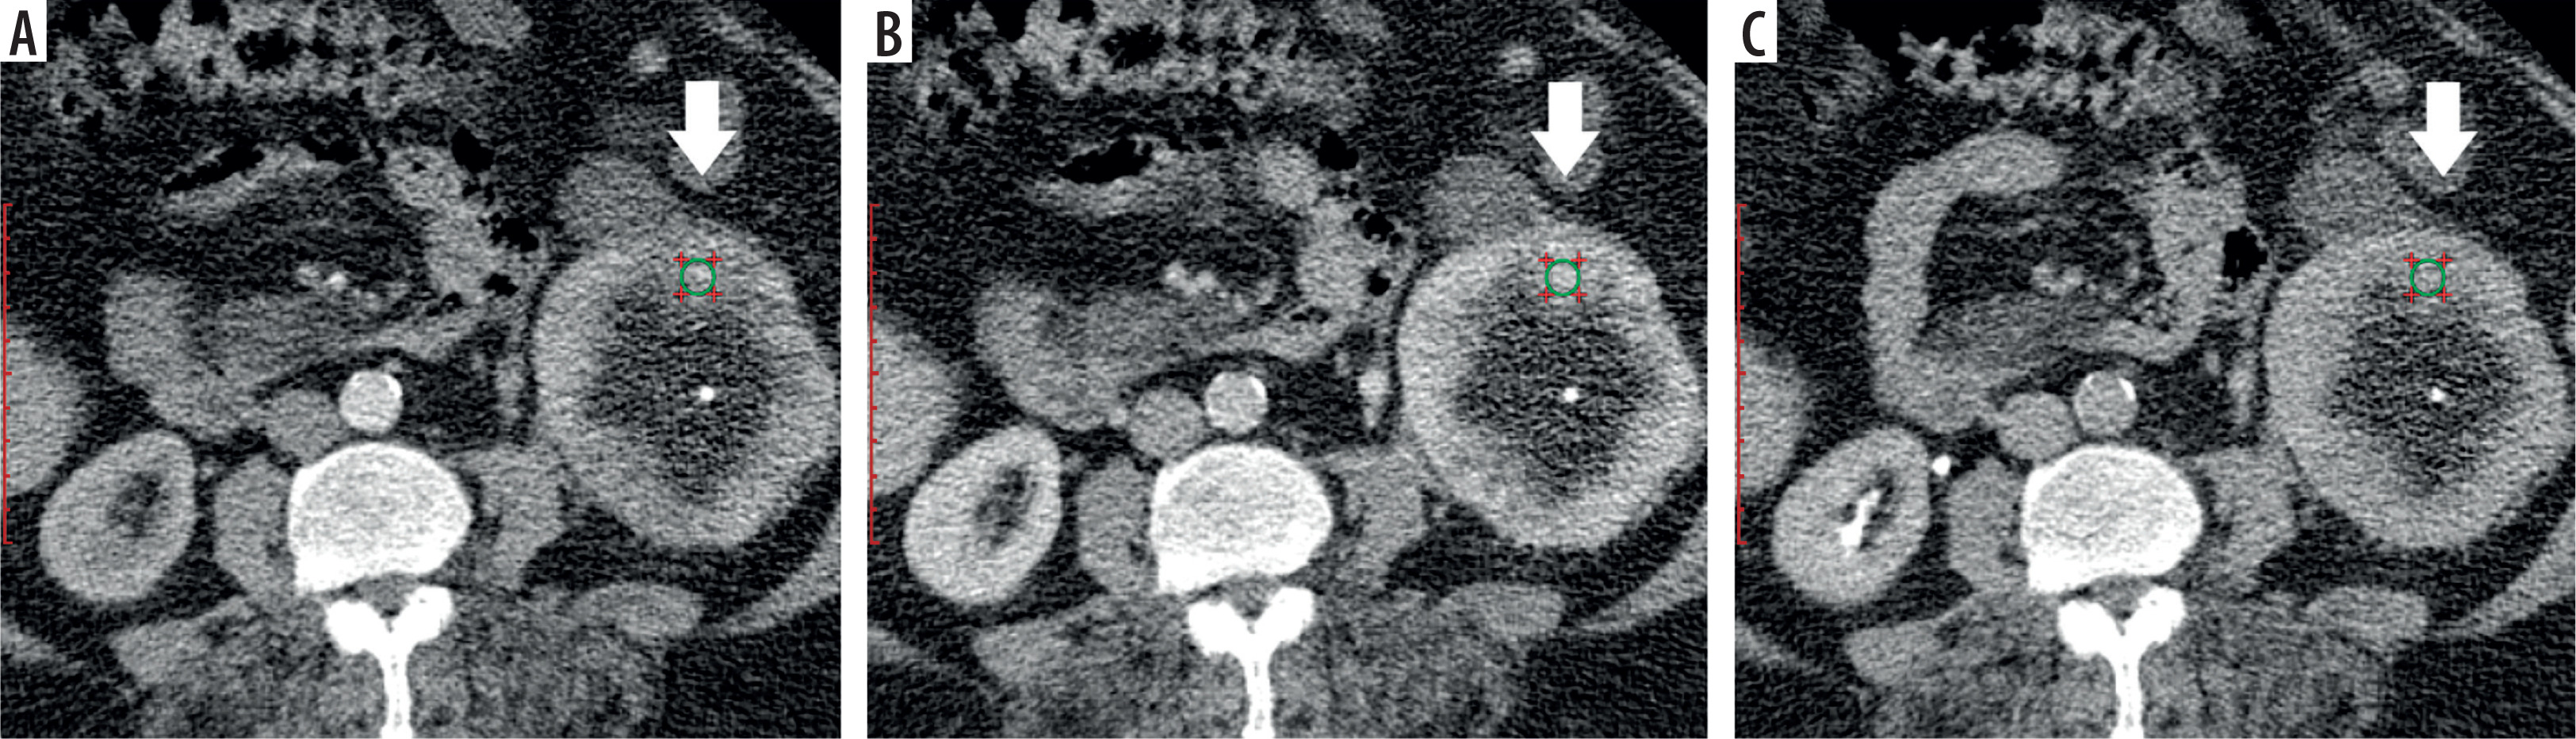
Multiphase computed tomography data of 68-year-old patient, axial projection, papillary renal cell carcinoma of the upper anterior segment of the right kidney measuring 5.6 × 4.7 × 4.3 cm, International Society of Urological Pathology (ISUP) grade II; the region of interest is located above the tumor. A) Corticomedullary phase, signal intensity (SI) = 117.23 HU, tumor-to-cortex signal intensity ratio (TCSI) = 1.05; B) nephrographic phase, SI = 73.45 HU, TCSI = 0.73; C) excretory phase, SI = 65.84 HU, TCSI = 0.75
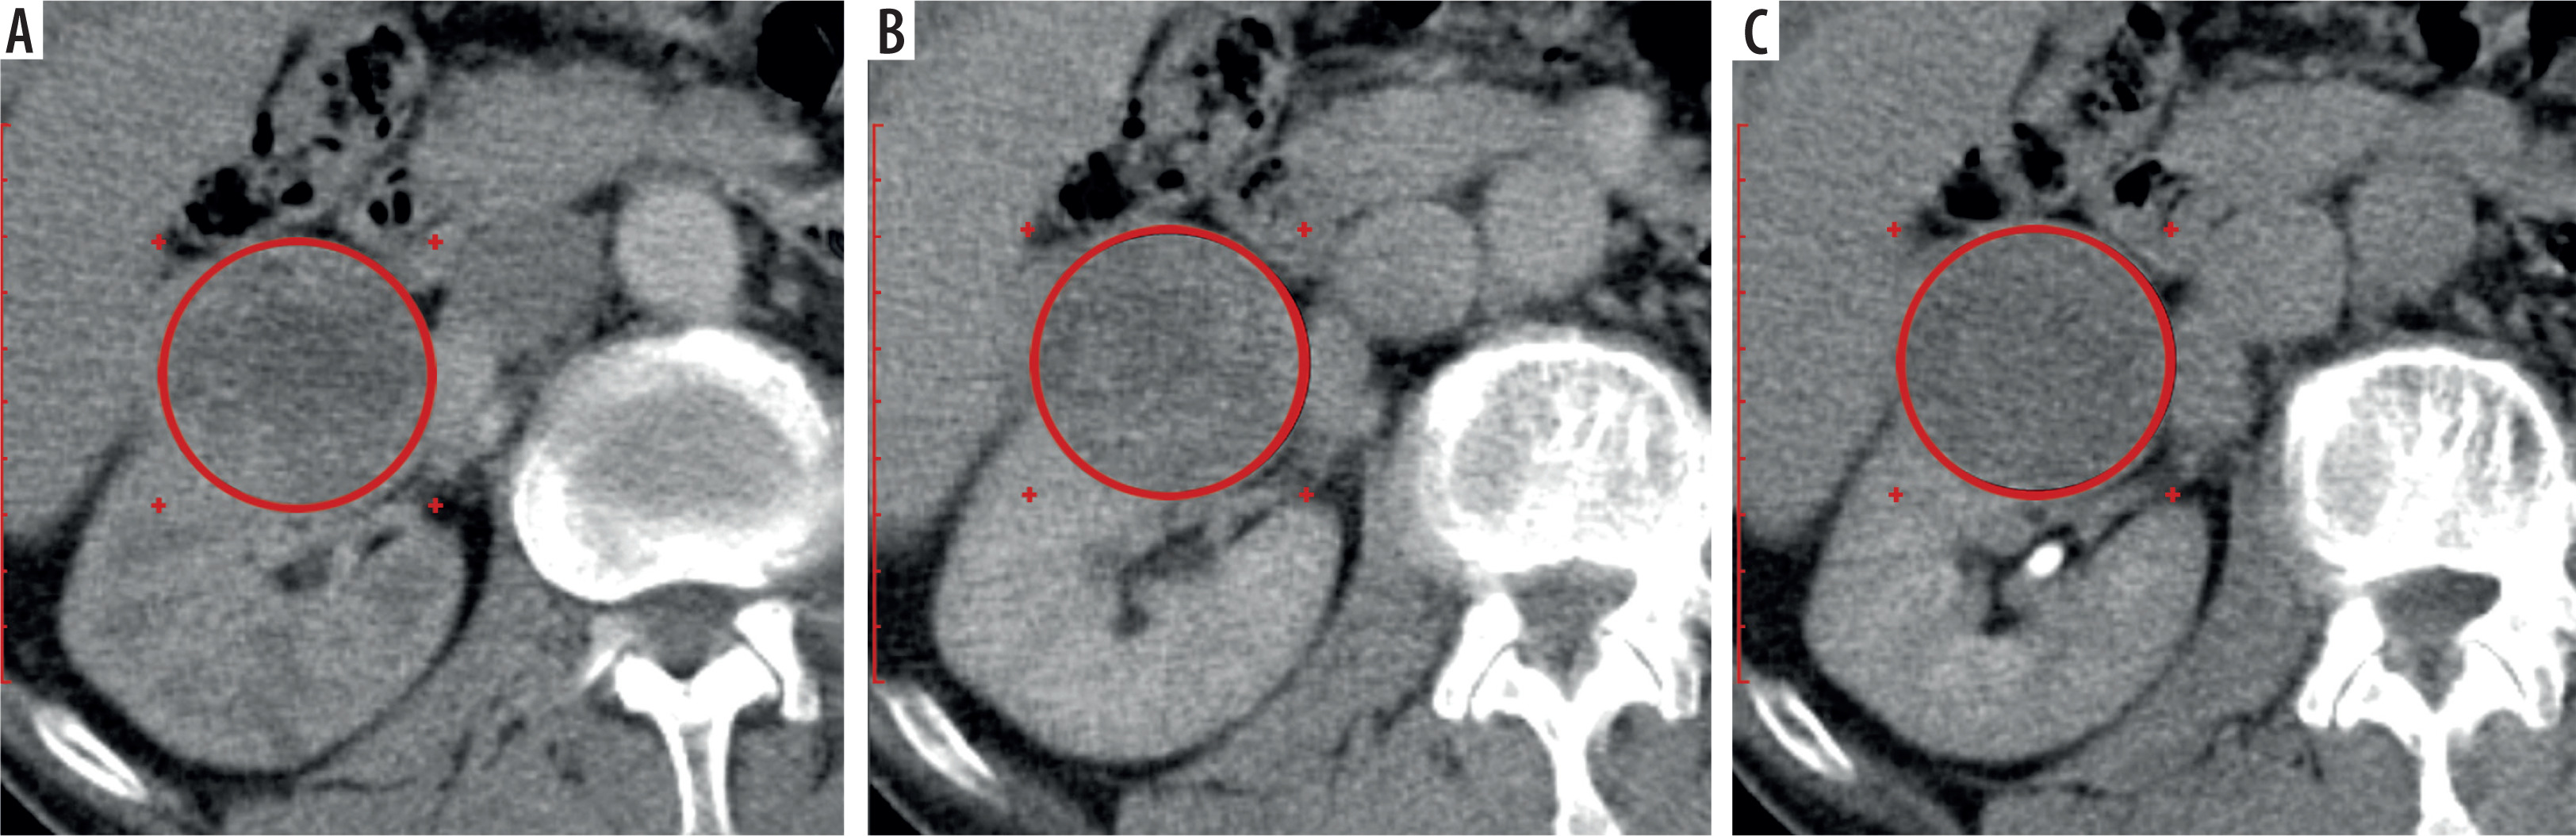
Figure 10
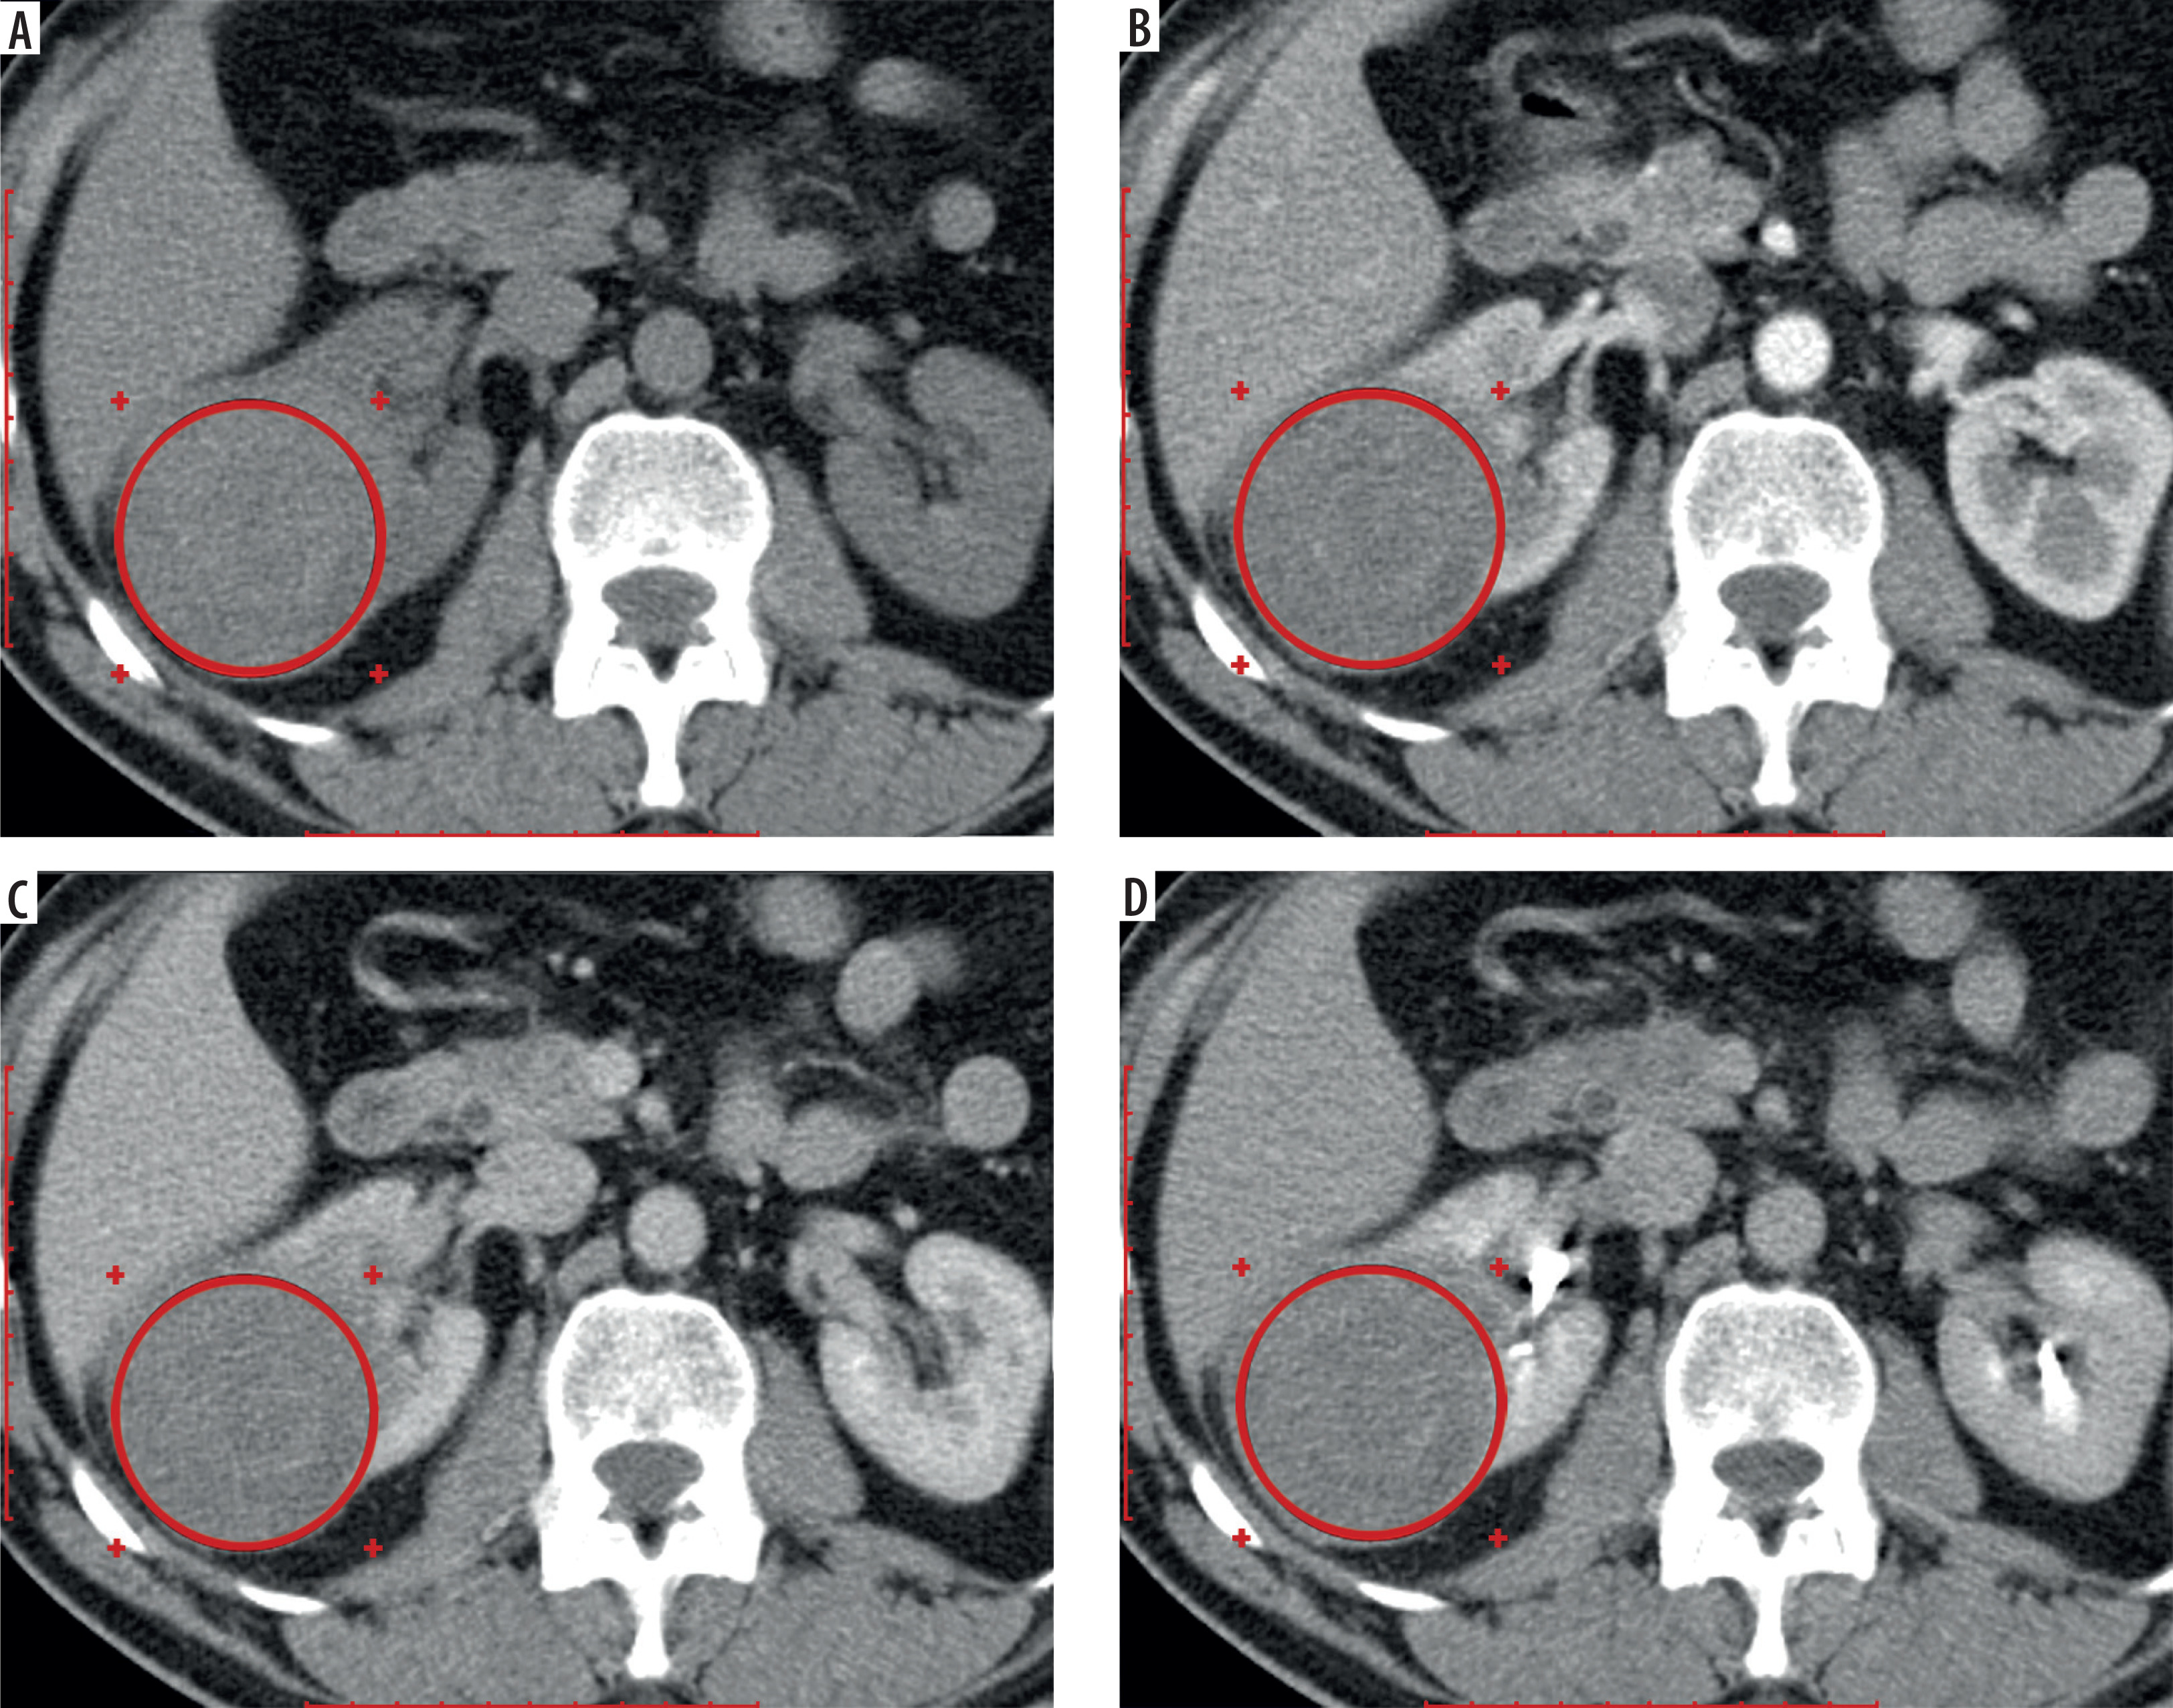
Multiphase computed tomography data of 56-year-old patient, axial projection, oncocytoma of the posterior segment of the right kidney measuring 6.69 × 6.34 × 5.56 cm; the region of interest is located above the tumor. A) Pre-contrast image, signal intensity (SI) = 39.34 HU, tumor-to-cortex signal intensity ratio (TCSI) = 1.29; B) corticomedullary phase, SI = 102.23 HU, TCSI = 0.86; C) nephrographic phase, SI = 97.45 HU, TCSI = 1.05; D) excretory phase, SI = 69.46 HU, TCSI = 0.83
Differentiation of solid cystic masses > 4 cm in size
The mean cystic renal lesion size was 5.34 ± 3.43 cm, ranging from 4.02 to 11.62 cm. In the evaluation of SI in renal cystic lesions measuring > 4 cm, as expected, the lowest attenuation values across all contrast-enhanced CT phases were recorded in Bosniak category I lesions, whereas the highest values were observed in category IV cysts. Among the evaluated phases, the CMP demonstrated the highest discriminatory performance, yielding statistically significant differences in mean SI across all Bosniak categories, with the exception of comparisons between category I and II cysts (p = 0.970), and between category IV cysts and the reference values (p = 0.719). The latter difference was considered clinically irrelevant, as renal masses > 4 cm could be unequivocally distinguished from normal parenchyma based on visual inspection in all contrast-enhanced CT phases. The absence of a statistically significant difference in SI between Bosniak IV lesions and the reference group is most likely attributable to the presence of a prominently enhancing solid component within the cysts. This component demonstrates higher contrast uptake than adjacent normal cortex, thereby elevating the mean SI of the lesion and contributing to an overlap in attenuation values between malignant cystic lesions and physiologically enhancing renal tissue (Table 5).
Table 5
Mean attenuation values of renal cystic masses > 4 cm across different computed tomography phases
In the assessment of the TCSI in renal cystic masses, the lowest mean values across all contrast-enhanced CT phases were observed in Bosniak category I lesions, while the highest were recorded in category IV cysts. Consistent with findings based on absolute attenuation, TCSI demonstrated the highest diagnostic utility in the CMP, where statistically significant differences were identified between nearly all Bosniak categories. Exceptions included comparisons between categories I and II, and between category IV cysts and the reference group, the latter of which has been addressed in detail above (Table 6).
Table 6
Mean tumor-to-cortex signal intensity ratio values of renal cystic masses > 4 cm across different computed tomography phases
Differentiation of Bosniak IIF cystic lesions
Differences in mean SI and TCSI between benign and malignant cystic lesions (cystic ccRCC) were systematically evaluated. Among Bosniak category IIF cysts, statistically significant differences in mean SI values were observed between benign and malignant lesions across all contrast-enhanced CT phases, except for the NCP (p = 0.109), with measurements obtained using ROIs encompassing the entire lesion volume. In all contrast phases, benign cysts exhibited consistently lower SI values compared to malignant ones. Specifically, in the CMP, the mean SI value of benign Bosniak IIF cysts was 31.42 ± 8.05 HU, whereas malignant cysts demonstrated significantly higher values, averaging 50.15 ± 14.78 HU (p = 0.004).
A comparable pattern was observed in the evaluation of the TCSI, with statistically significant differences in mean TCSI values between benign and malignant Bosniak IIF cysts identified across all contrast-enhanced CT phases, with the exception of the NCP (p = 0.721). In all phases, malignant lesions demonstrated consistently higher TCSI values relative to benign cysts. Specifically, in the CMP, the mean TCSI for benign lesions was 0.29 ± 0.08, whereas malignant lesions exhibited a significantly elevated mean value of 0.41 ± 0.12 (p = 0.017) (Figure 11, Table 7).
Figure 11
Boxplot of signal intensity (SI) and tumor-to-cortex signal intensity ratio (TCSI) in benign and malignant Bosniak IIF cysts > 4 cm across computed tomography (CT) phases
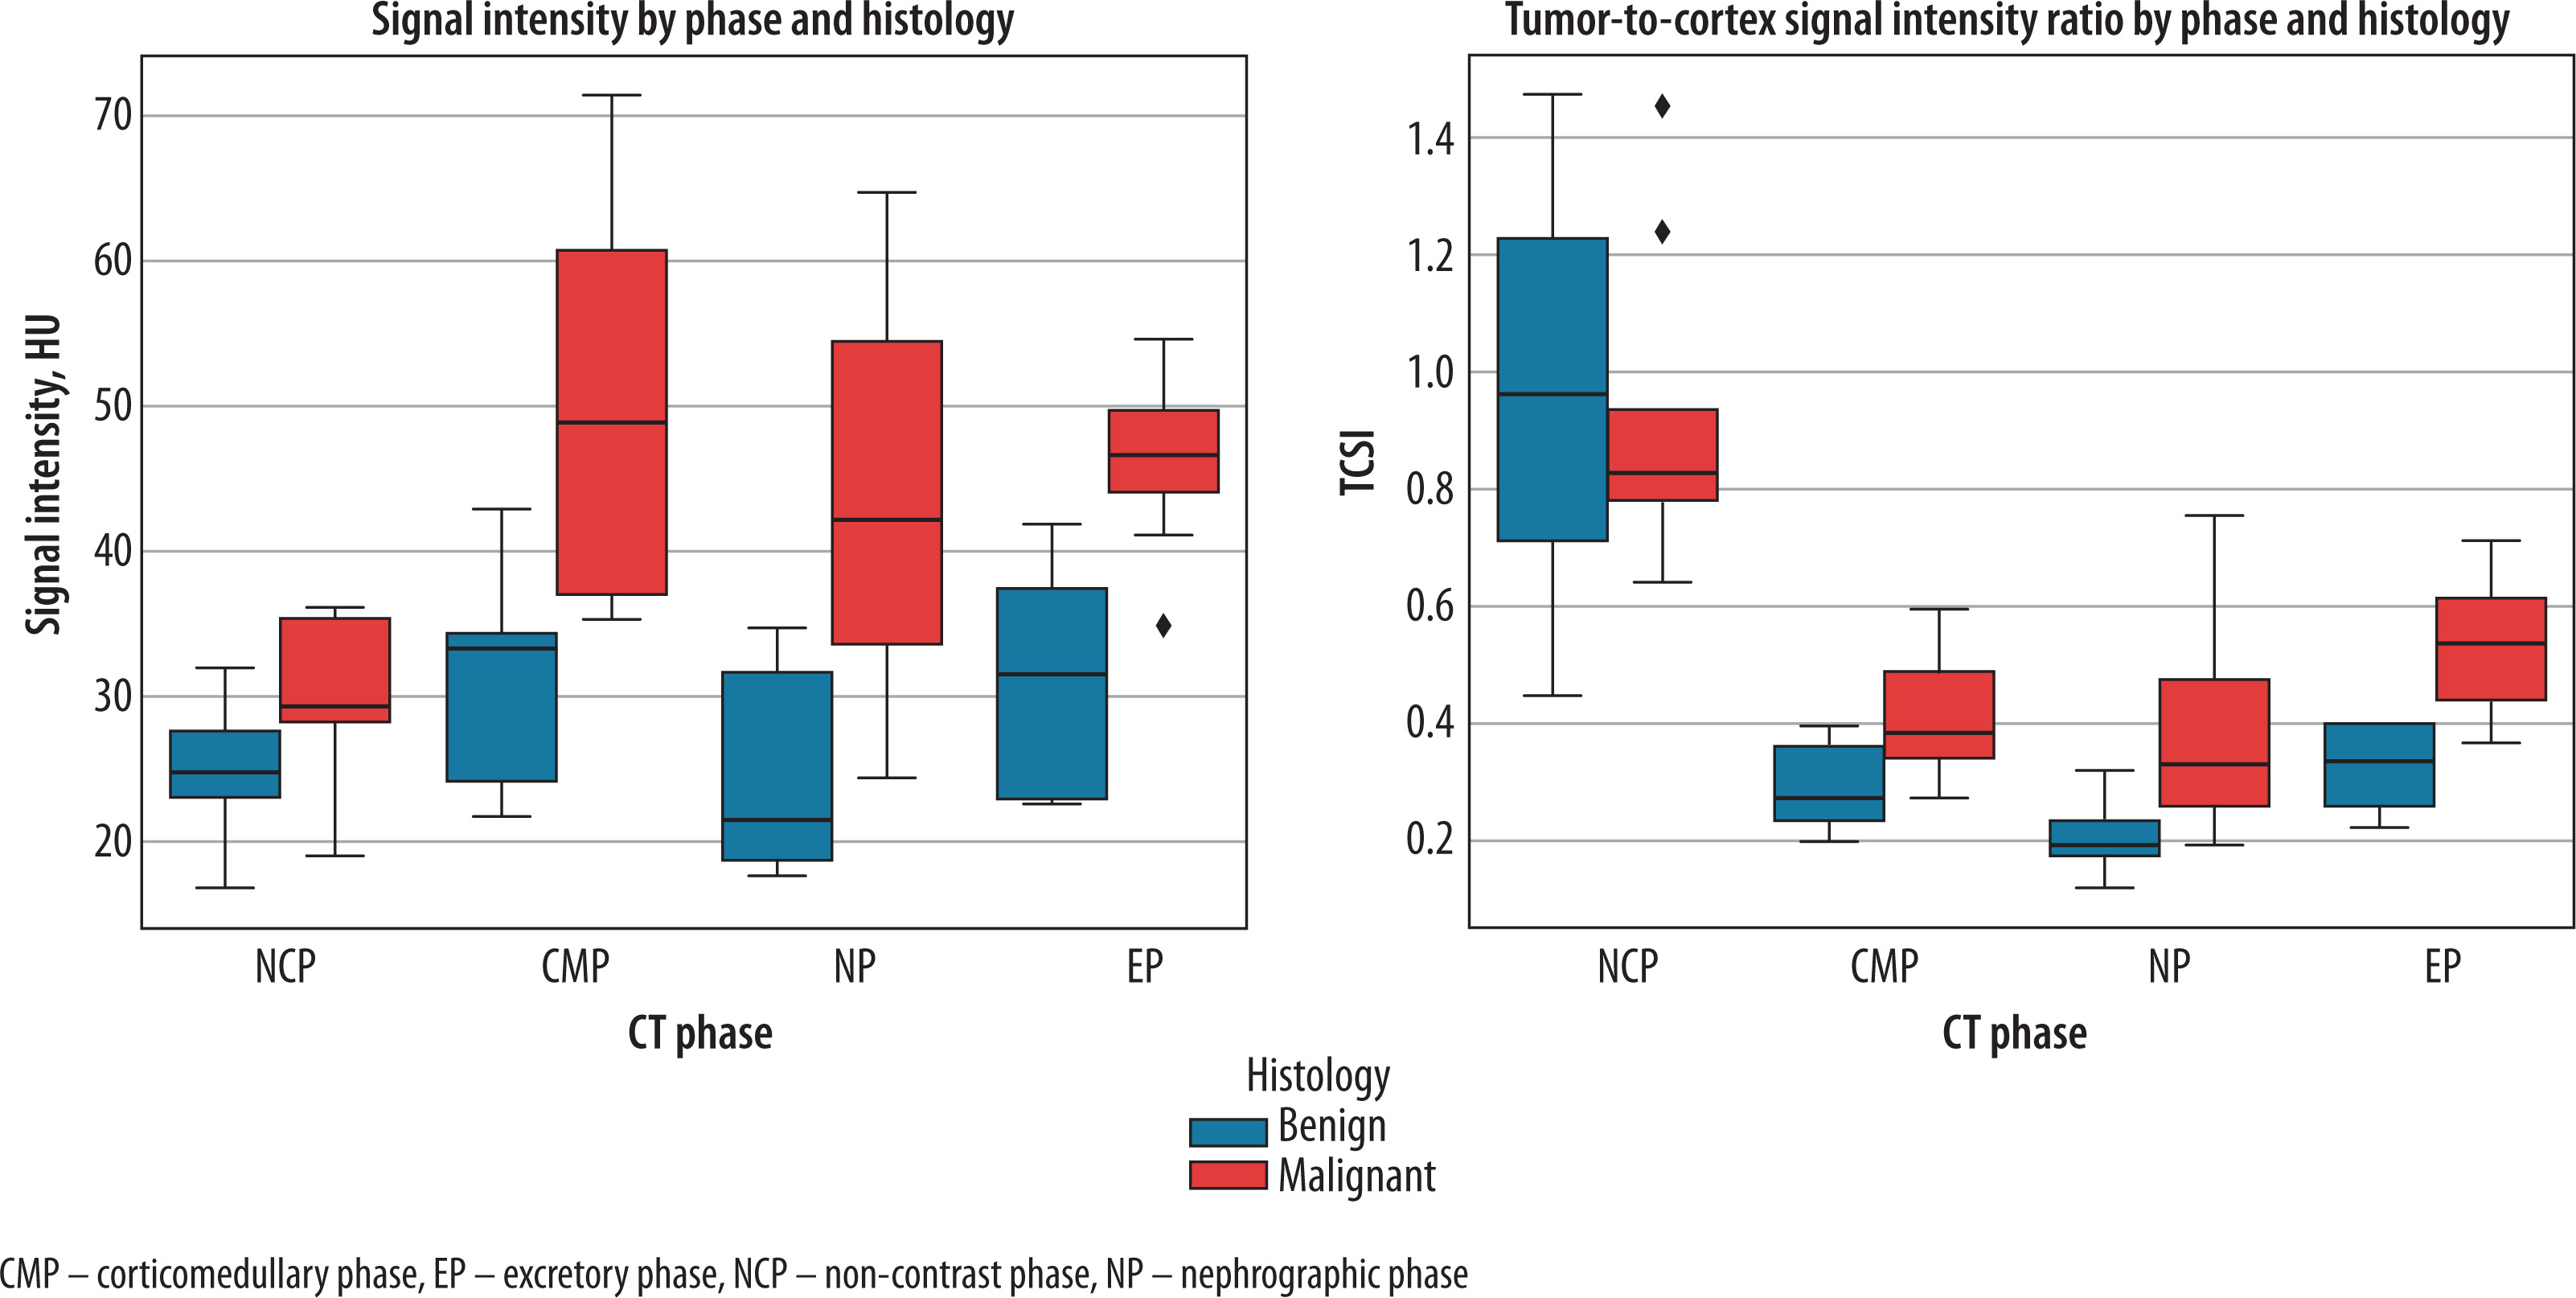
Table 7
Statistical analysis of signal intensity (SI) and tumor-to-cortex signal intensity ratio (TCSI) values for benign and malignant Bosniak IIF cysts across computed tomography phases
In the differentiation between benign and malignant Bosniak IIF cysts based on SI, the highest diagnostic performance was observed in the CMP: at an optimal threshold of 34.81 HU, sensitivity and specificity reached 100% and 77.8%, respectively (AUC = 0.910; 95% CI: 0.754-1.000; p = 0.004). Improved diagnostic accuracy was achieved using the TCSI ratio calculated from EP images: at a cutoff value of 0.40, the method yielded a sensitivity of 88.9%, specificity of 100%, and an AUC of 0.951 (95% CI: 0.847-1.000; p = 0.001) (Figure 12).
Differentiation of Bosniak III and IV cystic lesions
SI and TCSI of the solid components within Bosniak category III and IV cystic renal lesions were evaluated to differentiate benign from malignant pathology. Categories III and IV were combined to increase the sample size of benign cases. A statistically significant difference in mean SI of the solid components was identified on EP of CT images, where benign lesions demonstrated lower attenuation values compared to malignant ones (60.10 ± 15.67 HU vs. 75.62 ± 12.16 HU, p = 0.018, t = 2.499). Notably, in the CMP, the mean SI of solid components in malignant cysts closely approximated that of solid ccRCC (105.50 ± 27.02 HU vs. 106.20 ± 24.32 HU, respectively), whereas the SI values in benign cysts were comparable to those observed in benign solid renal tumors (85.73 ± 34.90 HU vs. 85.35 ± 20.08 HU, respectively). No statistically significant difference in mean TCSI values was observed between benign and malignant lesions in this cohort (p > 0.05).
These findings support the clinical relevance of separately assessing the attenuation of solid components within Bosniak III and IV cysts, in addition to whole-lesion measurements, to enhance the differential diagnosis of malignant versus benign lesions. Application of an attenuation threshold of 59.75 HU for the solid component allowed differentiation of malignant cystic lesions with a sensitivity of 88.5% and specificity of 60% (AUC = 0.762; 95% CI: 0.486-0.998; p = 0.049).
No statistically significant differences in either SI or TCSI values were observed between low-grade and high-grade cystic ccRCCs according to the Fuhrman grading system (p > 0.05).
The following figures demonstrate the application of tumor SI and the tumor-to-normal renal parenchyma attenuation ratio for the characterization of renal masses exceeding 4 cm in diameter (Figures 13 and 14).
Figure 13
Multiphase computed tomography images of a 49-year-old female patient with a Bosniak I cyst located in the lower pole of the left kidney, measuring 8.20 × 7.88 × 7.78 cm. Region of interest placed over the cystic component. A) Non-contrast phase, signal intensity (SI) = 5.43 HU, tumor-to-cortex signal intensity ratio (TCSI) = 0.23; B) corticomedullary phase, SI = 5.56 HU, TCSI = 0.09; C) excretory phase, SI = 6.45 HU, TCSI = 0.10
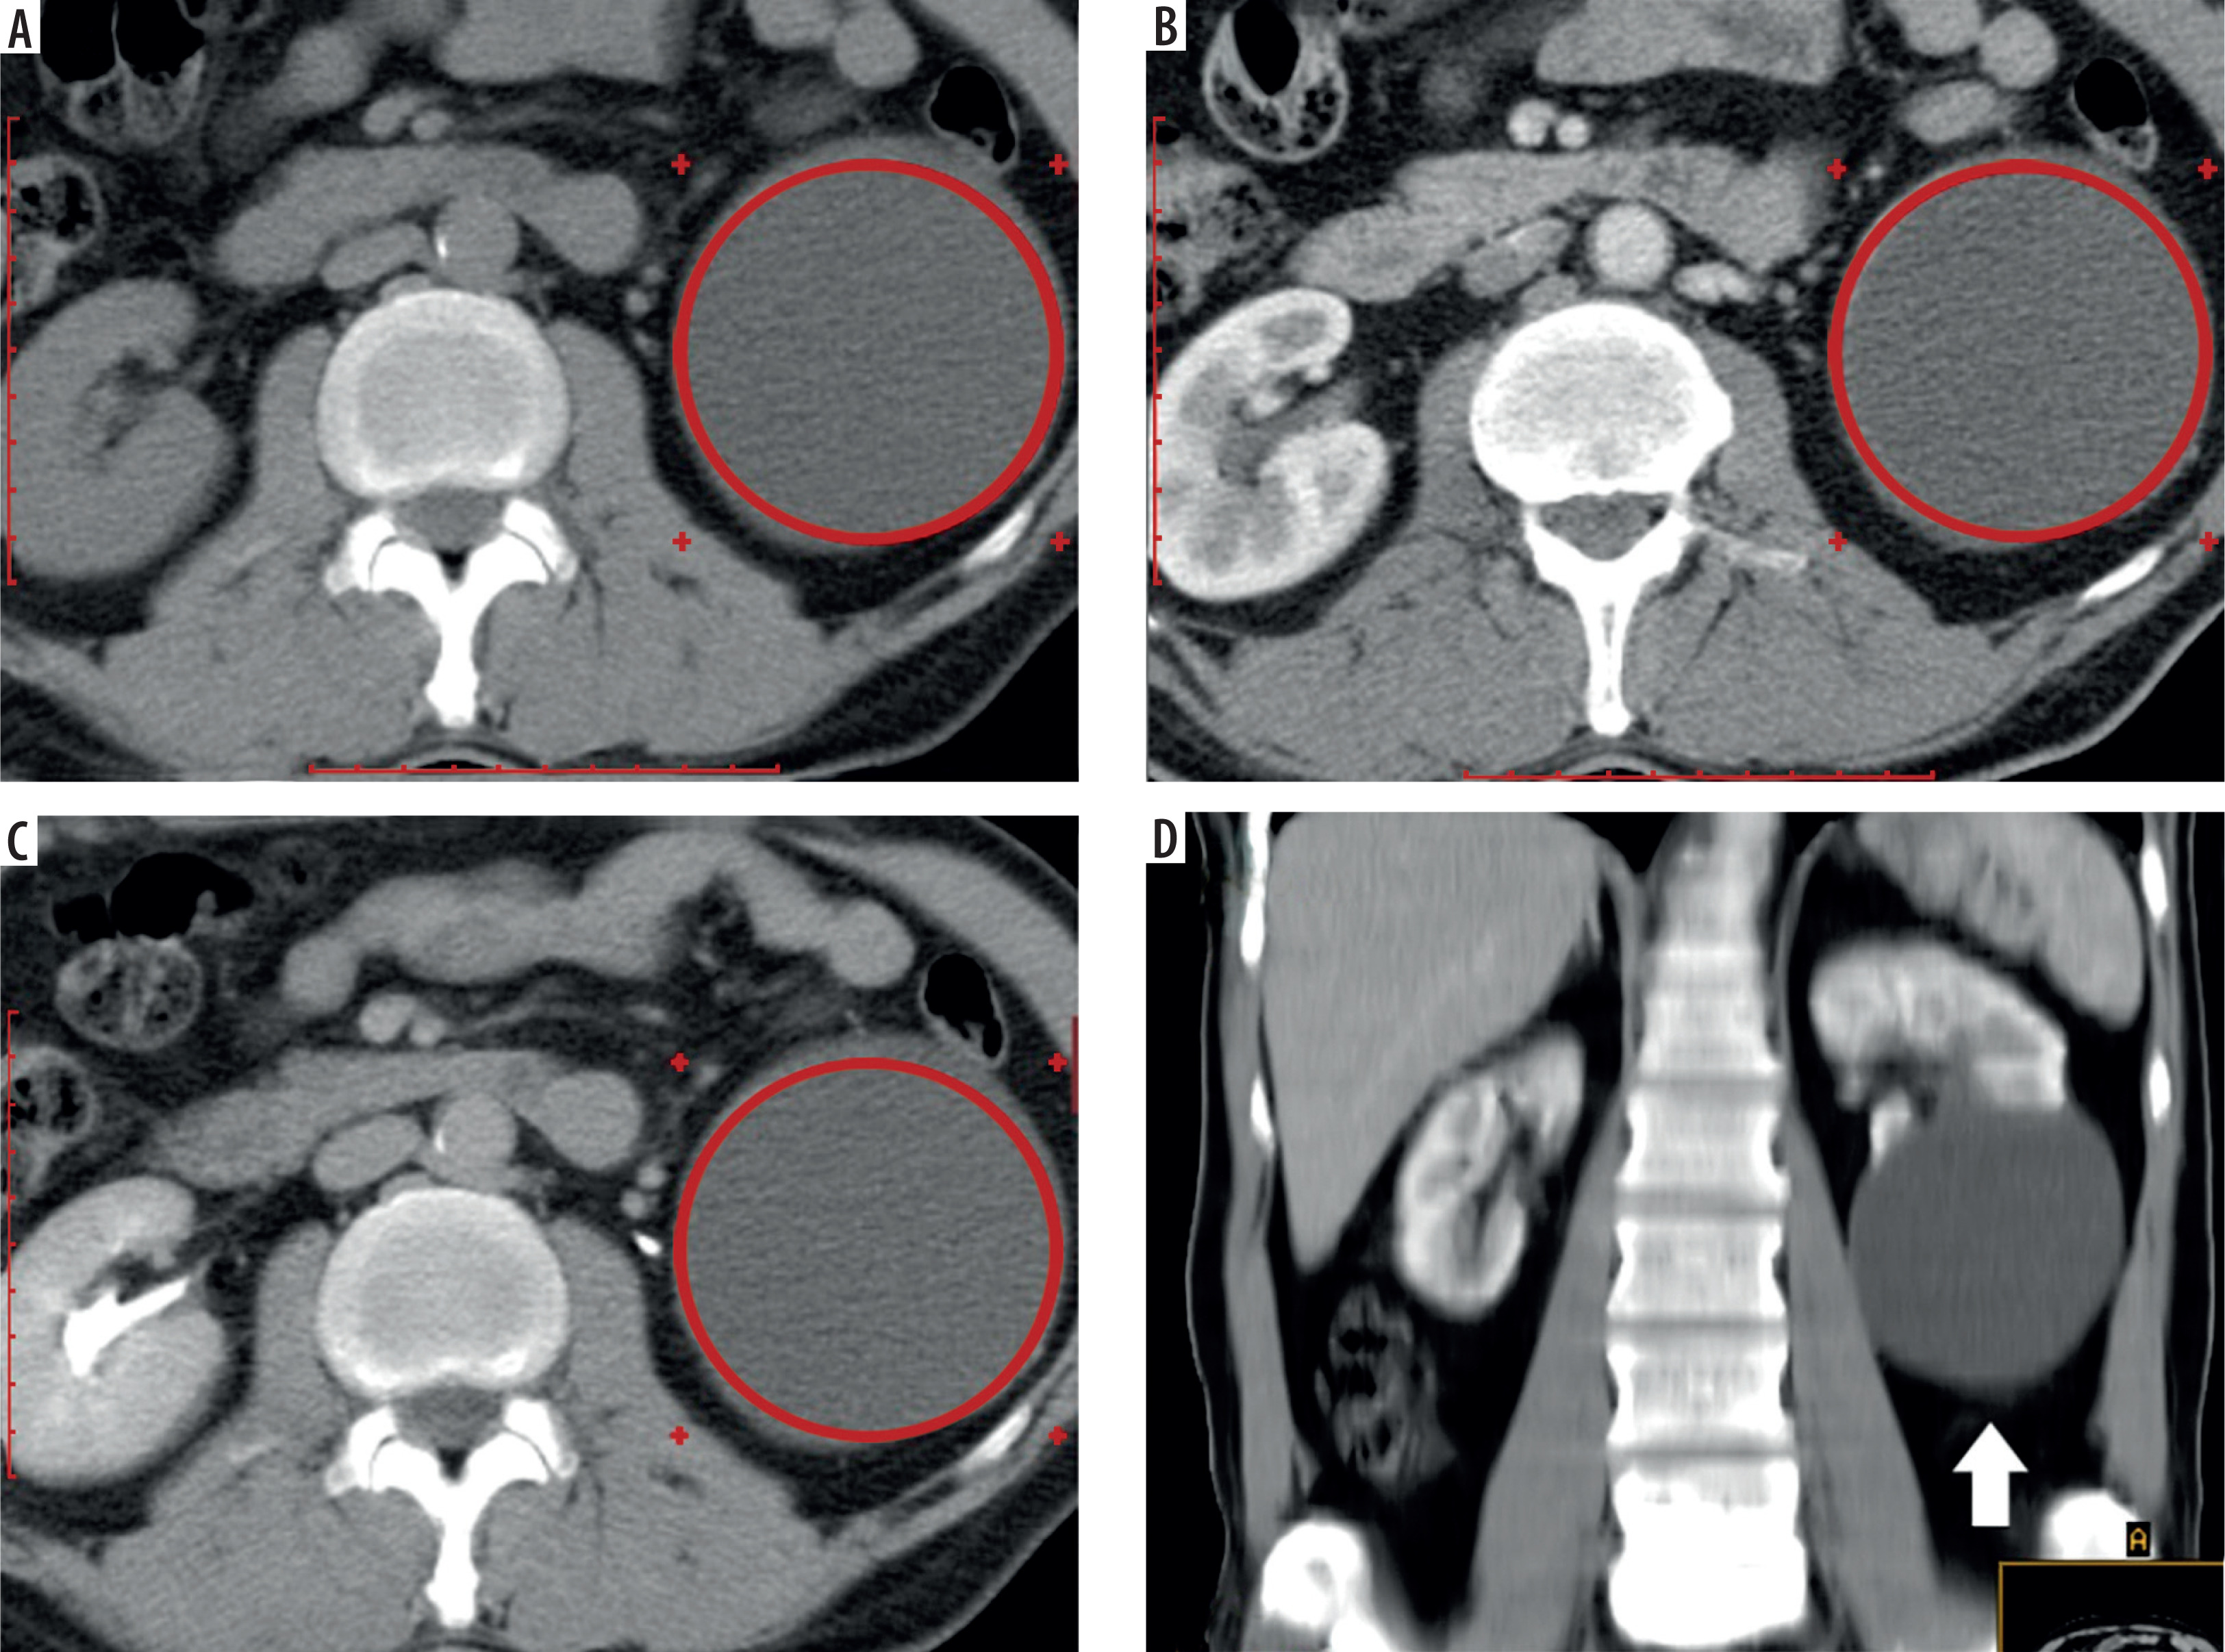
Figure 14
Multiphase computed tomography images (axial view) of a 58-year-old male patient with a Bosniak IV cyst located in the lower pole of the left kidney, measuring 9.45 × 8.16 × 8.09 cm. A central small calcification is visible within the cyst. Region of interest placed over the enhancing solid component (arrow). A) Corticomedullary phase, signal intensity (SI) = 109.67 HU, tumor-to-cortex signal intensity ratio (TCSI) = 0.89; B) nephrographic phase, SI = 87.43 HU, TCSI = 0.76; C) excretory phase, SI = 72.45 HU, TCSI = 0.89. The patient underwent radical nephrectomy. Histopathological diagnosis: cystic clear cell renal cell carcinoma, pT2aN0M0, Fuhrman grade III
Differentiation of metastatically involved lymph nodes
To assess the attenuation characteristics of regional lymph nodes with (pathologically node-positive – pN1) and without (pathologically node-negative – pN0) metastatic involvement in patients with RCC following radical nephrectomy, pathological findings were correlated with CT-derived data obtained in different contrast-enhanced phases. The analysis was limited to paraaortic lymph nodes on the ipsilateral side of the tumor.
Patients with pN1 disease and lymph nodes measuring ≥ 1.5 cm in the short axis, all of which demonstrated metastatic infiltration on histopathological examination (n = 15; size range: 1.50-3.22 cm; mean: 1.94 ± 0.51 cm), were compared to those with lymph nodes ≤ 1 cm in the short axis that were histologically confirmed as non-metastatic (n = 18; size range: 0.75-1.00 cm; mean: 0.95 ± 0.09 cm).
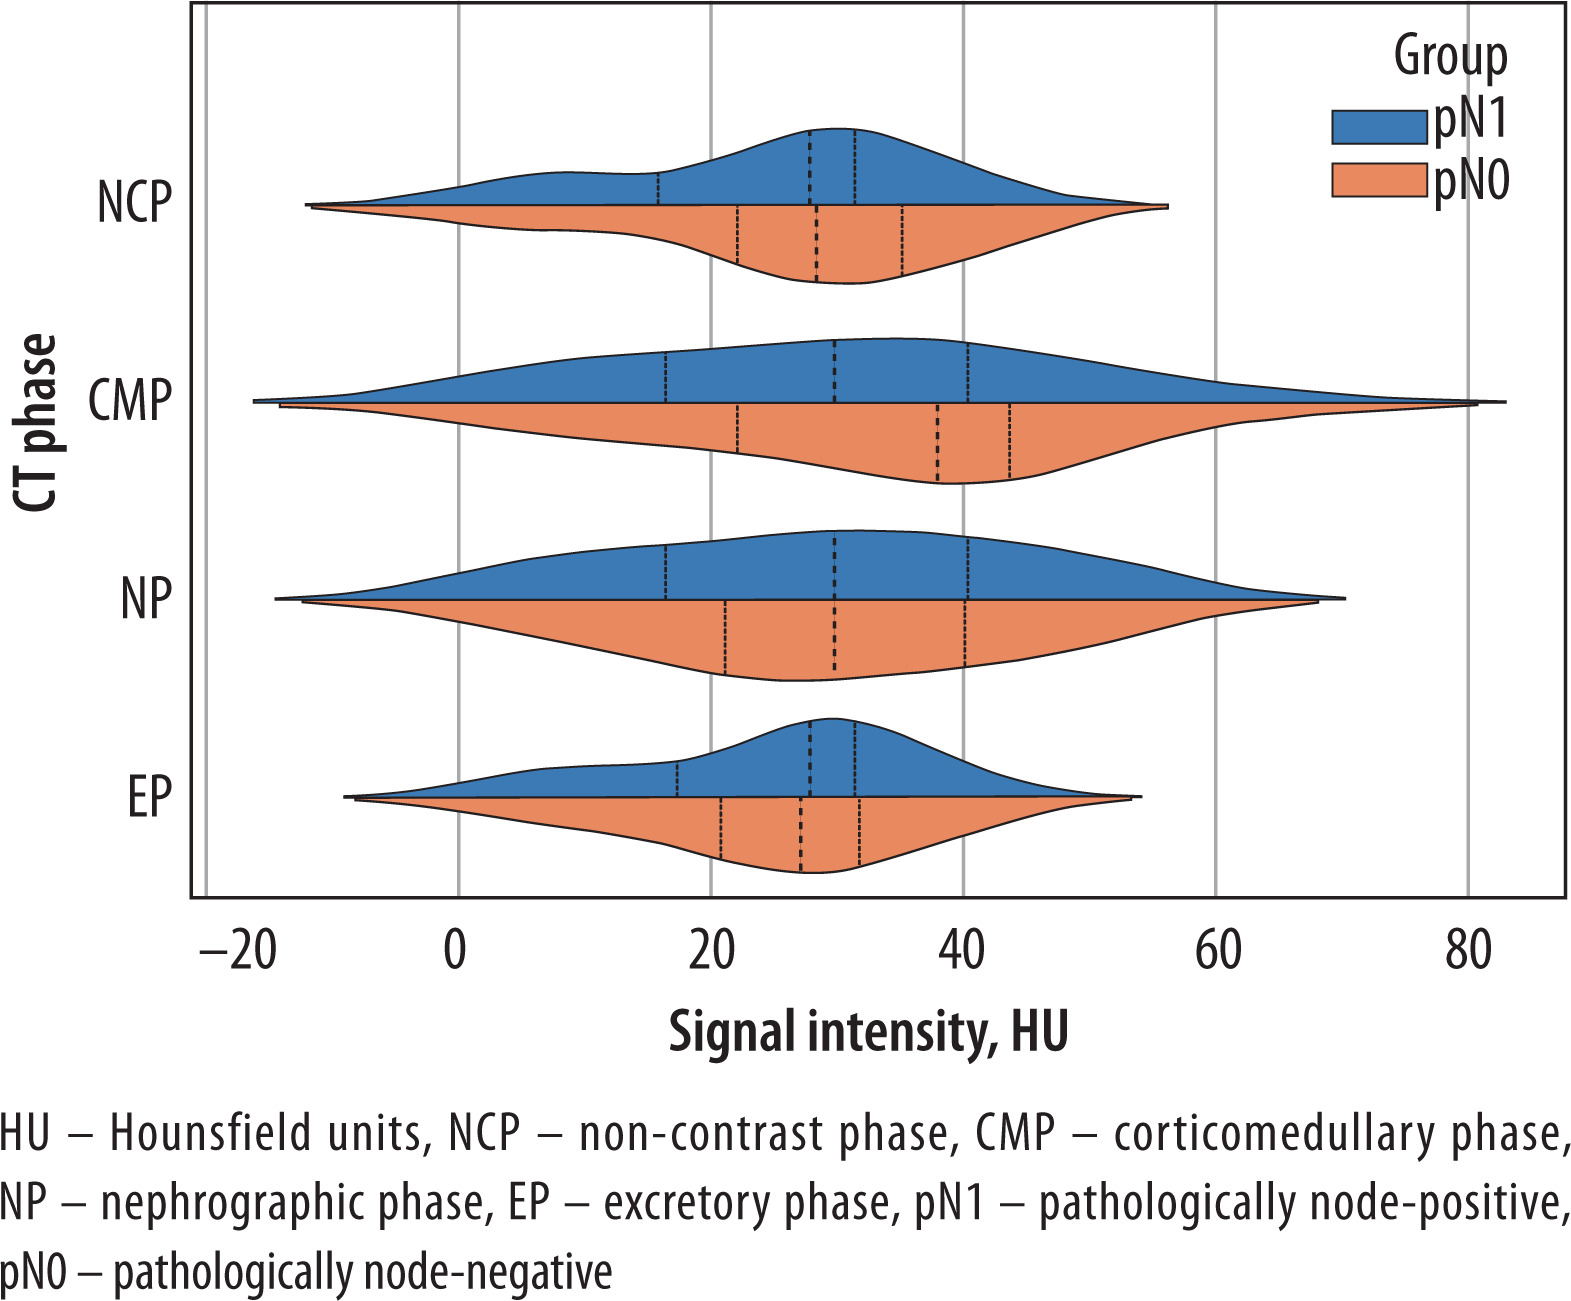
In the pN1 subgroup, mean attenuation values in the NCP, CMP, NP, and EP were 25.64 ± 11.93 HU, 30.13 ± 17.07 HU, 28.87 ± 15.58 HU, and 24.94 ± 10.93 HU, respectively. Corresponding values in the pN0 group were 27.17 ± 12.15 HU, 34.20 ± 16.53 HU, 29.47 ± 15.07 HU, and 24.47 ± 10.84 HU. Despite the observed differences in mean SI values between the groups, the relatively high standard deviations and overlapping CI across all CT phases indicate substantial intra-group variability and fluctuation; none of the comparisons reached statistical significance (p > 0.05) (Figure 15).
Figure 15
Signal intensity distribution in pN1 vs pN0 lymph nodes across computed tomography (CT) contrast phases
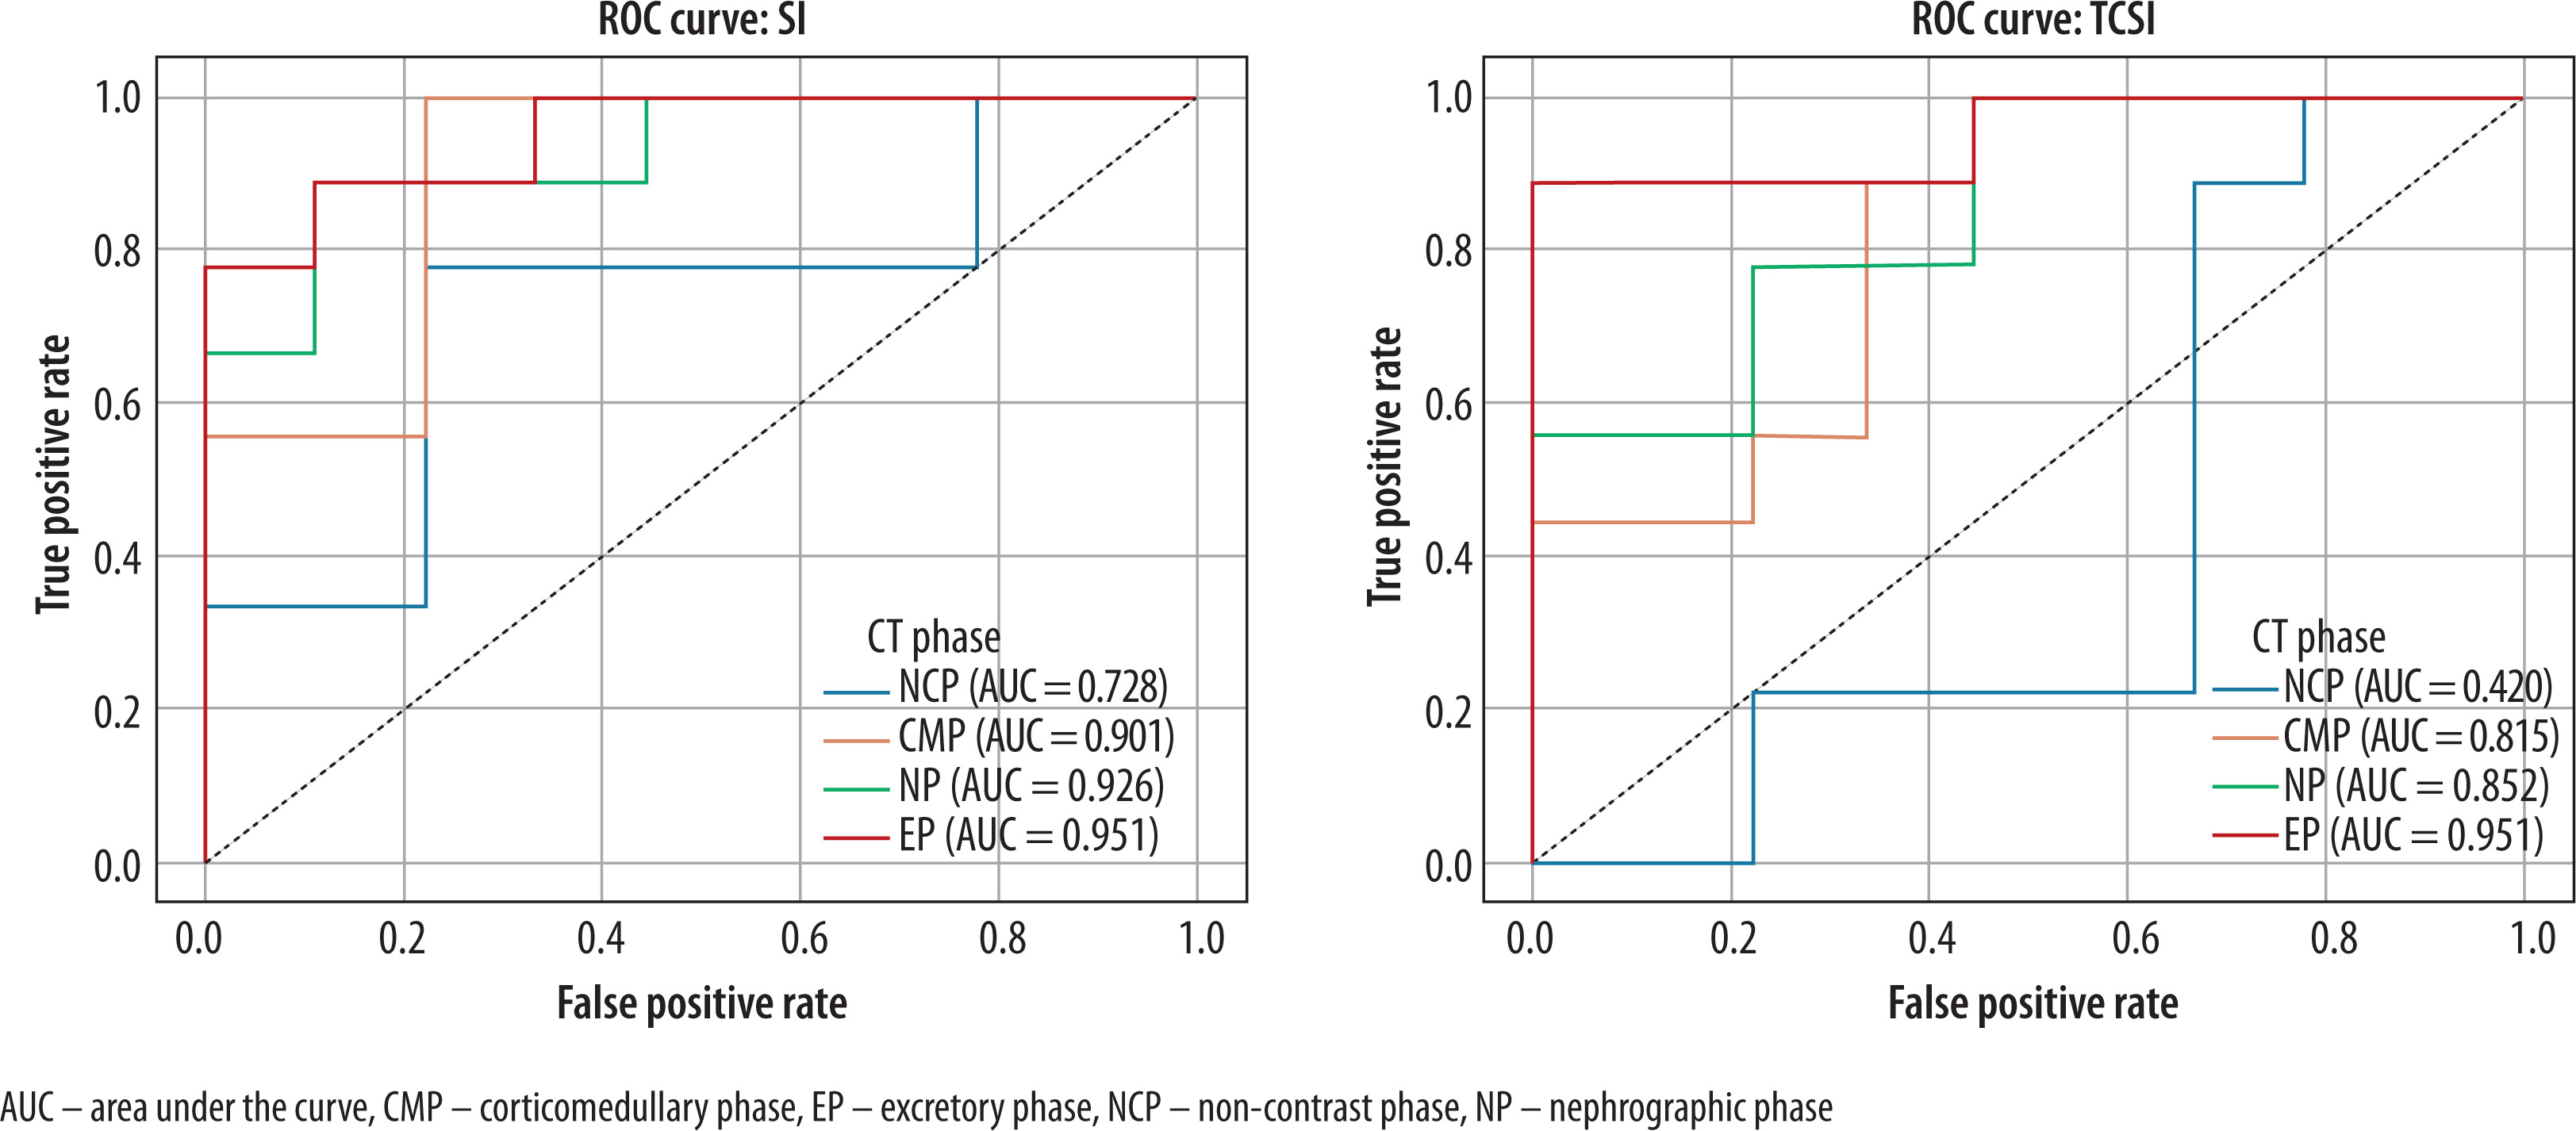
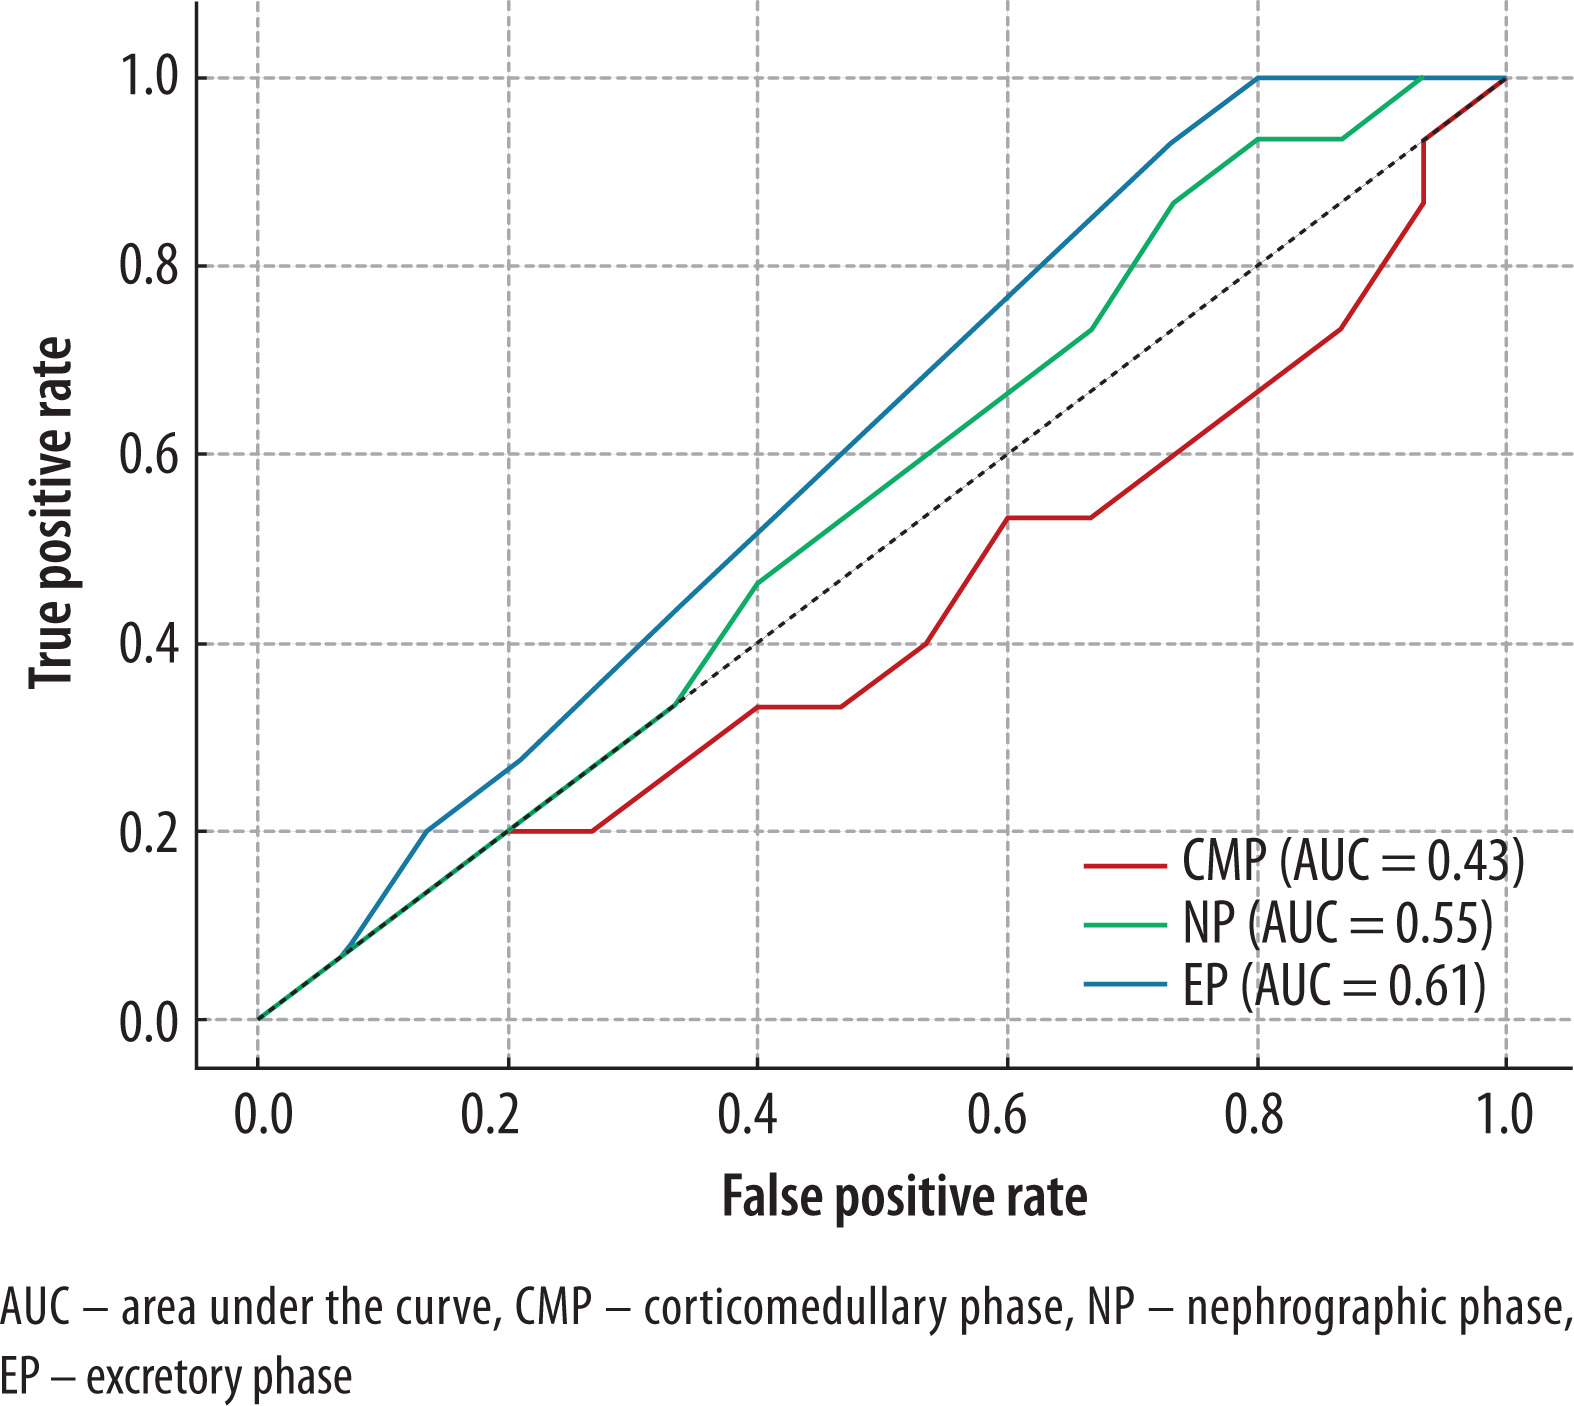
Additionally, to evaluate the diagnostic utility of CT-derived markers in differentiating pN1 from pN0 paraaortic lymph nodes in patients with RCC, percentage changes in SI during contrast-enhanced phases were calculated relative to the NCP. In the CMP, the mean percentage SI change was +5.6 ± 25.4% for pN1 and +7.3 ± 24.6% for pN0 nodes (p = 0.74). In the NP, the changes were +4.5 ± 24.5% for pN1 and +7.8 ± 21.8% for pN0 (p = 0.62). In the EP, the SI decreased slightly in both groups, with mean changes of –2.7 ± 24.6% for pN1 and –0.5 ± 20.6% for pN0 (p = 0.58). ROC analysis demonstrated limited discriminatory performance, with AUC values of 0.43 (p = 0.73) for CMP, 0.55 (p = 0.58) for NP, and 0.61 (p = 0.29) for EP. The best diagnostic performance was achieved in the EP, yielding a sensitivity of 93.3% and a specificity of 26.7% at an optimal threshold corresponding to a negative percentage change in attenuation (ΔSI < 0%) (Figure 16). These results suggest that percentage changes in attenuation values across contrast-enhanced phases provide suboptimal differentiation between metastatic and non-metastatic lymph nodes in this clinical context.
Discussion
Cross-sectional imaging modalities, particularly MRI, have proven valuable in assessing RCC characteristics, including histologic subtype, tumor recurrence, and response to systemic therapy, as well as thrombus composition in advanced disease [23–26]. However, CT remains the most widely used modality for preoperative assessment due to its availability and integration into standard diagnostic pathways. Despite its routine use, conventional CT has shown limited accuracy in distinguishing benign from malignant renal tumors, with reported diagnostic performance as low as 17% in certain cohorts – contributing to high rates of unnecessary nephrectomies, up to one-third of which reveal benign histology. Our findings address this diagnostic gap by demonstrating that simple, quantitative biomarkers – specifically SI and TCSI ratio – derived from MCECT can significantly improve lesion characterization. The diagnostic utility of these enhancement-based parameters, particularly when measured across multiple CT phases, offers a substantial advantage over subjective radiological interpretation. These results corroborate previous evidence linking vascular enhancement patterns on CT to tumor histology [20,21,27,28] and extend this approach by providing reproducible, phase-specific thresholds applicable to renal masses > 4 cm. In this context, our study proposes a clinically accessible, non-invasive method that enhances diagnostic confidence and supports individualized surgical decision-making.
Differentiation of solid lesions
Signal SI in the EP proved highly effective for distinguishing RCC from other solid renal neoplasms in our study. An absolute attenuation threshold (approximately 55 HU on EP images) captured nearly all RCCs while excluding a substantial proportion of benign lesions. This observation is consistent with the well-established hyperenhancement of malignant renal tumors. For example, Young et al. [27] found that ccRCCs enhance to much higher peak values than OC or other subtypes (on average ~125 HU vs. ~106 HU in CMP). Similarly, Kim et al. [28] reported that clear cell carcinomas showed significantly greater enhancement than fat-poor AMLs and chRCCs in early and delayed phases. Our data reinforce these trends: clear cell tumors in our cohort tended to retain higher attenuation on EP than benign lesions, reflecting slower contrast washout and richer vascular supply. Notably, using the TCSI ratio did not substantially improve the discrimination between RCC and benign masses in this context. This suggests that absolute tumor vascularity (likely reflecting neoangiogenesis) is the dominant differentiator, whereas normalizing to cortical enhancement may dampen the contrast between hypervascular tumors and the renal parenchyma. In practice, therefore, a straightforward measurement of lesion HU on delayed images can alert radiologists to a high likelihood of malignancy, an approach that could be readily incorporated into routine CT interpretations. This is consistent with recent advances in computer-aided diagnostic approaches, which aim to enhance lesion characterization and improve diagnostic accuracy [29,30].
Histological subtypes
Our analysis of RCC histological subtypes further underscores the clinical relevance of enhancement-based biomarkers. We observed distinct enhancement profiles for clear ccRCC, pRCC, and chRCC. In the CMP, chRCC demonstrated significantly lower enhancement than ccRCC and pRCC (p < 0.01), consistent with its known lower microvascular density. This finding mirrors previous reports: for instance, Kim et al. [28] noted mean corticomedullary attenuation of ~85 HU for chromophobe vs. 140 HU for ccRCC. ccRCC in our study showed the widest range of SI values and the highest peak enhancements, reflecting the heterogeneous angiogenesis characteristic of this subtype. pRCC, by contrast, generally exhibited more modest enhancement. Although our cohort’s papillary tumors occasionally reached high attenuation values (and we did not find a significant CMP difference between ccRCC and pRCC, likely due to sample size and subtype I/II mix), the overall trend aligns with the literature documenting that papillary lesions are hypovascular relative to clear cell tumors [17]. Yang et al. [30] reported ccRCC enhancing roughly twice as strongly as pRCC on average (125 HU vs. 54 HU in early phase), which underscores how divergent their vascular characteristics can be. It is important to note that despite these trends, overlap exists – as evidenced by the range of clear cell enhancements and our finding that ccRCC and pRCC could not be fully separated by any single threshold in the CMP. The TCSI metric did not add discriminative power for subtype classification in our data (except for a subtle difference between pRCC and chRCC), indicating that both tumor and cortex tended to enhance proportionally across subtypes. Overall, our results demonstrated that ccRCCs are markedly hyperenhancing lesions, whereas chRCCs and pRCCs enhance less avidly or peak in later phases. This information could aid clinical decision-making; for instance, patients with likely indolent papillary tumors might be candidates for nephron-sparing approaches or active surveillance in select scenarios, whereas those with hypervascular clear cell lesions may warrant closer monitoring for metastases even after resection. Recent studies employing radiomics and machine learning approaches using CT-based features for RCC characterization have reported high diagnostic performance, with AUC values ranging from 0.81 to 0.95 across various models [31–34]. However, their clinical applicability remains limited due to challenges in standardization, external validation, and integration into routine diagnostic workflows.
Characterization of cystic lesions
Perhaps the most impactful application of SI and TCSI biomarkers in our study is in refining the diagnosis of complex cystic renal masses, particularly Bosniak IIF lesions. These indeterminate cysts pose a well-known management dilemma: only a minority will progress or prove malignant, yet conventional imaging has been insufficient to confidently distinguish benign from malignant cysts without interval growth or change [35]. Crucially, once a Bosniak IIF lesion demonstrates suspicious features and is referred for surgical intervention, histopathological analysis often confirms malignancy [36]. This underscores the clinical importance of accurate preoperative characterization to guide management decisions. In our series, 50% of resected Bosniak IIF cysts were ultimately cystic RCCs, reflecting an enriched surgical cohort. Our data indicate that CT enhancement measurements can stratify risk before overt progression occurs. We found that malignant Bosniak IIF cysts exhibited significantly higher contrast enhancement than benign cysts in each post-contrast phase (e.g., on CMP, cystic RCCs averaged ~50 HU vs. ~30 HU for benign cysts). This translated to excellent diagnostic performance: using a simple threshold of ~35 HU in the CMP, our approach achieved 100% sensitivity for malignancy, while a TCSI cutoff of 0.4 in the EP yielded nearly 90% sensitivity and 100% specificity. To our knowledge, such high diagnostic performance for Bosniak IIF lesions on CT has not been previously reported. By enabling more confident differentiation of benign vs. malignant Bosniak IIF lesions, our CT-based biomarkers could help address both issues: identifying those “hidden” malignancies within Bosniak IIF that merit timely surgery, and conversely sparing truly benign cysts (or indolent low-grade tumors) from unnecessary intervention. Our study provides a CT-based method that is widely accessible and could be readily incorporated into radiology workflows, potentially serving as a decision tool for urologists when counseling patients with Bosniak IIF cysts. Compared to recent CT-based radiomics models for classifying Bosniak IIF–IV cysts – which achieved outstanding diagnostic accuracy with AUCs up to 0.972 [37] and 0.941 [38] – our study offers a more accessible approach based on standard enhancement metrics rather than high-dimensional feature extraction and machine learning pipelines. While these radiomics models demonstrate excellent performance, their clinical implementation remains limited by complexity and lack of standardization, highlighting the potential utility of simpler multiphase CT biomarkers, as demonstrated in our analysis.
pN1 and pN0 lymph nodes
Our study demonstrated that CT-derived SI values could not reliably distinguish metastatic (pN1) from non-metastatic (pN0) lymph nodes in RCC, with area under the ROC curve < 0.61, reflecting significant overlap. These findings align with a comprehensive review by Tadayoni et al., wherein CT criteria (≥ 1 cm short-axis) exhibited moderate sensitivity (~78%) and specificity (~83.5%), whereas MRI showed higher sensitivity (92-95.7%) and FDG-PET demonstrated 100% specificity but limited sensitivity (~75) [39–41]. The authors suggest that combining high-sensitivity MRI (to rule out disease) with high-specificity PET (to confirm metastases) may optimize nodal staging – an approach that our results support, given CT’s limitations in identifying micrometastatic or reactive lymph nodes.
Limitations
Our study has several limitations. First, it was a retrospective, single-center analysis with a moderate sample size. Second, histopathological confirmation was unavailable for some benign cystic lesions due to the adoption of conservative management approaches. External validation in independent cohorts is essential prior to the clinical implementation of SI- and TCSI-based imaging biomarkers. Integration with radiomics and artificial intelligence-based classifiers may further enhance diagnostic accuracy and facilitate risk stratification, surveillance, and surgical decision-making for indeterminate renal masses.
Conclusions
Multiphase CT-derived SI and TCSI ratio provide accessible, reproducible markers for the non-invasive characterization of large solid and cystic renal masses > 4 cm in size. These parameters demonstrated high diagnostic accuracy in distinguishing malignancy, histologic subtype, and tumor grade, particularly in the corticomedullary and excretory phases. Their incorporation into routine CT workflows may enhance preoperative risk stratification and serve as a basis for future AI-integrated diagnostic models.