Introduction
Glioma is the most common tumour of the intracranial central nervous system (CNS). It was previously classified as grade I-IV according to the histological characteristics of tumour. Over the past 15 years of research, gliomas with the same histology type have been found to have different genetic characteristics, such as isocitrate dehydrogenase (IDH) mutation, codeletion of chromosome 1P/19q, and promoter methylation of O6-methylguanine-DNA-methyltransferase (MGMT) [1]. The 2016 edition of the WHO Central Nervous System Tumour Classification uses molecular characteristics to define brain tumours for the first time on the basis of traditional histology [2]. The 2021 edition of the WHO Central Nervous System Tumour Classification continues to expand the role of molecular signatures in tumour diagnosis, defining more tumour types through molecular signatures [3]; the most dominant molecular feature is IDH mutation status. At present, many scholars have shown that IDH mutation status has great significance for the prognosis of glioma patients [4], so it is of great clinical significance to predict preoperative IDH mutation status.
Diffusion kurtosis imaging (DKI) is a magnetic resonance technology based on a non-Gaussian distribution model, which is an extension of diffusion tensor imaging (DTI) technology. DKI can quantitatively describe the non-Gaussian distribution of water molecules inside and outside cells and quantify the microstructural changes in diseased tissue. The mean kurtosis (MK) represents the average value of the diffusion kurtosis in each gradient direction in space, reflecting the complexity of the tissue structure [5]. Therefore, DKI imaging can reflect the heterogeneity of gliomas at the functional microscopic level and provide new technical means for preoperative non-invasive evaluation of IDH mutation status [6].
Material and methods
Clinical data
The clinical and imaging data of 25 patients with WHO grade II glioma in our hospital from January 2015 to October 2019 were retrospectively analysed. There were 10 males and 15 females, with an age range of 21-71 years, and the average age was about 46.32 ± 13.19 years. Twentyfive patients underwent routine magnetic resonance imaging (MRI) and DKI scanning before the operation, and they did not receive drugs, chemotherapy, radiotherapy, or other interventions before the examination. After the operation, the tissue wax block was sent to the Medical Laboratory for Sanger (dideoxy terminal termination method) sequencing to obtain IDH mutation status.
Data acquisition
A GE 3.0T superconducting magnetic resonance scanner was used to collect information with an 8-channel head-neck combined topologically phased front coil. The conventional MRI scanning sequence included axial T1WI, T2WI, T2FLAIR, sagittal T1WI, and T1WI enhanced axial, sagittal, and coronal scanning. Conventional MR sequence parameters: axial T1WI (TR = 1677 ms, TE = 25 ms, slice thickness 6.0 mm), sagittal T1WI (TR = 1710 ms, TE = 24.5 ms, slice thickness 6.0 mm), axial T2WI (TR = 6480 ms, TE = 111 ms, slice thickness 6.0 mm), and T2WI FLAIR (TR = 8000 ms, TE = 125 ms, slice thickness 6.0 mm). Enhancement sequence (TR = 1500 ms, TE = 14 ms, slice thickness 6.0 mm), contrast medium (0.1 mmol/kg body weight of Gd-DTPA) was injected at a rate of 2 ml/s, followed by a 20 ml 0.9% saline flush using the same injection speed. DKI using echo planar imaging (EPI) sequence, scanning parameters: TR = 23,000 ms, TE = 108 ms, spatial resolution = 0.24 × 0.24 × 6 mm3, layer interval: 0 mm, 30 gradient directions, b = 0, 500, 1000, 1500, 2000, and 2500 s/mm2.
Image post-processing and parameter measurement
DKI parameter images were obtained by Functool software on a GE Advantage Workstation 4.4 (Figures 1 and 2). Combined with MRI conventional images, the region of interest (ROI) was set in the tumour parenchyma area, peritumoral oedema area, and contralateral normal white matter area (CNAWM) at the same level. The fractional anisotropy (FA), mean diffusion coefficient (MD), mean kurtosis (MK), axial diffusion kurtosis (Ka), and radial diffusion kurtosis (Kr) of each ROI were measured. The ROI of the parenchymal area should be selected with enhanced images. If the tumour is enhanced, the tumour enhancement area is selected, and the cystic degeneration and necrotic areas are avoided at the same time. If the tumour is not enhanced and the signal in the parenchymal area is uneven, the lowest signal area of the apparent diffusion coefficient (ADC) map of the parenchymal part of the tumour is selected as the region of interest. The ROI of the peritumoral oedema area was selected near the tumour parenchyma to remove the tumour body and normal brain tissue areas. The selected ROIs were circular or elliptical; each ROI included at least 30 pixels; and each ROI was measured repeatedly 3 times to take the average value. To exclude the influence of different regional parameters in the brain, the obtained DKI parameters were divided by the contralateral normal white matter area (NAWM) to obtain the ratio of FA (rFA), ratio of MD (rMD), ratio of MK (rMK), ratio of Ka (rKa), and ratio of Kr (rKr).
Figure 1
Female, 59 years old, WHO II grade astrocytoma, isocitrate dehydrogenase (IDH)-mutant type, and abnormal unreinforced signal in the right frontotemporal island lobe, multiparametric magnetic resonance (MR) images include T1WI (A), T2WI (B), T2-FLAIA (C), Gd-enhanced T1WI (D), and maps of fractional anisotropy (E), mean diffusivity (F), mean kurtosis (G), axial kurtosis (H), and radial kurtosis (I). Multiparametric MR indices were measured in regions of the tumour (1), oedema (2), and contralateral normal white matter area (3)
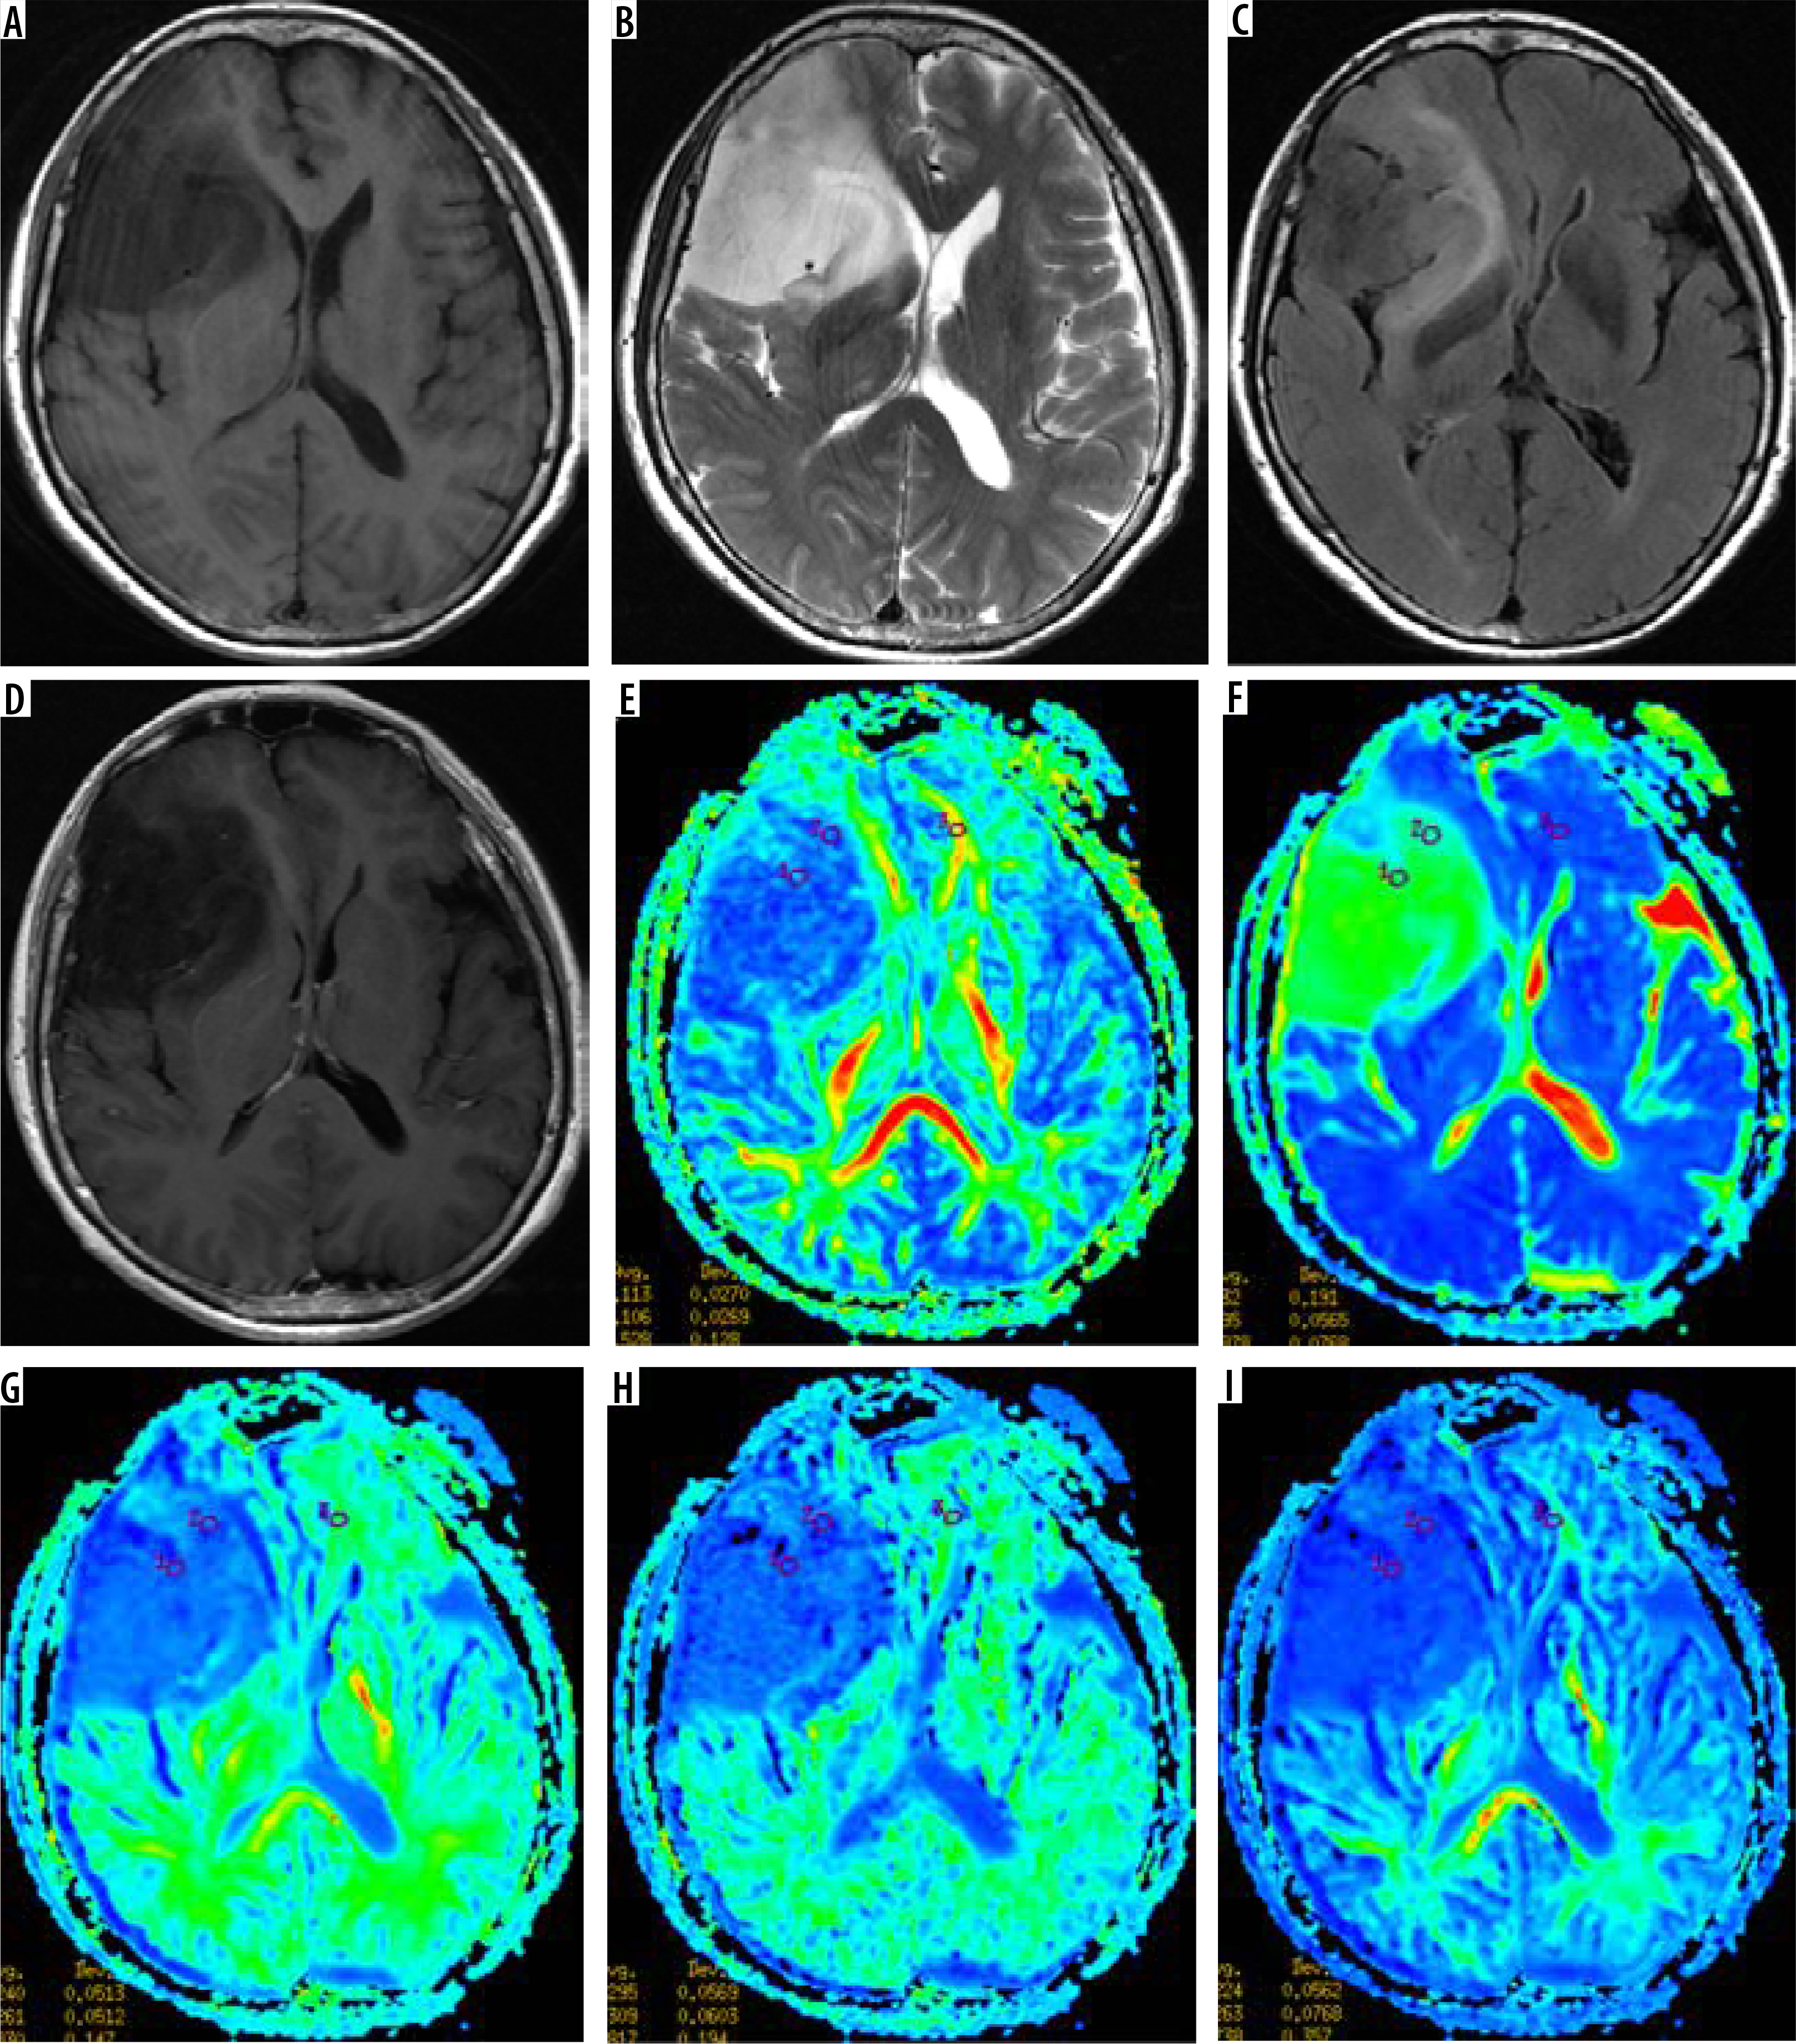
Figure 2
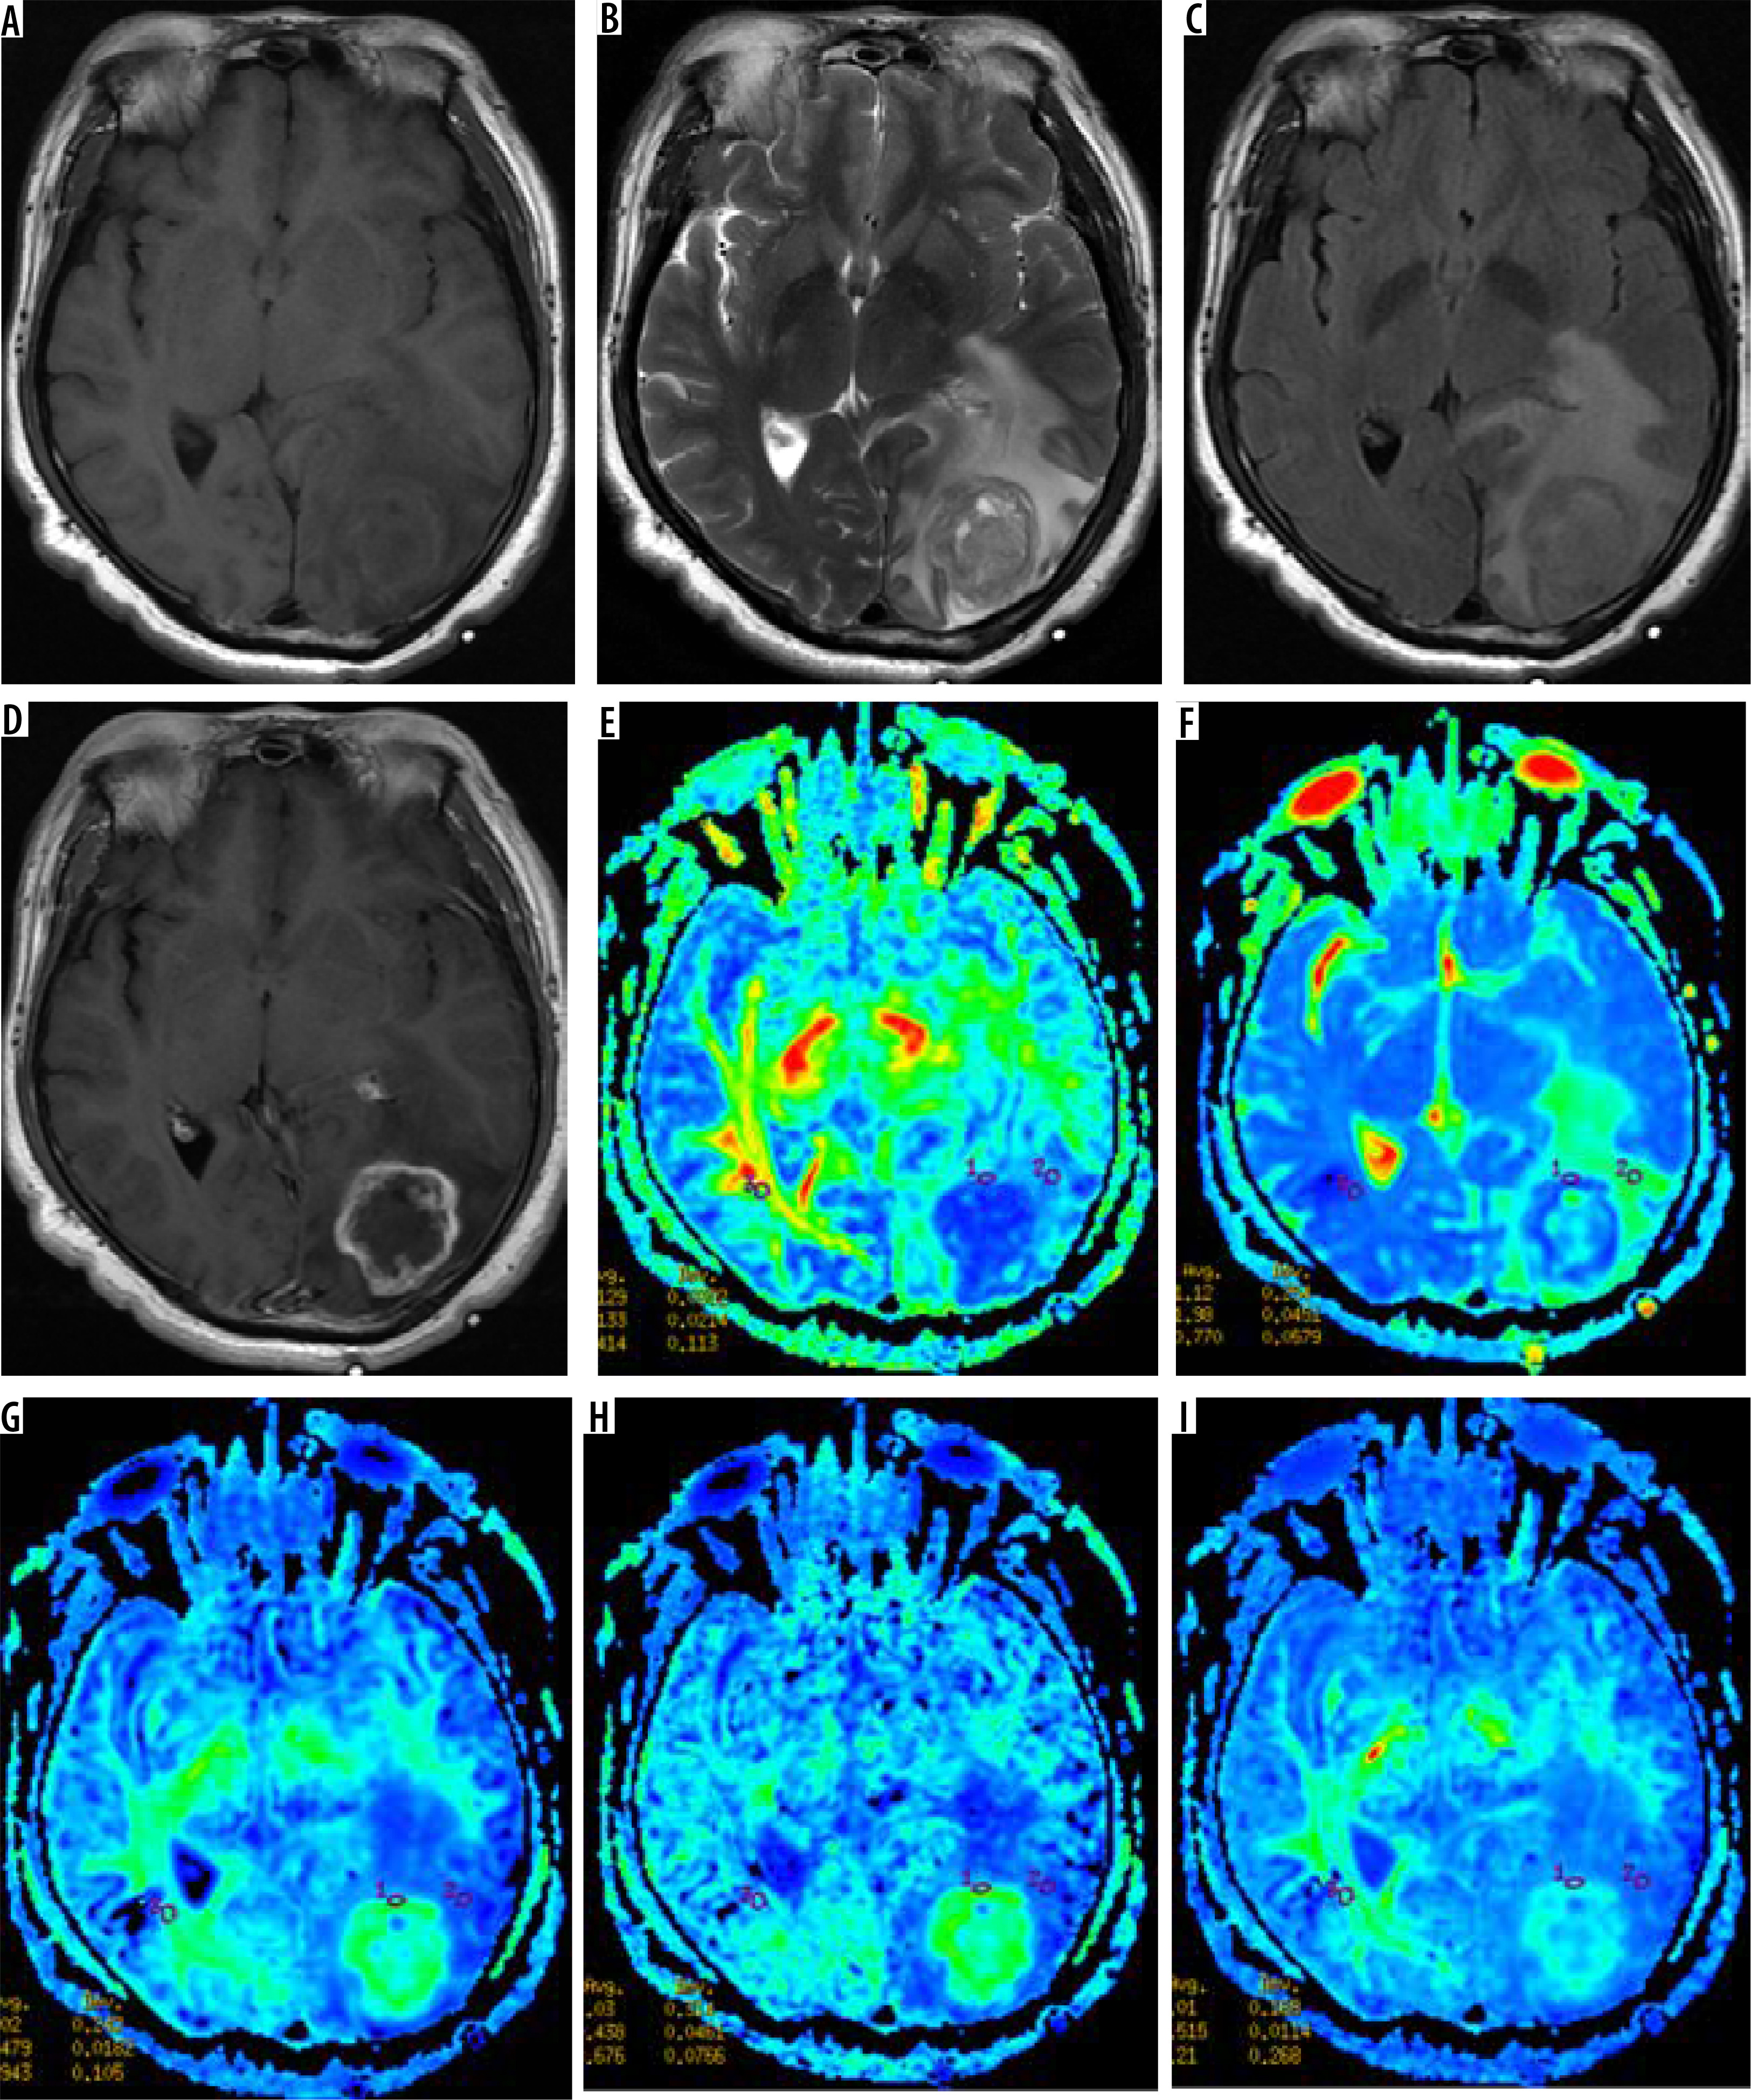
Female, 63 years old, WHO II grade astrocytoma, isocitrate dehydrogenase (IDH)-wild type, abnormal strengthening signal in the left temporal occipital lobe, multiparametric magnetic resonance (MR) images include T1WI (A), T2WI (B), T2-FLAIA (C), Gd-enhanced T1WI (D), and maps of fractional anisotropy (E), mean diffusivity (F), mean kurtosis (G), axial kurtosis (H), and radial kurtosis (I). Multiparametric MR indices were measured in regions of the tumour (1), oedema (2), and contralateral normal white matter area (3)
Statistical analysis
The obtained data were statistically analysed using SPSS 25.0. The measurement data were expressed as mean ± standard deviation (X ± S), and the normality of all the data was tested by a single-sample K-S test. After confirming that the data were normally distributed, 2 independent sample t-test were used to analyse the age, tumour parenchyma, and peritumoral oedema parameter values of the 2 groups of patients. If there were statistical differences, receiver operating characteristic curves (ROC curves) were drawn and the sensitivity and specificity were calculated. The difference was statistically significant at p < 0.05.
Results
Comparison of clinical data of patients
Among the 25 patients with glioma (23 diffuse astrocytomas and 2 oligodendrogliomas), there were 9 wild-type IDH (4 males and 5 females) and 16 mutant IDH (6 males and 10 females). There was no statistically significant gender difference between the 2 groups of cases (p = 0.53). The average age of IDH wild-type patients was 55.33 ± 12.09 years, and the average age of IDH mutant patients was 41.25 ± 11.15 years (Table 1). The age difference between the 2 was statistically significant (p = 0.007). The area under the ROC curve (AUC) was 0.82. When the cut-off point was 57.5, its sensitivity was 66.7% and its specificity was 93.7% (Table 2).
Table 1
Clinical information
Table 2
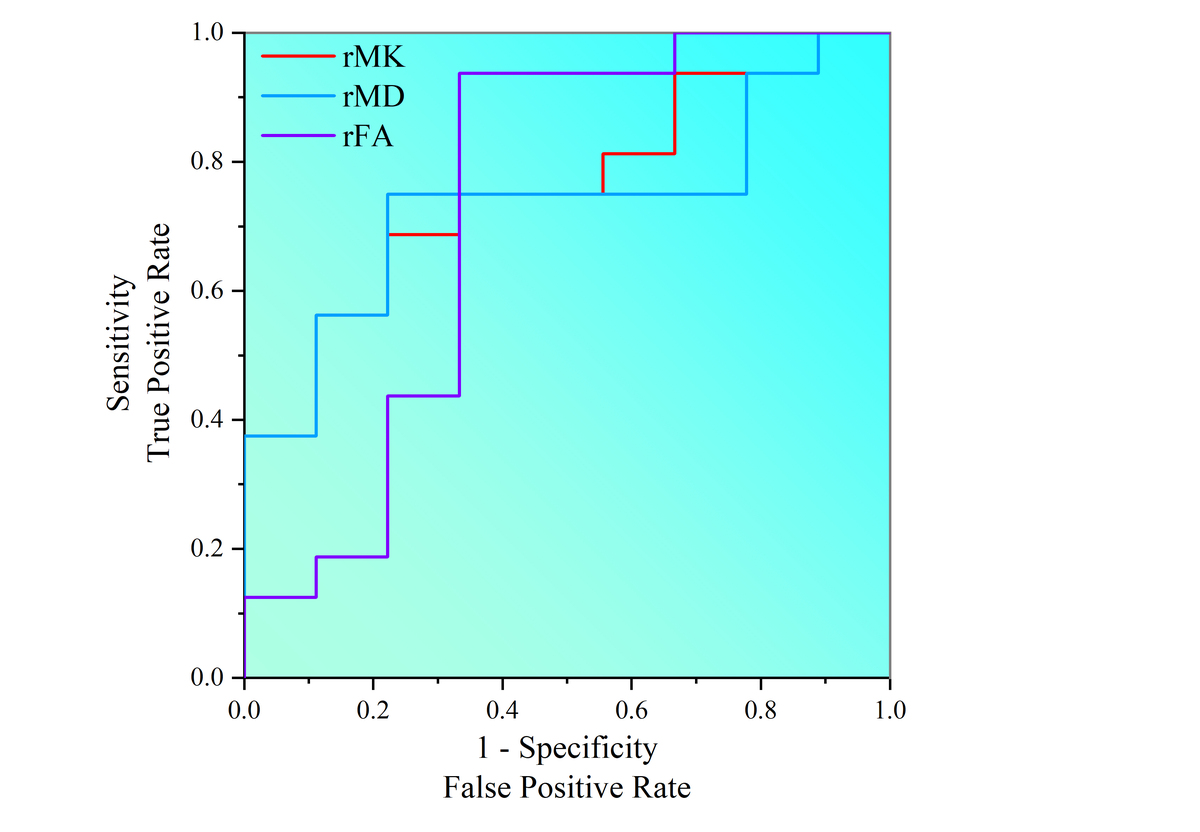
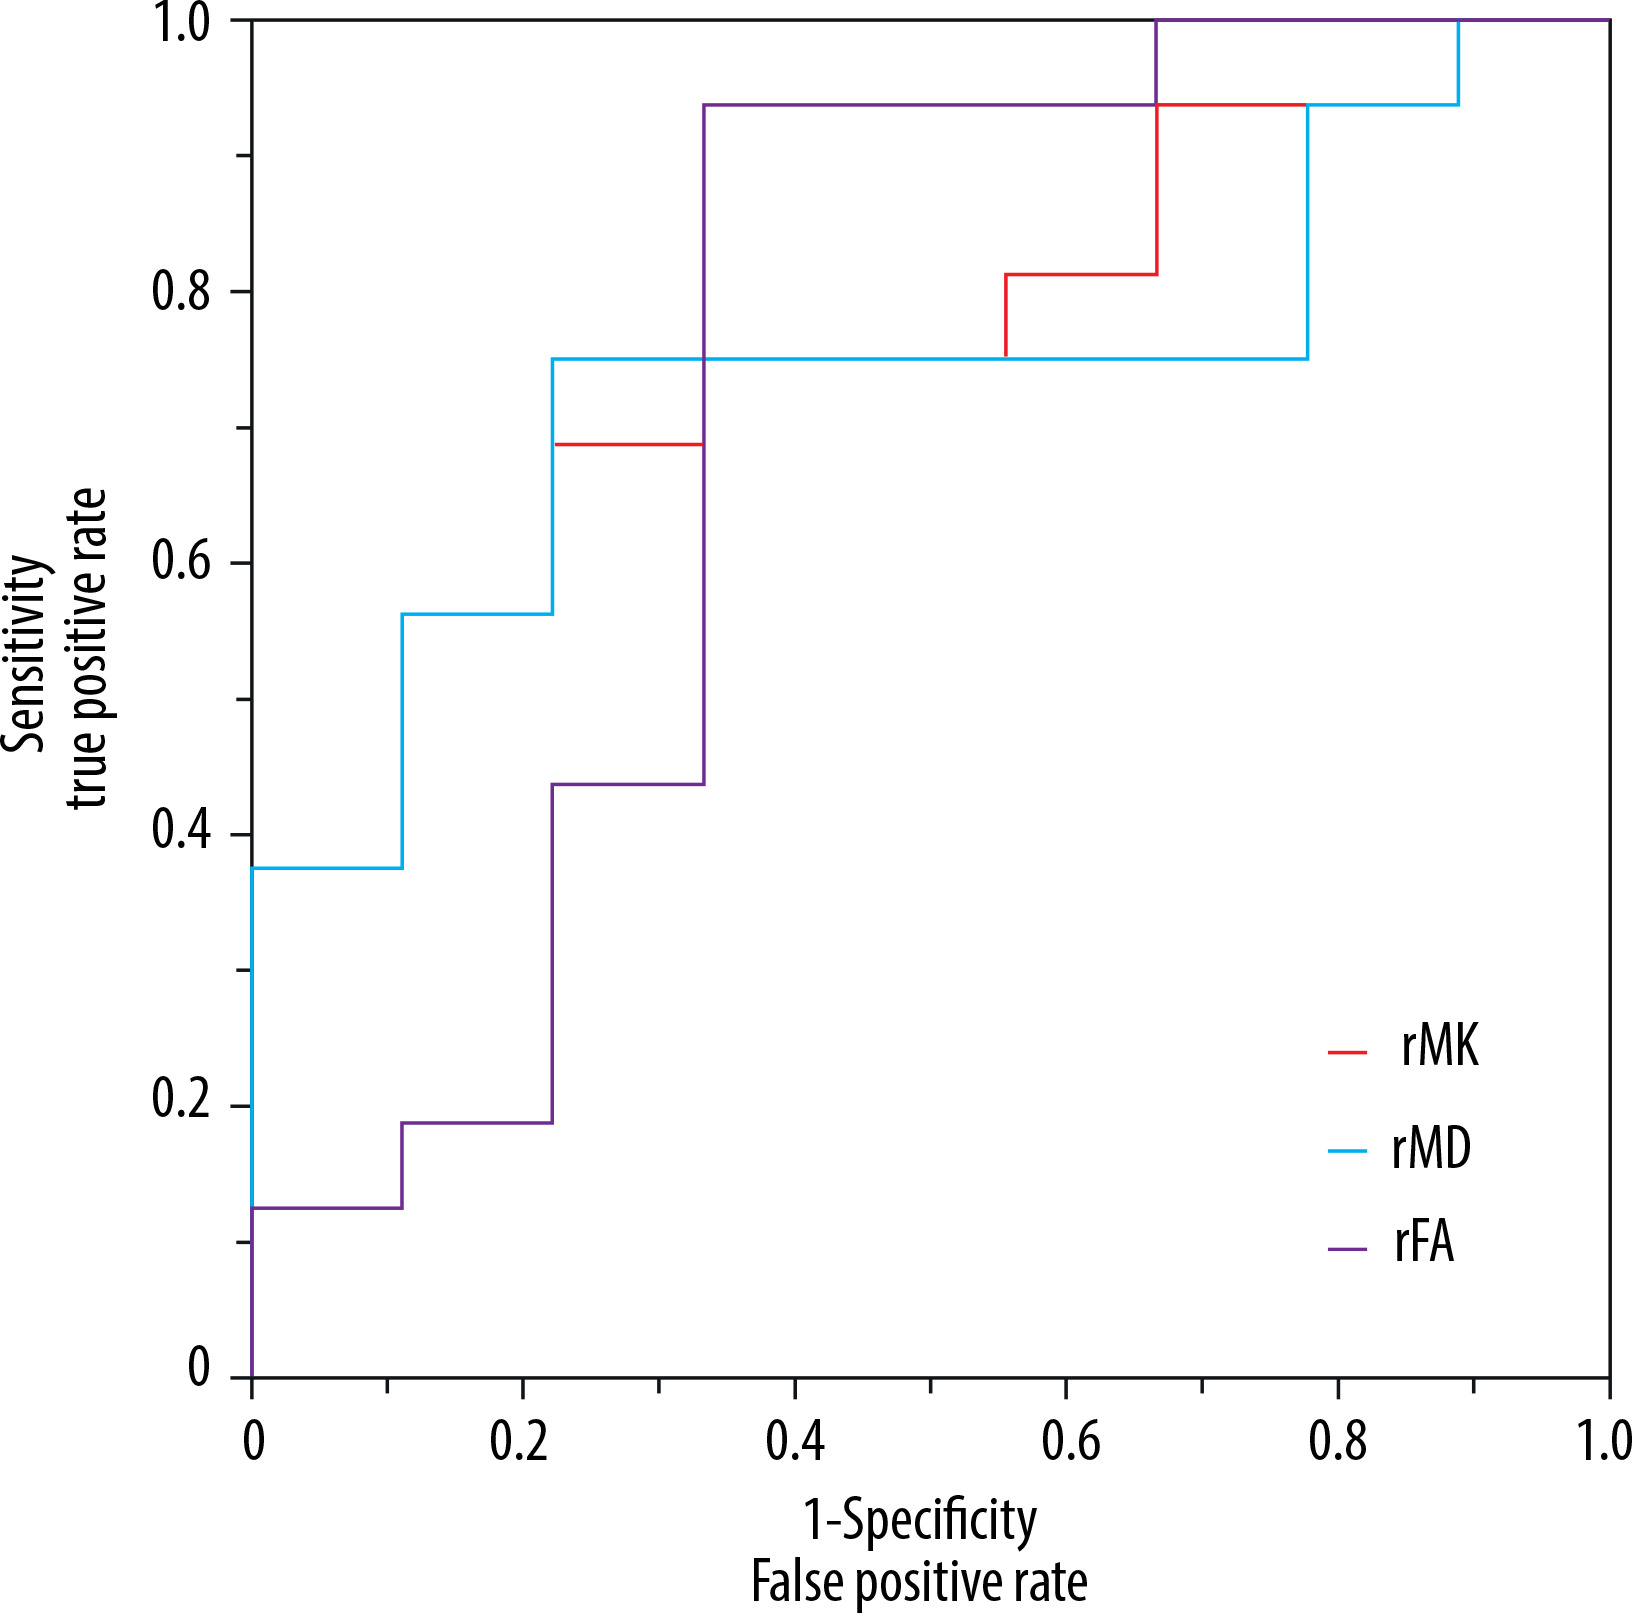
ROC curve analyses of rMD (ratio of mean diffusivity), rMK (ratio of mean kurtosis), rFA (ratio of fractional anisotropy), and age in isocitrate dehydrogenase (IDH) mutation status discrimination
| MR index | Optimal threshold | AUC | Sensitivity (%) | Specificity (%) | |
|---|---|---|---|---|---|
| IDH-mutant vs. IDH wild-type | Age | 57.5 | 0.82 | 66.70 | 93.70 |
| rMK | 0.515 | 0.757 | 77.80 | 68.70 | |
| rMD | 0.527 | 0.757 | 87.50 | 66.70 | |
| rFA | 1.261 | 0.729 | 66.70 | 93.70 |
Comparison of DKI parameters
The rFA and rMK values in the parenchymal region of IDH wild-type tumors were higher than those of IDH mutants, and the rMD value was lower than that of IDH mutants, and the difference between the two was statistically significant (p < 0.05); the values of each parameter of peritumoral oedema in the 2 groups were not statistically significant. The detailed results are listed in Table 3.
Table 3
Comparison of the DKI parameters in WHO II brain gliomas with different IDH mutation status
The area under the ROC curve of the tumour parenchymal rMK value was 75.7%; when the cut-off point was 0.515, the sensitivity was 77.8% and the specificity was 68.7%. The area under the ROC curve of tumour parenchymal rFA value was 72.9%; when the cut-off point was 0.527, the sensitivity was 66.7% and the specificity was 93.7%; and the area under the ROC curve of tumour parenchymal rMD value was 75.7%; when the cut-off point was 1.261, the sensitivity was 87.5% and the specificity was 66.7% (Figure 3, Table 2).
Discussion
Analysis of clinical data
In our study, we observed that the average age of patients with IDH mutant-type in WHO II glioma was greater than that of patients with IDH wild-type in WHO II glioma (mean age 41.25 ± 11.15 years compared to 55.33 ± 12.09 years, respectively), and notably, IDH gene mutation occured more frequently in WHO II glioma, with a mutation rate surpassing 64%. Our results were partially consistent with the findings of Aibaidula et al. [7].
Analysis of DKI parameters of glioma
Isocitrate dehydrogenase mutation status is an important factor in judging the survival and prognosis of patients with glioma [8]. Although experts have shown that conventional MRI is related to the IDH gene [9], the application value of conventional MRI is limited because various imaging signs are difficult to quantify and are easily influenced by the experience and judgment of diagnosticians and other factors [10]. In the microenvironment of human glioma, the diffusion and movement of water are not only affected by factors such as cell membrane barrier and inner and extracellular space, but also by pathophysiological changes of tumour tissue, such as tumour cell density, cell atypia, nuclear polymorphism, neovascularisation, etc., which makes the movement of water molecules show a non-Gaussian distribution [11]. DKI is based on the non-Gaussian distribution and diffusion of water molecules in biological tissues, and it shows the microstructural changes of tissues and organs through the non-Gaussian distribution model [12]. Therefore, DKI can reflect changes in tissue microstructure better than traditional conventional MRI imaging.
The study of the parenchymal region of IDH wild-type and IDH mutant-type tumours showed that the values of rMD in the parenchymal region of IDH wild-type tumours were lower than those of IDH mutant-type tumours, but the rMK and rFA were greater than those of IDH mutant-type tumours, and the value of the difference was statistically significant. Among the above indicators, the value of rMK and rMD had the largest area under the ROC curve. Our results were partially consistent with the findings of Xu et al.’s study [13].
DKI can obtain multiple parameter values, in which the MK value represents the average value of diffusion kurtosis in each gradient direction in space, which quantitatively describes the non-Gaussian distribution of water molecule diffusion inside and outside the cell, and its size depends on the complexity of tissue structure in ROI. The more complex the structure, the greater the MK value [14]. The current study showed that the microstructure of IDH-wild type glioma is relatively more complex, with high cell density, more heterogeneous tumour populations, and abundant tumour microvascular proliferation etc. [13,15]. These microstructural changes lead to a greater displacement of Gaussian distribution of water molecule movement [12].
The MD value reflected the speed of diffusion movement, representing the overall diffusion level of molecules and all existing obstacles. Previous studies have shown that the MD value can be used to assess the grading of gliomas [16]. The decrease in MD value with increasing tumour grade was thought to be associated with increased cellularity, i.e. the lower the MD value, the slower the diffusion movement and the greater the obstacles [17]. Thus, we hypothesised that the molecular diffusion movement of IDH wild-type tumours was slow, the obstacles were large, the microstructure of tumour tissue was more complex, the cell density was small, and the gap was small.
In this study the rFA value of WHO grade II IDH wild-type tumour is higher than that of IDH mutant tumour. Some studies reported greater FA values in higher grade gliomas, which was postulated to be associated with abundant blood vessels, vascular endothelial hyperplasia, and more organised tumour cells in more malignant tumours [18]. Through dynamic susceptibility contrast perfusion-weighted imaging (DSC-PWI) studies, Xing et al. [19] found that the maximum relative cerebral blood volume (rCBV) of IDH mutant WHO II and III astrocytoma tumours was significantly lower than that of IDH wild-type. Based on the results of these 2 studies, we can infer that grade WHO II IDH wild-type has more vascular distribution than IDH mutant type which may be related to the accumulation of 2-hydroxyglutaric acid (2-HG) caused by IDH mutation; the role of IDH gene mutations in glioma is still under study [4].
The results of this study showed that there was no statistically significant difference in rFA, rMD, rMK, rKa, and rKr values between WHO grade II IDH wild-type and IDH mutant-type peritumoral oedema, consistent with previous findings [20]. We think that glioma-induced blood brain barrier damage facilitates plasma water molecules and proteins to the brain parenchyma, ultimately leading to peritumoral brain oedema [21], so there is no significant difference in pathological changes of surrounding normal brain tissue between WHO grade II glioma whether IDH is wild-type or mutant-type.
There are still some shortcomings in this study. First, the number of study cases is relatively small, and we analysed WHO grade II gliomas alone but did not include other grade gliomas in this study. Secondly, the measurement of many parameters involved in the research process is easily influenced by the empirical judgment of the measurer. Perhaps it is insufficient to explore IDH genotyping through DKI imaging alone, and it is necessary to further comprehensively utilise other MRI techniques and even imaging omics analysis to explore IDH mutation status for preoperative non-invasive prediction of glioma.