Introduction
Chronic liver disease occurs as a result of hepatic tissue damage and long-term fibrosis caused by various factors such as viral infection, alcohol and drug use, fatty liver, and autoimmune or metabolic diseases. The most common aetiology is metabolic dysfunction-associated steatotic liver disease in developed countries, while viral hepatitis is the most common cause in developing countries. In chronic hepatitis B virus (HBV) and hepatitis C virus (HCV) infections, the main complications are fibrosis and cirrhosis [1].
Hepatic fibrosis was previously believed to be irreversible, but recently it has been accepted as a dynamic process that has regression potential with early and appropriate treatment [2]. The focus of treatment in chronic hepatitis is to reduce viral replication, hepatic inflammation, and fibrosis. Thereby, the risk of cirrhosis and hepatocellular cancer decreases. Early detection of hepatic fibrosis enables the initiation of antiviral therapy, which reduces hepatic decompensation and prolongs life expectancy [3]. Liver biopsy is the gold standard in the diagnosis of hepatic fibrosis. However, biopsy is an invasive method with risk of complication, especially in advanced disease with ascites and coagulopathy. Additionally, insufficient biopsy material and interobserver evaluation differences can cause diagnostic errors [3]. Therefore, alternative noninvasive methods have been developed such as serum biomarkers (hyaluronic acid, procollagen, a2-macroglobulin, apoprotein A-1, and laminin) and imaging methods for evaluation of liver fibrosis [4]. In the noninvasive assessment of liver fibrosis, both ultrasound (US)-based elastography and magnetic resonance imaging (MRI) techniques like intravoxel incoherent motion diffusion-weighted imaging (IVIM-DWI) are utilised. US elastography, including transient elastography, measures liver stiffness by evaluating shear wave propagation, offering rapid and bedside assessments. However, its accuracy can be compromised in patients with obesity, ascites, or narrow intercostal spaces, and it may be less effective in detecting early fibrosis stages [5].
DWI is a noninvasive MRI sequence that shows the movement of intercellular water molecules in the tissue. Increased cellularity or injury of cell membrane restricts diffusion of water. The apparent diffusion coefficient (ADC) shows the diffusion rate by assuming that water molecule diffusion is a random process and estimating the chance of molecular diffusion from one location to another within a determined interval [6,7].
However, diffusion measured in biological tissues cannot always be explained by this simple model. IVIM was conducted to describe the microscopic movement of water molecules within a voxel. If gradients are strong enough with high b-values, IVIM-induced signal loss is primarily due to diffusion (Brownian movement of water molecules in and around cells). At low b-values, capillary microcirculation is the second IVIM mechanism contributing to signal loss [8]. IVIM is a DWI-based method in which signal distortion at multiple b-values is analysed to evaluate both intercellular fluid movement and microcapillary perfusion [9]. In IVIM, the true diffusion coefficient, pseudo-diffusion coefficient, and perfusion fraction are represented by D, D*, and f, respectively. The percentage of a voxel occupied by capillaries indicates f whereas 1 – f reflects only extravascular space diffusion. D* reflects the phase difference due to perfusion in semi-randomly organised capillaries [8,9]. D* and f are associated with blood perfusion while D represents pure water diffusion.
The literature has inconsistent results about the role of IVIM-DWI in the grading of hepatic fibrosis [10]. Therefore, in this study we aimed to examine the diagnostic efficacy of parameters obtained by the noninvasive method of IVIM-DWI (D, D*, f, and ADC values) in the detection and staging of liver fibrosis in hepatitis B patients.
Material and methods
Patients
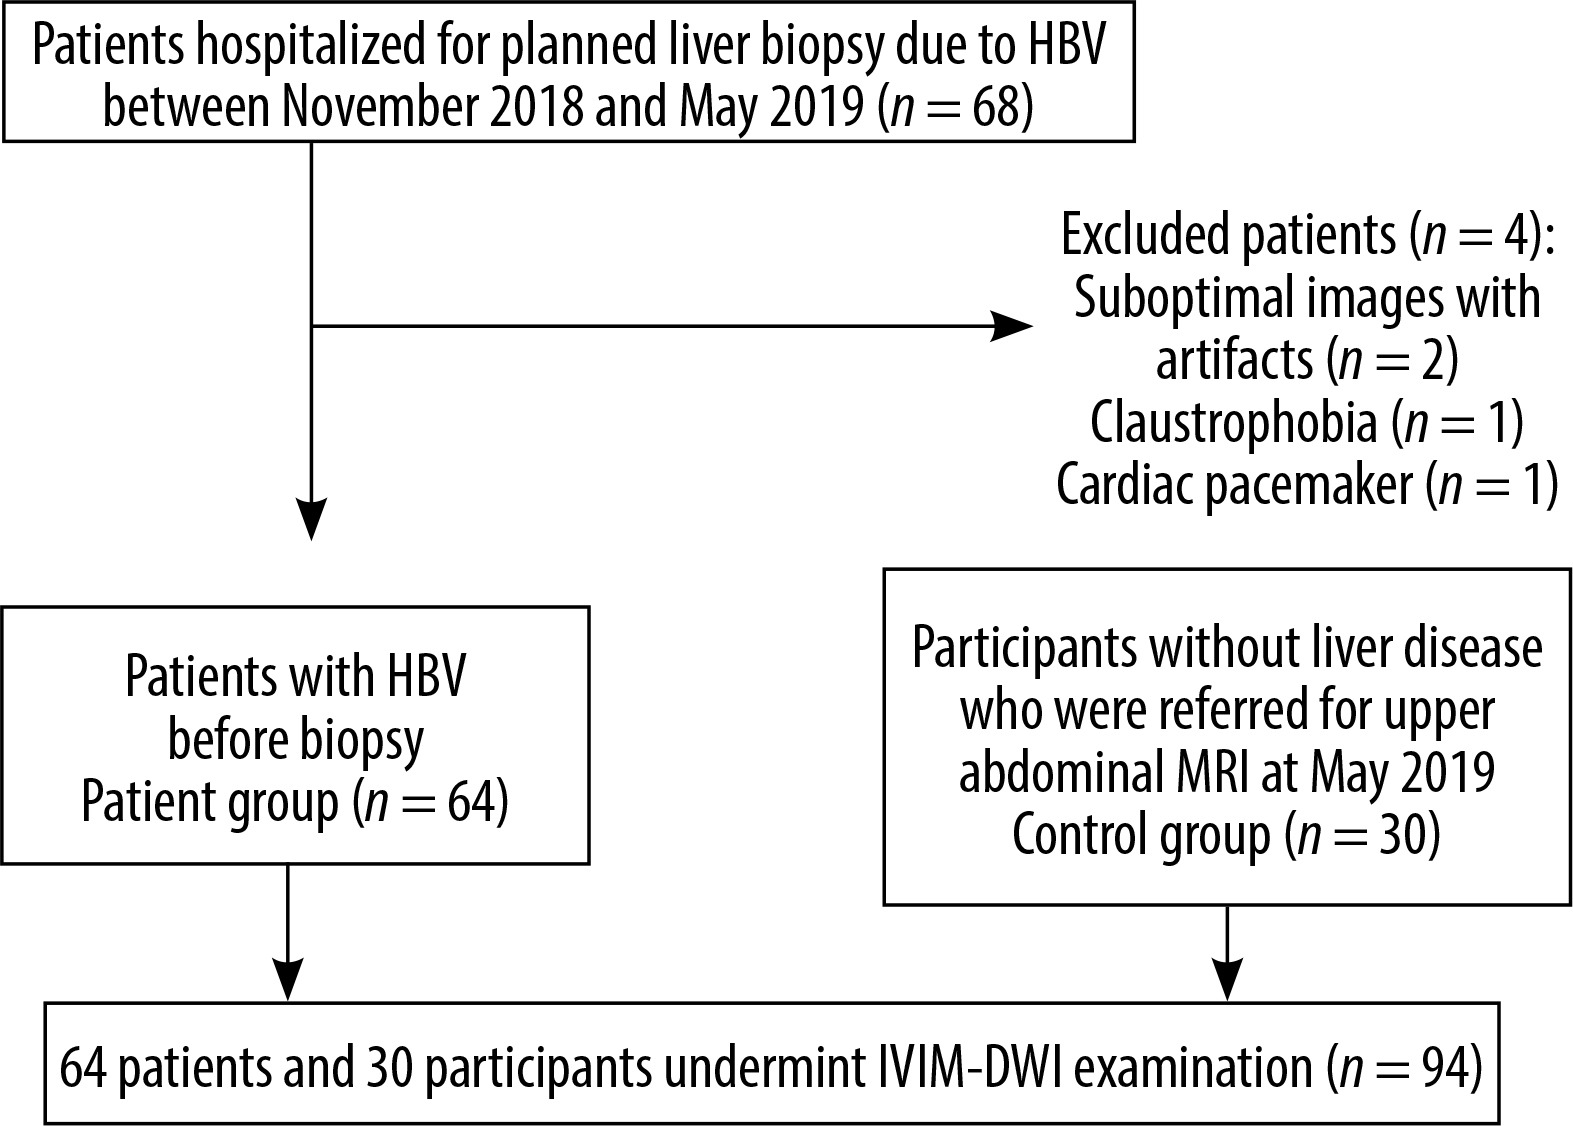
This prospective study protocol was approved by the institutional Ethics Committee. Informed written consent was obtained from each of the participants. Among the 98 consecutive patients who were hospitalised in the Department of Gastroenterology for planned liver biopsy between November 2018 and May 2019, 68 who underwent biopsy due to hepatitis B were included in the study. For these 68 consecutive patients, an MRI scan was prospectively planned to be performed on the morning before the biopsy. Exclusion criteria for the study were the presence of a large liver mass, as well as patients who did not cooperate sufficiently during the examination (n = 2), patients with claustrophobia (n = 1), and patients with contraindications for MRI (pacemaker, prosthesis incompatible with MRI) (n = 1). The patient group consisted of 64 patients who underwent MRI and IVIM-DWI examinations before liver biopsy. In May 2019, prospective IVIM-DWI sequences were added to routine sequences in all patients who were referred for upper abdominal MRI. Among these, a control group was formed of 30 consecutive participants without chronic liver disease. The flowchart of patient and control groups is shown in Figure 1.
MRI and IVIM-DWI technique
To avoid MRI artifacts and measurement differences that may occur after biopsy, the patients underwent upper abdominal IVIM-DWI scan 2 to 4 hours before the liver biopsy procedure. All participants underwent MRI examination with a 1.5-Tesla MRI system (Optima MR450w, GE Healthcare, Milwaukee, USA).
The imaging protocol used the following sequences consisting of coronal T2-weighted single-shot fast spin-echo (SS-FSE) (FOV: 400 mm, slice thickness: 8 mm, slice gap: 1 mm, TE: 80 ms, matrix: 320 × 224), axial T2-weighted SS-FSE (FOV: 410 mm, slice thickness: 6 mm, slice gap: 1 mm, TE: 90 ms, TR: 685 ms, matrix: 320 × 224), and axial fat-suppressed T2-weighted SS-FSE (FOV: 410 mm, slice thickness: 6 mm, slice gap: 1 mm, TE: 90 ms, matrix: 320 × 224) sequences and IVIM-DWI (FOV: 410 mm, slice thickness: 5 mm, slice gap: 1 mm, TE: 78 ms, TR: 4000 ms, matrix: 80 × 128) sequences. Total scan time was approximately 5 minutes. IVIM-DWI acquisition was performed in the axial plane by applying diffusion-sensitive gradients in all 3 directions (x, y, z) using a breath-hold single-shot turbo spin-echo echo-planar imaging (SS-TSE-EPI) sequence at 11 different b-values (15, 30, 50, 75, 100, 150, 200, 400, 600, 800, and 1000 s/mm2). Isotropic images consisted of ‘trace’ images obtained by multiplying the signal intensities measured in x, y, and z directions to eliminate direction-dependent signal changes. ADC maps of isotropic images were created automatically.
Histopathological evaluation
In this study, histopathological examination was accepted as the reference standard for determining the presence of hepatic fibrosis and inflammation. Informed consent in the study group was obtained before liver biopsy. US-guided percutaneous biopsies were performed in the right lobe of liver under local anaesthesia using a 16- or 18-gauge needle in the department of radiology. The tissue samples were sent to the pathology laboratory in 10% formalin. Masson’s trichrome, Sweet’s reticulin, and Orcein staining was performed to evaluate fibrosis in the biopsy specimens. To ensure standardisation, all patients’ biopsy materials were evaluated by one experienced pathologist. Fibrosis stage (F0-6) and histological activity index (HAI) (0-18) can be determined by using the Ishak modified scoring system [11]. The histopathological results were classified into 4 categories according to Ishak fibrosis stage: non-fibrosis (F0), mild fibrosis (F1), moderate fibrosis (F2-3), and advanced fibrosis and cirrhosis (F4-6).
Radiological evaluation
The MRI and DWI findings were evaluated by 2 radiologists in consensus, who were blinded to the histopathological results. Evaluation and measurements were performed using a workstation (AW Volume Share 7, GE Healthcare, Milwaukee, USA), and IVIM data were processed using IVIM* (GE Healthcare, Milwaukee, USA) software.
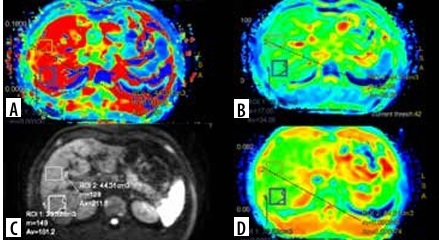
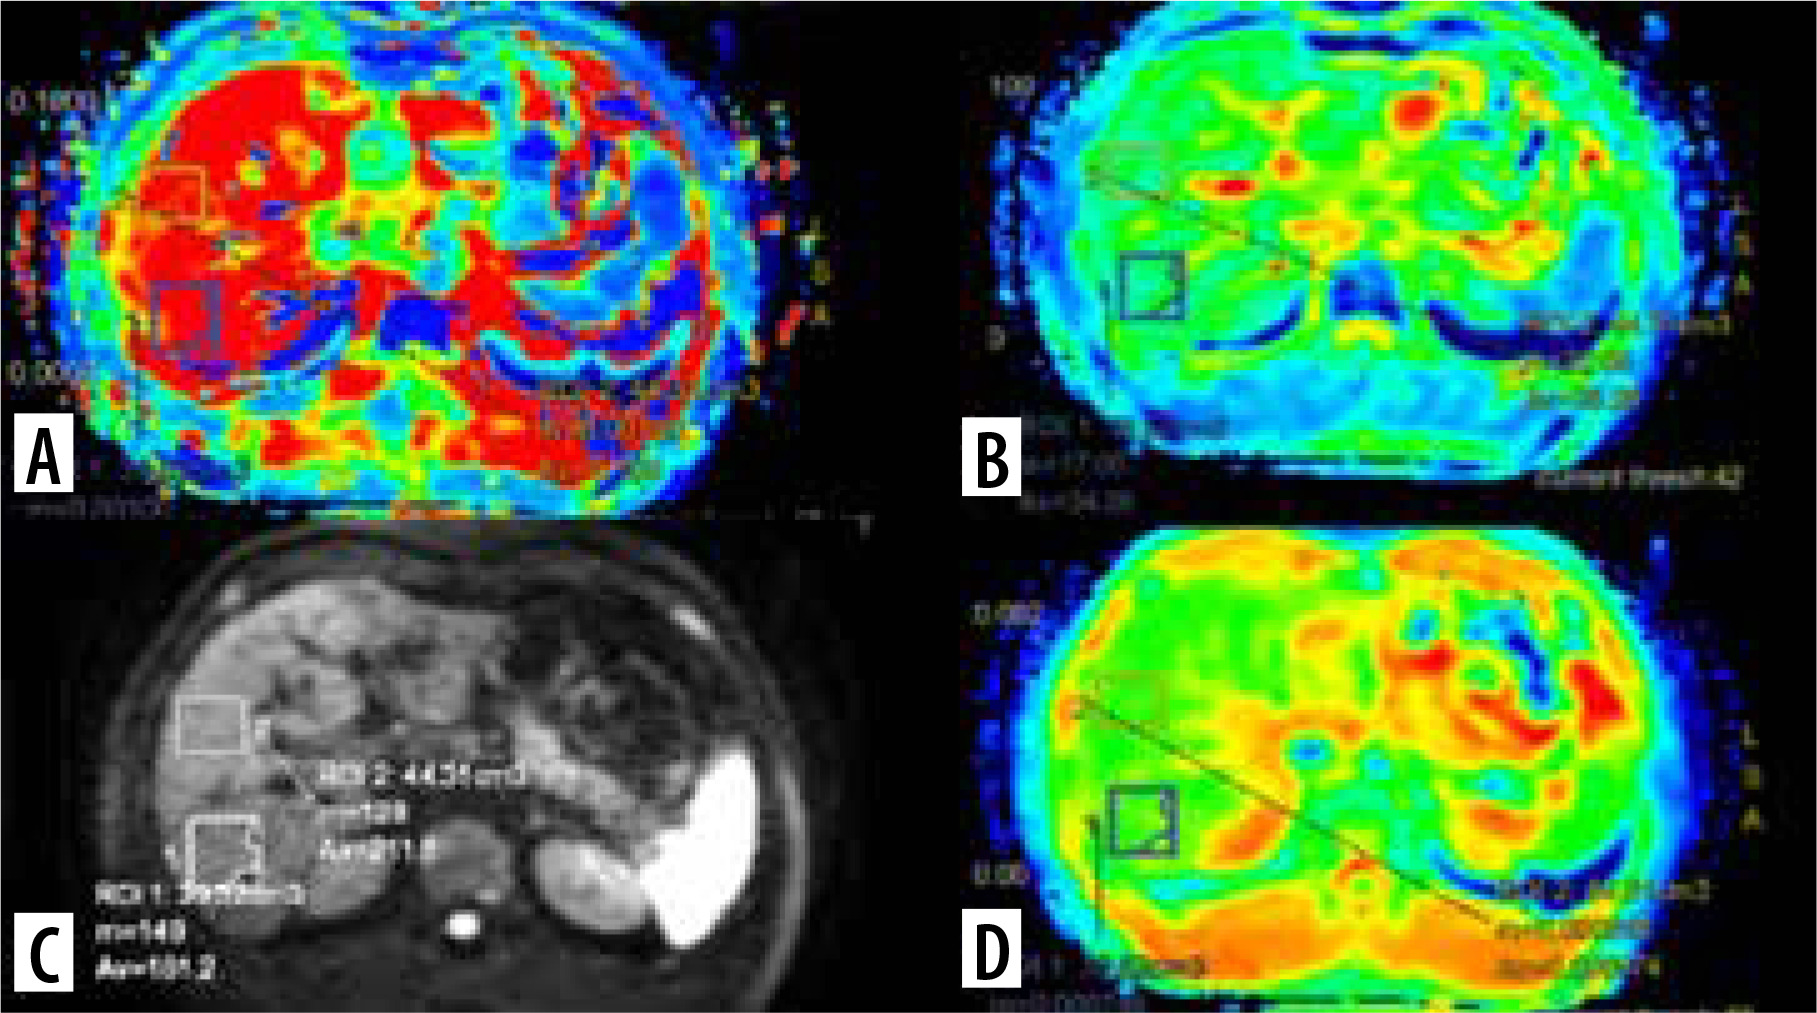
In DWI, the volume of interest (VOI) ranged from 30 to 60 cm3 measured in the right lobe of the liver. Two VOIs were measured at segment 7 and 8 with exclusion of ribs, abdominal wall, intrahepatic vascular structures, and prominent artifacts. The average of these 2 VOIs was estimated. The left lobe of the liver was not preferred for measurement because of cardiac and motion artifacts. D, D*, f, and ADC values were calculated from each measurement. The VOI measurements in the map image of axial D, D*, f, and ADC parameters in a patient with chronic hepatitis B are shown in Figure 2.
Statistical analysis
Statistical analyses were conducted using the NCSS (Number Cruncher Statistical System) 2007 software (Kaysville, Utah, USA). Descriptive statistical methods (mean, standard deviation, median, frequency, ratio, minimum, maximum) were employed to evaluate the study data, and the distribution of the data was assessed using the Shapiro-Wilk Test. The Mann-Whitney U test and Kruskal-Wallis test were used to compare quantitative data between groups. Receiver operating characteristic (ROC) analysis was performed to identify the predictive values. The level p < 0.05 was accepted as statistically significant.
Results
A total of 94 (64 in the patient group and 30 in the control group) MRI and IVIM-DWI scans were evaluated in this study. Of the 64 from the patient group, 38 were in the subgroup F0-1, 19 were in subgroup F2-3, and 7 were in subgroup F4-6. Among the participants, 54% (n = 51) were women and 46% (n = 43) were men. The mean age was 45.44 ± 13.07 years, ranging from 18 to 79 years. There was no significant difference in the age distribution between the patient and control groups (p > 0.05).
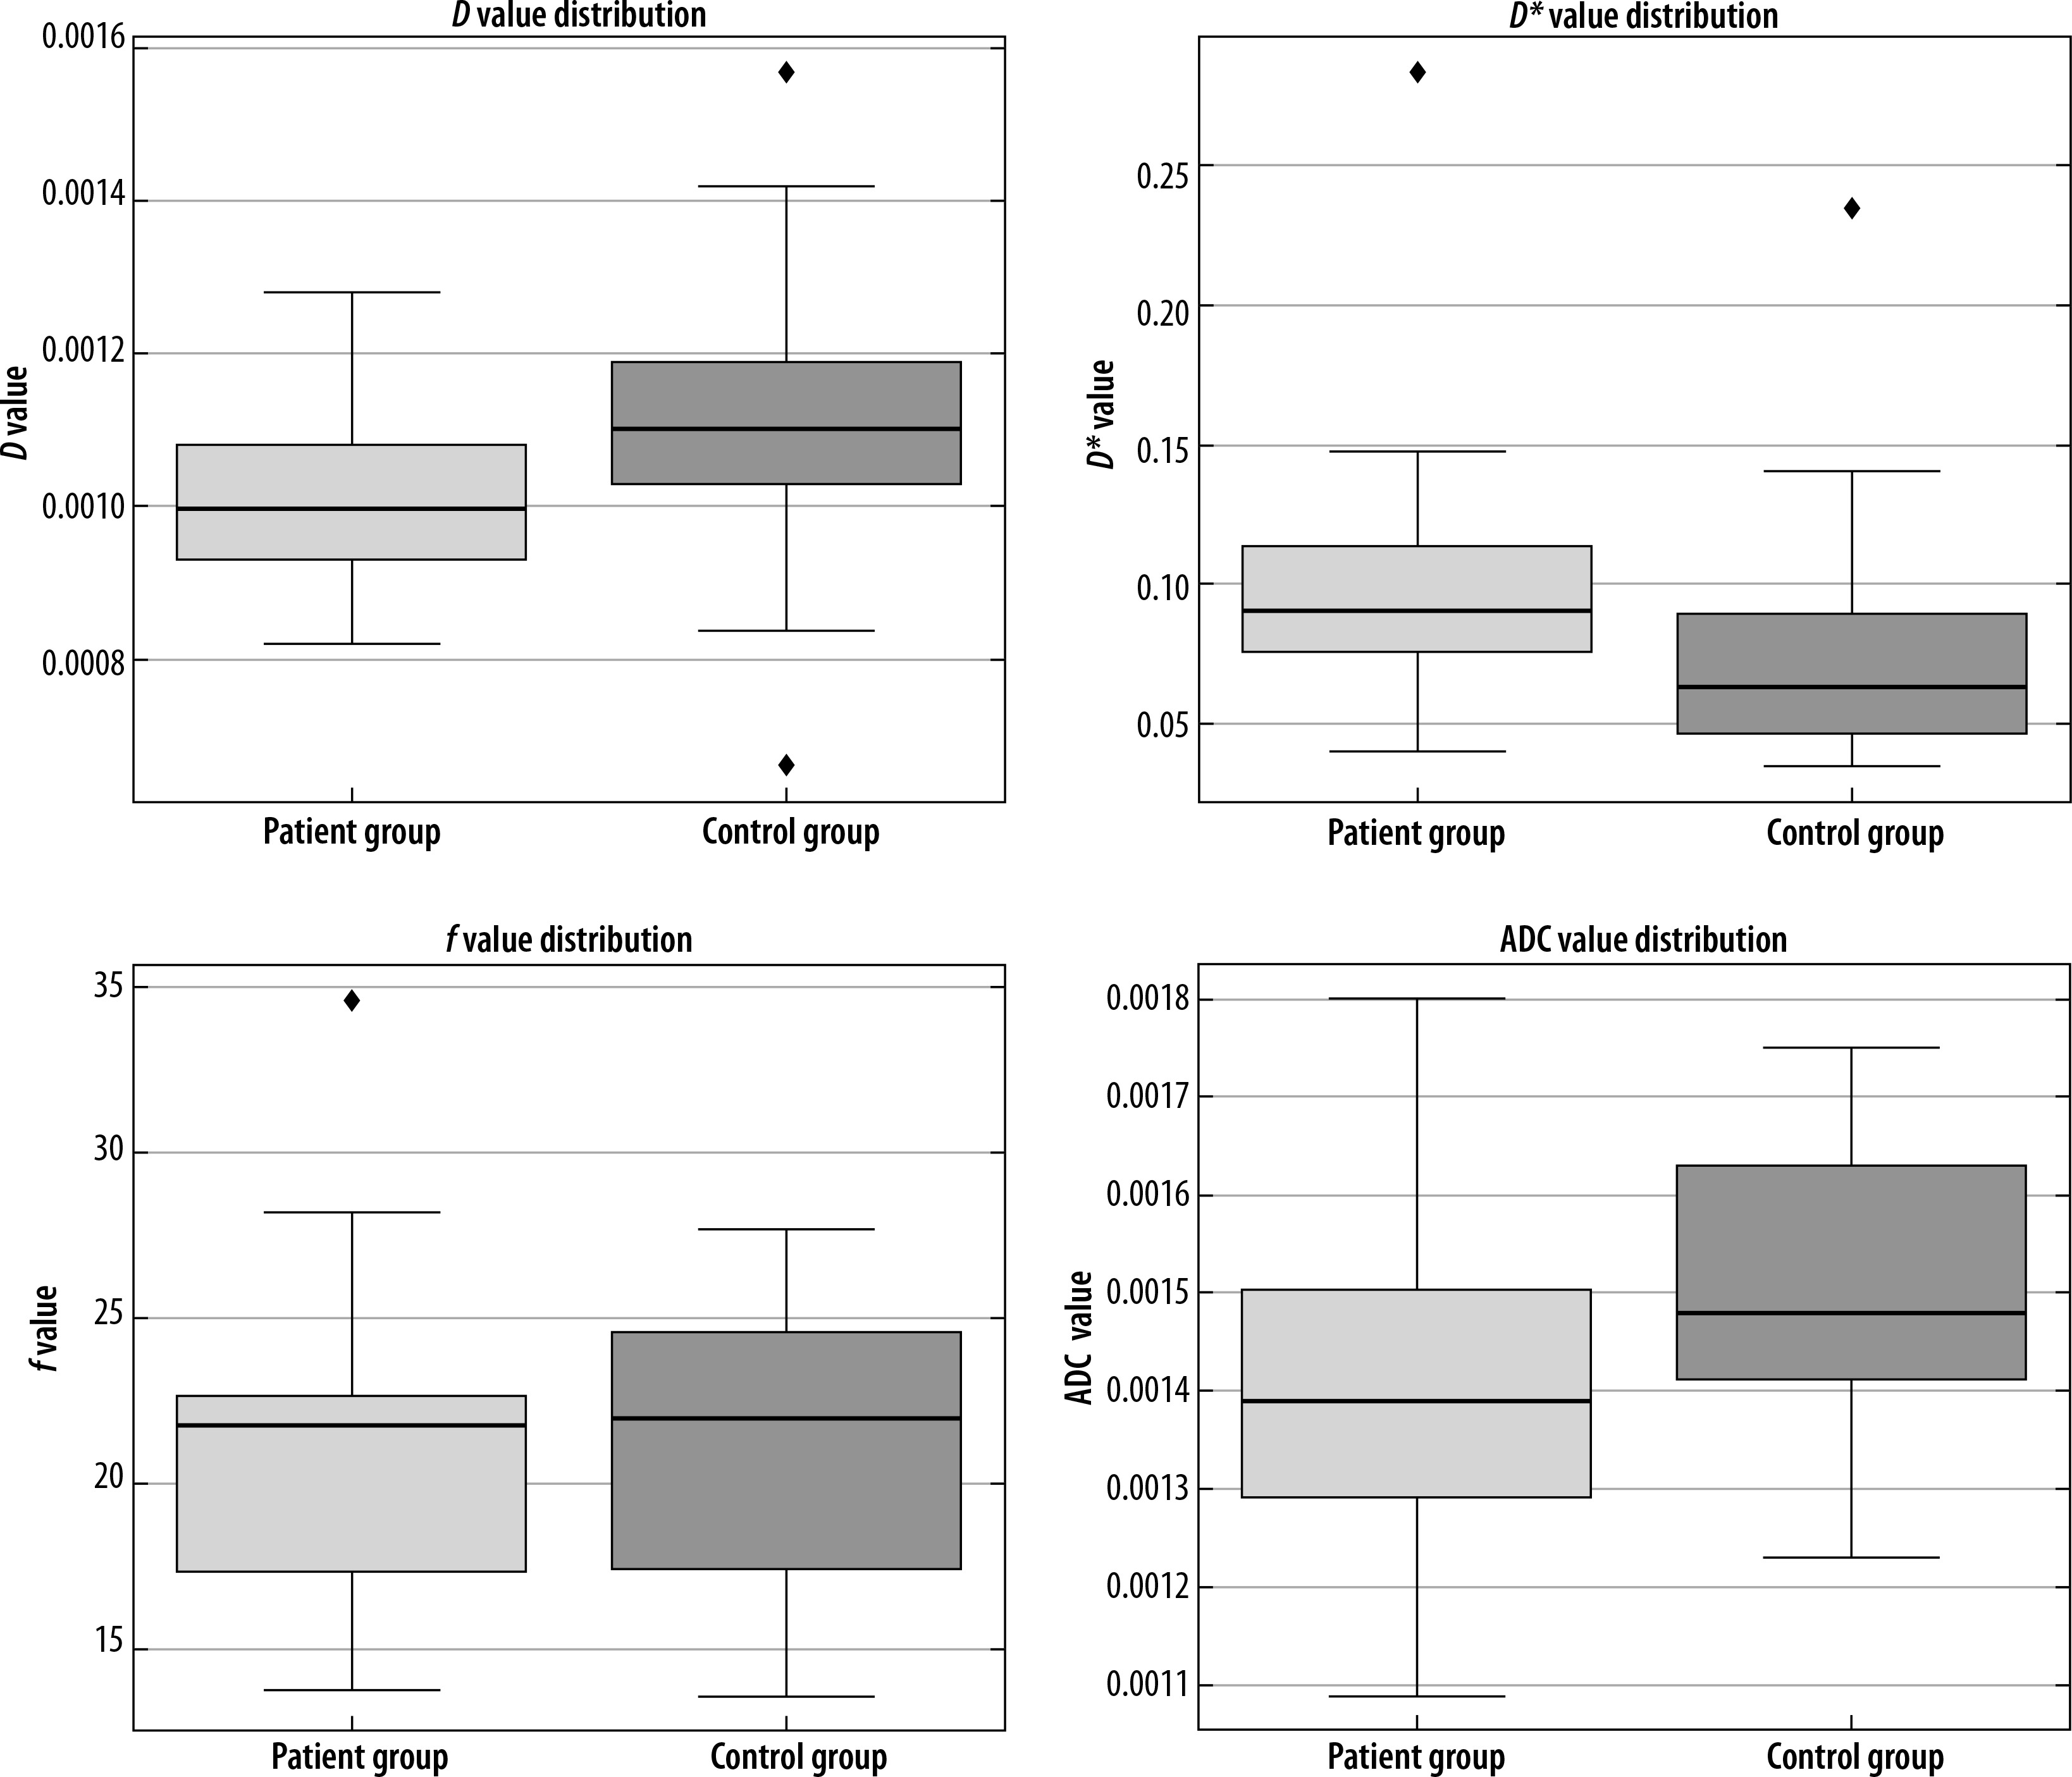
Initially, in the analysis between the patient and control groups, the D value was found to be significantly lower (p = 0.001; p < 0.05) whereas the D* value was significantly higher in the patient group than in the control group’s (p = 0.001; p < 0.05) (Figure 3). No statistically significant difference in the f value was found between the 2 groups (p > 0.05). Additionally, the ADC value in the patient group was significantly lower compared to the control group (p = 0.001; p < 0.05). Significant differences were found for D, ADC, and D*, but no significant difference was observed for the f parameter (Table 1).
Table 1
Statistical comparison of intravoxel incoherent motion diffusion-weighted imaging (IVIM-DWI) parameters (D, ADC, D*, and f) between the control and patient groups
| IVIM-DWI parameters | Groups | Number of participants | Mean ± SD | p-value |
|---|---|---|---|---|
| D (× 10–3 mm2/sn) | Patient | 64 | 1.10 ± 0.11 | 0.008* |
| Control | 30 | 1.20 ± 0.26 | ||
| D* (× 10–3 mm2/sn) | Patient | 64 | 96.50 ± 35.91 | 0.001* |
| Control | 30 | 72.00 ± 41.11 | ||
| f | Patient | 64 | 19.67 ± 5.20 | 0.238 |
| Control | 30 | 20.80 ± 4.32 | ||
| ADC (× 10–3 mm2/sn) | Patient | 64 | 1.40 ± 0.16 | 0.004* |
| Control | 30 | 1.50 ± 1.60 |
Figure 3
Boxplots showing the distribution of the parameters D, D*, f, and ADC between the patient and control groups
When conducting ROC analysis for establishing cut-off values in the differentiation of patient and control groups, the highest sensitivity (78.1%) and specificity (73.3%) was found for D* with a cut-off value of 1.4 × 10⁻³ mm2/s. The results of ROC analysis are shown in Table 2.
Table 2
Results of receiver operating characteristic (ROC) analysis of intravoxel incoherent motion parameters in the differentiation of the patient group from the control group
| Parameters | Sensitivity (%) | Specificity (%) | Cut-off value | Area under the curve (AUC) |
|---|---|---|---|---|
| D (× 10–3 mm2/sn) | 63.3 | 73.4 | 1.1 | 0.671 |
| D* (× 10–3 mm2/sn) | 78.1 | 73.3 | 71.5 | 0.751 |
| ADC (× 10–3 mm2/sn) | 80 | 53.1 | 1.4 | 0.687 |
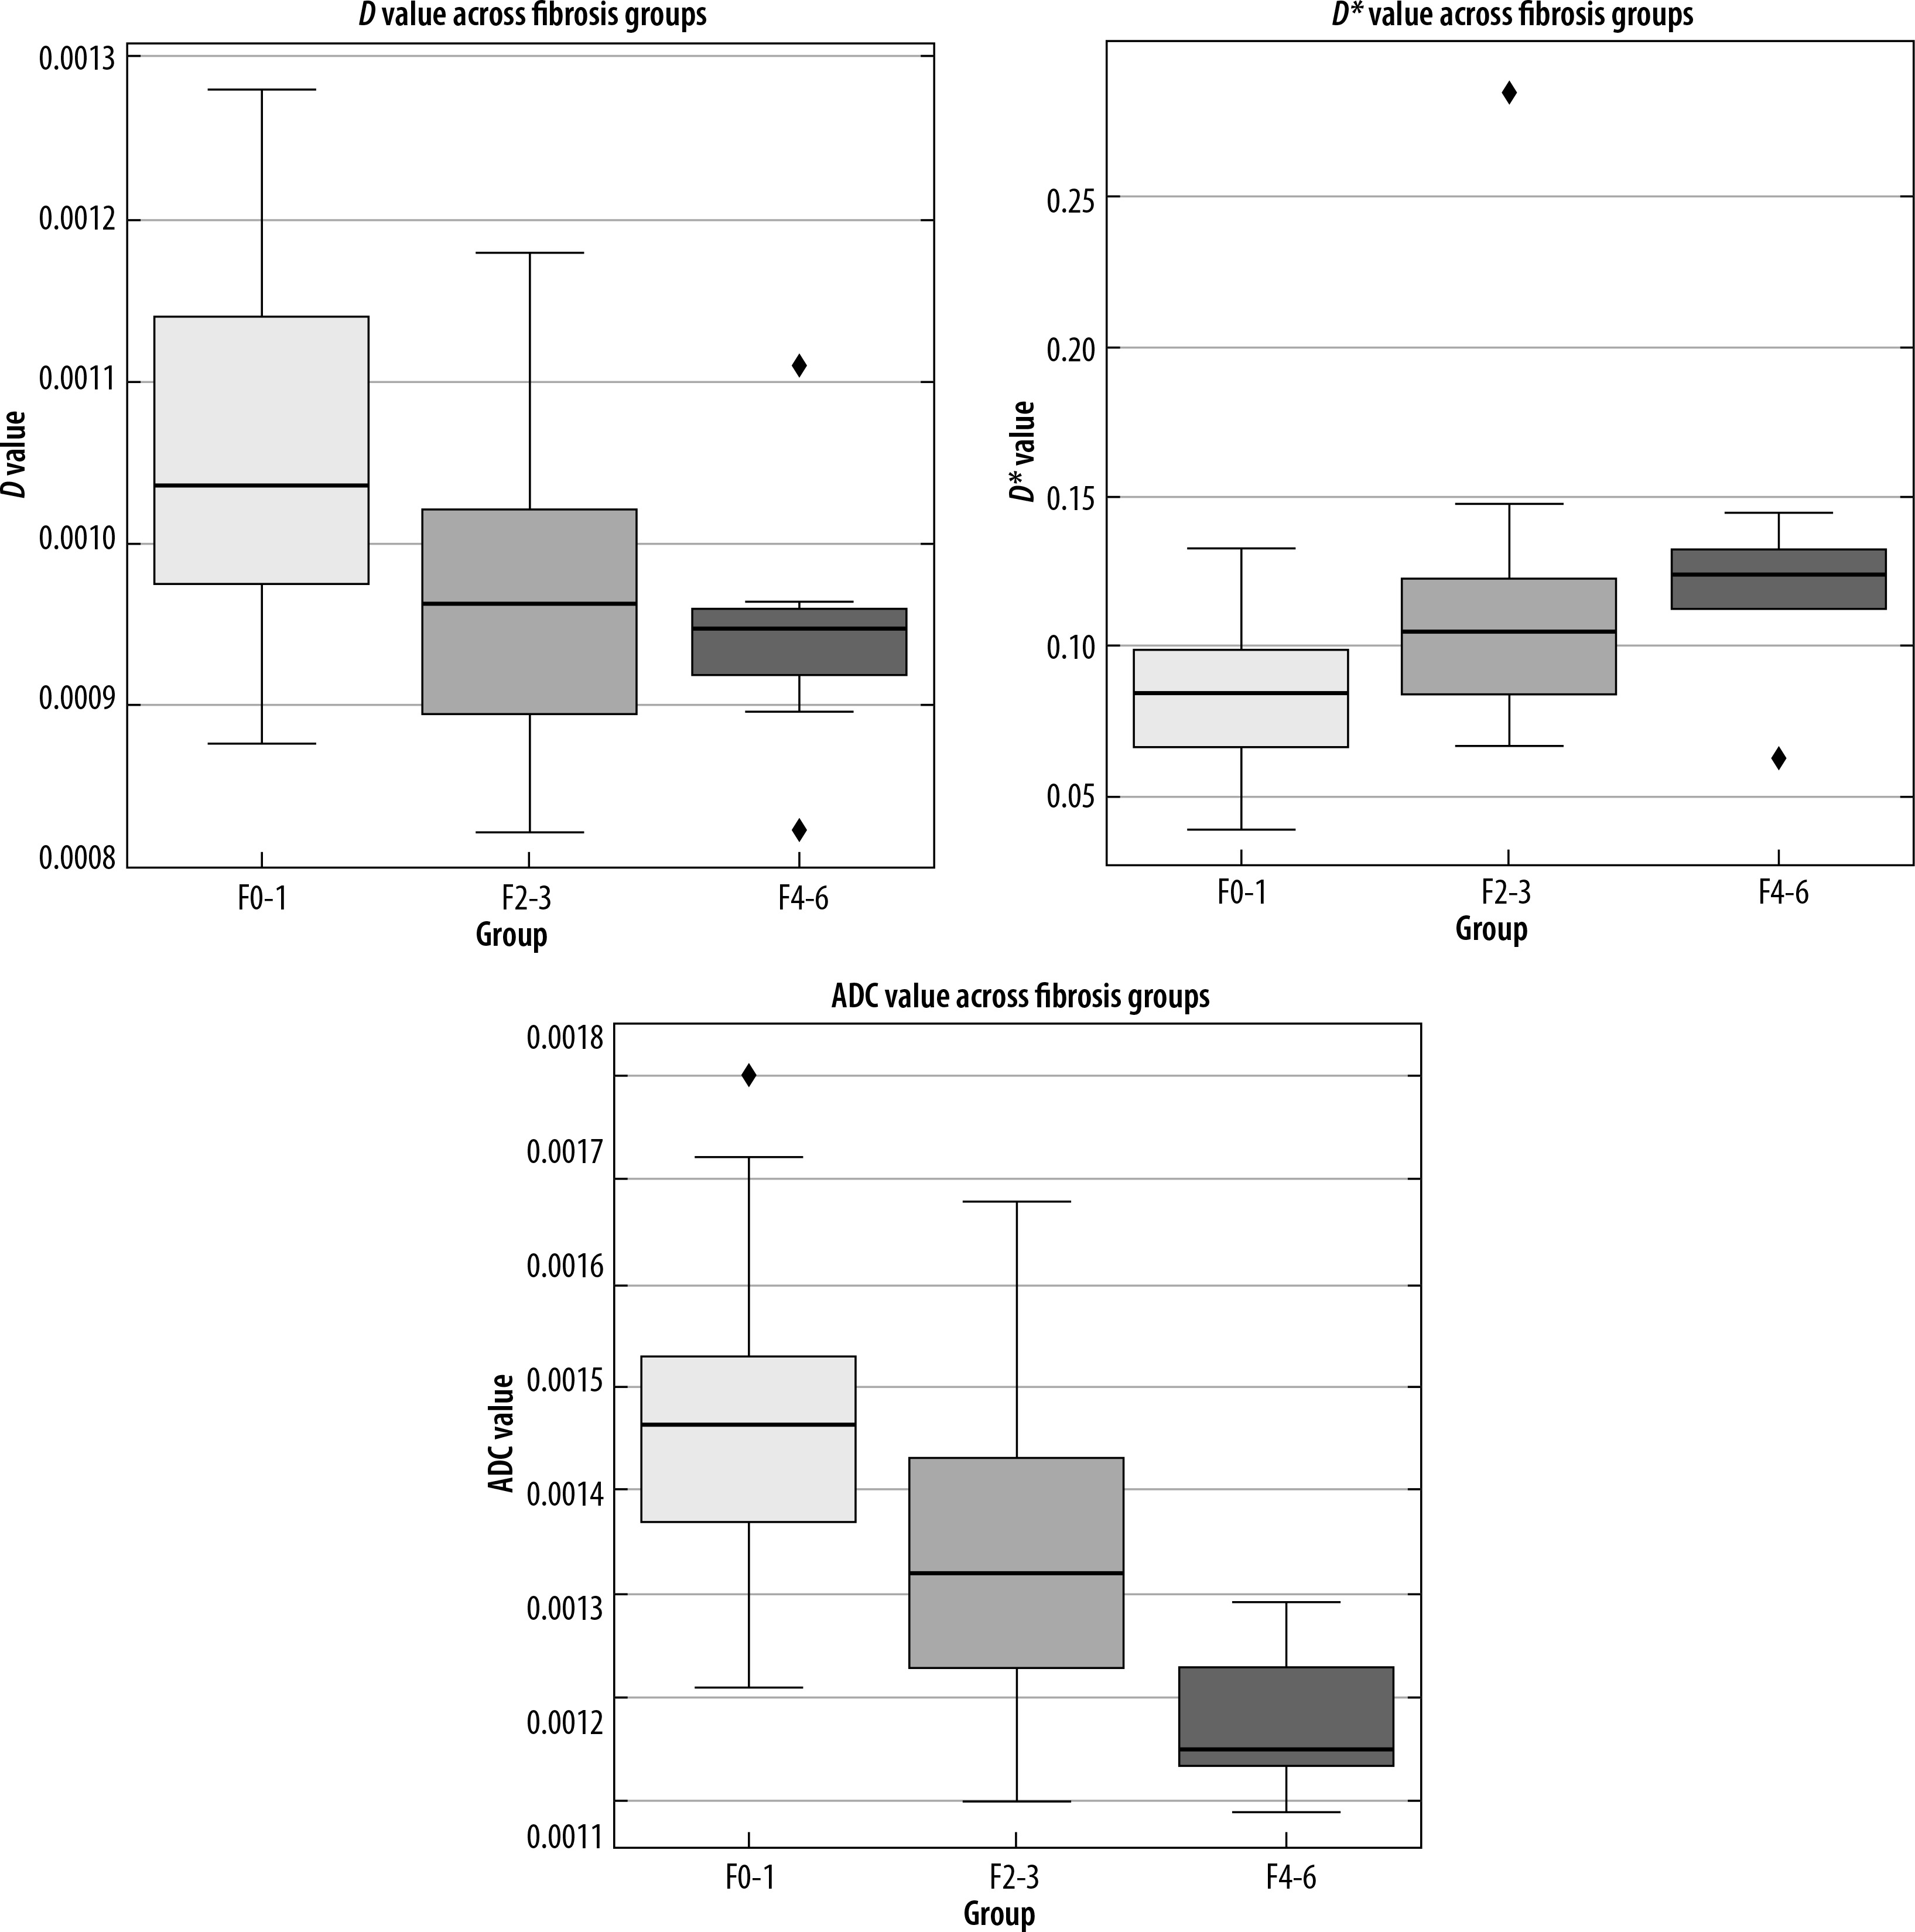
When comparing patient subgroups based on fibrosis stage, a significant difference in D values was observed between the F0-1 and F2-3 groups (p < 0.05). The ADC value was only statistically significant between the F0-1 and F4-6 groups (p < 0.05), but it was lower in the F2-3 and F4-6 groups. The ADC value decreased with increasing fibrosis stage. The D* value was significantly different between the F0-1 and F2-3 group (p < 0.05), but no significant differences were detected between the other subgroups (p > 0.05) (Figure 4).
Figure 4
Boxplots displaying the differences in the D, D*, and ADC parameters among the fibrosis groups (F0-1, F2-3, F4-6)
Due to our limited number of patients, we also divided them into 2 groups: F < 2 group, consisting of F0 and F1, and F<2 group, comprising F2-3 and F4-6. The D, f, and ADC values were higher and the D* value was significantly lower in the F < 2 group compared to the F < 2 group (p = 0.001; p < 0.05) (Table 3).
Table 3
Statistical comparison of intravoxel incoherent motion diffusion-weighted imaging (IVIM-DWI) parameters (D, ADC, D*, and f) between the F < 2 and F ≥ 2 groups
| IVIM-DWI parameters | Groups | Number of patients | Mean ± SD | p-value |
|---|---|---|---|---|
| D (× 10–3 mm2/sn) | F < 2 | 38 | 1.10 ± 0.11 | 0.001* |
| F ≥ 2 | 26 | 1.00 ± 0.09 | ||
| D* (× 10–3 mm2/sn) | F < 2 | 38 | 84.20 ± 24.37 | 0.001* |
| F ≥ 2 | 26 | 114.40 ± 42.51 | ||
| f | F < 2 | 38 | 21.70 ± 4.51 | 0.001* |
| F ≥ 2 | 26 | 16.72 ± 4.77 | ||
| ADC (× 10–3 mm2/sn) | F < 2 | 38 | 1.50 ± 0.13 | 0.001* |
| F ≥ 2 | 26 | 1.30 ± 0.17 |
Discussion
In our study, the diagnostic efficacy of IVIM-DWI parameters in staging liver fibrosis in HBV patients was investigated. Our findings suggest that IVIM-DWI could play a significant role in the detection and staging of liver fibrosis related to HBV.
Many studies in the literature have demonstrated that ADC values significantly decrease in patients with advanced fibrosis and cirrhosis compared to healthy individuals [9,12-14]. In our study, similarly to the literature, ADC values were found to be significantly lower in the patient group compared to the healthy control group. Furthermore, we also observed significant differences in ADC values between the F < 2 and F ≥ 2 groups. In the study by Luciani et al. [9], the mean ADC value in cirrhotic patients was reported as 1.23 × 10⁻³ mm²/s. Similarly, in the study by Girometti et al. [12], the mean ADC in cirrhotic patients was found to be 1.11 ± 0.16 × 10⁻³ mm²/s. In our study, the optimal cut-off value between the healthy group and the patient group (comprising all included hepatitis B patients) was determined as 1.4 × 10–³ mm²/s.
However, some studies have indicated that ADC may not be a reliable parameter for detection of early fibrosis [15,16]. Some studies have shown that ADC values are insufficient for distinguishing early (F0-F1) from intermediate (F2) stages of fibrosis. Significant overlaps in ADC values across different fibrosis stages have been observed, making it difficult to achieve a clear distinction in the early stages [17,18]. Additionally, factors such as steatosis and iron accumulation have been reported to affect ADC measurements, thereby reducing reliability in detecting early fibrosis [19]. Similarly to our findings, most studies have demonstrated that ADC values effectively differentiate early-stage from advanced fibrosis. These findings suggest that DWI could be a valuable tool in the non-invasive assessment of liver fibrosis and has the potential to become an alternative to biopsy. Unfortunately, the DWI technique lacks standardisation, with variability in b-values and organ-specific diagnostic thresholds [10]. These factors may be the cause of the inconsistent results between fibrosis and ADC values obtained in some studies.
According to IVIM theory, instead of the mono-exponential method used for ADC calculation, the biexponential model using signals obtained using multiple b-values can give us 3 additional parameters (D, D*, and f). Thus, the IVIM model enables differentiation of true molecular diffusion from perfusion causing changes in liver signal intensity [20,21].
The prevailing observation is that liver fibrosis is associated with decreased hepatic perfusion, and reduced portal flow cannot be compensated by the increased arterial flow induced by intrahepatic portal hypertension [15,22].
In chronic liver disease, the progression of fibrosis results in increased protein accumulation in the extracellular matrix and decreased perfusion. Therefore, perfusion plays an important role in the grading of liver fibrosis. Liver fibrosis is associated with changes in the hepatic microcirculation, known as the sinusoidal capillaries. The functional vascular volume fraction (f) of the liver and flow in the hepatic sinusoids (D*) decrease due to disruption of the bidirectional flow between the hepatic sinusoid and the Disse space [23]. Some authors have claimed that D*, one of the parameters associated with perfusion, may be an important marker in the demonstration of hepatic perfusion [13,24-27]. The D* parameter reflects the decrease in portal flow as a result of extracellular matrix protein accumulation and narrowing of the sinusoidal space [21]. In most studies, the D* value was significantly lower in patients with liver fibrosis compared to the healthy group and showed a significant negative correlation with fibrosis stage [13,15,22,27]. However, it has also been reported that D* measurements have weak interobserver correlation and substantial overlap in patients with moderate fibrosis [28]. In contrast to these studies, we observed significantly higher D* values in the patient group compared to the control group. Additionally, we found a significant difference in D* values between F < 2 and F ≥ 2 groups. Moreover, our ROC analysis revealed that the D* parameter has high sensitivity and specificity in distinguishing fibrosis stages, as similarly reported by Jiang et al. [10]. A meta-analysis demonstrated that the D* parameter is the best IVIM parameter associated with hepatic fibrosis, and similarly, previous studies have shown that D* values are higher in patient groups compared to control groups [29-31]. The reason for the difference in the D* value is not clear, but it has been reported that the number of b-values below 200 s/mm2, selection of b-values, or the magnetic field strength of the MRI system can cause indeterminate findings [22,30].
The other perfusion-related IVIM parameter, f, reflects the functional vascular volume fraction in the liver. Nonetheless, there have been various results among f-values in previous studies. Some studies have shown no significant correlation between the f-value and fibrosis [24]. However, in some previous studies, the f-value showed a significant difference according to fibrosis stage [15,31,32]. In our study, there was no significant difference in f-values between the patient and control groups whereas a significant difference in f-values was observed between the F < 2 and F ≥ 2 fibrosis subgroups. The discrepancy in f-values between studies may be explained by the relationship between f and echo time (TE), especially in tissues such as liver with shorter T2 relaxation time than blood [33].
D* and f-values reflect microcirculation while the D-value indicates molecular diffusion at the intracellular and extracellular levels. Numerous studies have shown that there is no significant difference in D-value in patients with fibrosis [15,22,25]. In some studies, the D-value was significantly lower in advanced fibrosis (F3 and F4) [26]. Likewise, we also observed that the D-value was significantly lower in the patient group. Notably, in our study, the D and D* parameters possess high sensitivity (63.3-78.1%) and specificity (73.3%) in distinguishing of fibrosis stages.
Furthermore, a study by Loh [34] explored the impact of various imaging factors on IVIM parameters, such as slice thickness and repetition time, in healthy volunteers. While their focus was on technical variations, they confirmed the robustness of IVIM measurements across different acquisition protocols, which strengthens the validity of IVIM-based assessments in clinical settings. Loh et al. [34] also emphasised the importance of accurately reporting imaging parameters, such as slice gaps and TR, a point that should be considered when standardising liver fibrosis assessments in future IVIM studies.
We advocate that the ADC, D*, and f parameters may contribute to differentiate F < 2 from F ≥ 2 subgroups, which are especially necessary in daily practice. Furthermore, the D* value may be useful in the differentiation of F1 from F2-3 groups. The detection of moderate (F2-3) and advanced (F4-6) fibrosis with high accuracy is critical. Moderate fibrosis is regarded as an important indicator of progressive disease, and initiating treatment at this stage significantly contributes to regression. Detecting moderate and advanced fibrosis and identifying patients with cirrhosis are important for the follow-up and imaging of portal hypertension and HCC. Our study showed that ADC, D*, and f values can be beneficial in the differential diagnosis of patients with moderate/advanced fibrosis and no/mild fibrosis. In addition, the D*-value enabled detection of mild and moderate fibrosis.
Our study has some limitations. First, it is a single-centre study with a limited sample size, particularly in the F4-6 group (n = 7), which represents a significant limitation and should be considered when interpreting the results. However, an important strength of the study is that imaging was performed immediately before the biopsy. VOI measurements were attempted from the right lobe, near the biopsy site, but the manual nature of these measurements may introduce variability. Future studies should aim to incorporate automated or semi-automated measurement techniques to enhance reproducibility. Additionally, the reproducibility of IVIM-DWI parameter measurements may vary depending on device differences and settings, which could influence the results.
Conclusions
IVIM-DWI, which enables the analysis of micro-perfusion and diffusion, is an adjunctive non-invasive alternative method for staging of HBV-related liver fibrosis. D*, D, and ADC values are efficient in the differentiation of early-stage from advanced fibrosis whereas the D* parameter, reflecting liver perfusion, is a more significant predictor IVIM parameter for the differentiation of fibrosis stages. Therefore, we recommend IVIM-DWI, which can reduce the need for biopsy, for the detection of early-stage fibrosis and follow-up of moderate and advanced fibrosis.