Introduction
Ischaemic stroke is one of the most common causes of morbidity and mortality in all highly developed countries. According to the World Health Organisation, stroke is the third most frequent cause of death in adult populations, and the main cause of permanent disability in adulthood. In Europe annually symptoms of ischaemic stroke occur in approx. 110-290 individuals per 100,000; approx. 30% of those affected die, and another 30% present lasting disabilities. In Poland stroke incidence is in the range of 170-190 per 100,000 and the condition is the fourth most common cause of death and the main cause of disability [1]. Notably, according to demographic data, in the coming years the incidence of ischaemic stroke will grow due to the expected increase in the number of people over 65 years of age [2]. Given the above, quick diagnosis in the case of ischaemic stroke is of critical importance to enable administration of adequate therapy. At present the standard treatment involves intravenous thrombolytic therapy applied within three hours of the onset of the first symptoms. This time window was adopted because of the viability characteristics of penumbra compared to infarct area. The penumbral zone is an area of brain tissue with decreased energy levels caused by reduced perfusion, leading to abnormal electrical activity of cells, but sufficient to sustain normal activity of ion channels. Although it is an area at risk, it is possible to restore physiological processes in this zone by applying suitable treatment [3,4]. The penumbra always surrounds the infarct area (core), where brain tissue is irreversibly affected by ischaemic lesions. Therefore, it is crucial to quickly diagnose the condition using advanced tools of medical imaging, which make it possible not only to visualise the ischaemic region, but also to differentiate the area into the penumbral zone and the core, which is essential for adopting a treatment strategy [3,5]. In clinical practice, CTP also improves diagnostic confidence and is a useful adjunct to clinical assessment and standard imaging [5,6].
A study by Campbell et al. [6] demonstrated that automated processing of CTP can provide an objective mismatch classification across sites with a range of imaging experience, and it facilitated significantly faster treatment decisions compared to MRI.
Material and methods
Patient population
The study involved a group of 65 patients with neurological symptoms suggestive of ischaemia in the area of the MCA. They were subjected to diagnostic examinations – non-contrast and perfusion CT brain scans – within 12 hours of the first symptoms. The group of 65 patients comprised 31 females (47.7%) and 34 males (52.3%), with a mean age of the 67 ± 13.2 years. The youngest patient was 36 and the oldest was 95 years old. Half of the patients were 70 or younger.
Imaging protocol
All CT scans were performed using a 16-slice CT scanner equipped with a 24-mm-wide detector. Acquisition and reconstruction parameters for CTP were as follows: 80 kVp, 140 mAs, and 12 × 1.5 mm detector collimation and a scan duration of 40 s. A scan delay of 4 s was applied after injecting 40 ml (flow rate 8 ml/s) of iodinated contrast agent.
The examination was performed first without contrast and then using a perfusion technique enabling acquisition of perfusion maps for the following parameters: CBV, CBF, and TTP. The 16-slice CT scanner is the basic and most common tool required for this type of research. The results were obtained based on the perfusion maps from two regions: one at the level of the thalamus and the basal ganglia (P1) and the other located higher, directly adhering to the upper margin of the subcortical nuclei (supranuclear area) (P2).
Computed tomography perfusion analysis
Three different types of processing software were used to analyse all CTP data: package A – PCT Neuro (Siemens Healthcare, Erlangen, Germany), the maximum slope model, and package B – VPCT (Siemens Healthcare, Erlangen, Germany) deconvolution model. The models define the infarct core as an area in which CBF shows values approximately 27 ml/100 g/min (A) and 35 ml/100 g/min (B), and CBV values lower than 1.2 ml/100 g. The penumbral region is defined as an area in which CBV values exceed this threshold.
Package X-Perfusion 0.43 – the criteria adopted for software X were the same as those proposed by Muir et al. [7], i.e. the infarct core is defined as an area in which rCBV is 65% lower than that in the other hemisphere and TTP is equal or greater than 3 s.
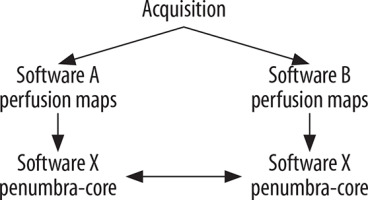
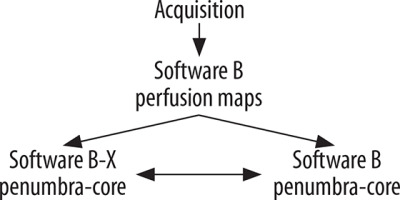
The raw scan data acquired in order to identify areas of penumbra and infarct core were analysed in two ways:
imaging data acquisition was performed with two different computer programs (A-Neuro PCT, and B-Neuro VPCT), which produced two different sets of perfusion maps: CBV, CBF, and TTP. Subsequently, these were processed using one program (X – Perfusion 0.43), which identified the penumbra and core within the ischaemic area. In this way it was possible to compare the effects of different programs at the stage of raw data transformation into perfusion maps;
imaging data acquisition was performed with only one computer program (B-Neuro VPCT), which produced a single set of perfusion maps: CBV, CBF, and TTP. Subsequently two different programs (X and B) were used to identify the penumbra and core within the ischaemic area. In this way it was possible to compare the effects of different programs at the stage of perfusion map post-processing, designed to identify penumbra and core areas.
Obtained at the final stage, the cross-sectional images of the brain showed the ischaemic regions, in which the penumbra was marked in green and yellow colour and the infarct area (core) in red.
At the same time, the percentage rates were determined for the areas occupied by the penumbra and the core. Subsequently statistical methods were applied to compare the results and assess their significance. Assessment of the consistency of the results was expanded to examine whether the disparity between the measurements conducted by the programs significantly differed from zero. Bland-Altman plot and regression analysis were performed for this purpose. The former was based on Student’s t-test for dependent variables, or its nonparametric equivalent, the Wilcoxon test. The latter was applied to assess the significance of the coefficient representing the slope of the curve.
Results
The effect of varied software transforming acquired data into perfusion maps in the identification of the penumbra and core within the ischaemic region
The acquired imaging data were processed using two different programs (A-Neuro PCT and B-Neuro VPCT) in order to obtain defined ischaemic regions and the related parameters. Subsequently, X-Perfusion 0.43 software was applied to distinguish the penumbra and core within the ischaemic region. In this way it was possible to examine the effects of the programs transforming the acquired data into perfusion maps in the final assessment, determining which part of the ischaemic region comprises the penumbra and which part comprises the core (Figure 1).
Figure 1
A) Image of an ischaemic region generated by software X based on MIP, CBV, CBF, TTP images created by software A. B) Image of an ischaemic region generated by software X based on MIP, CBV, CBF, TTP images created by software B. Penumbral area is marked in green; infarct core is marked in red
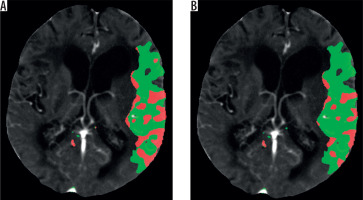
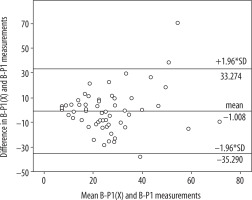
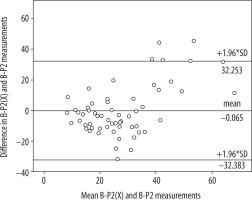
Table 1 presents the mean value of the differences in the measurements obtained from the relevant software, as well as standard deviation. No statistically significant differences were found between average results created by software A and B in the P1 layer (A-P1, B-P1) (p = 0.108) or between average results created by software A and B in the P2 layer (A-P2, B-P2) (p = 0.914). The correlation between the results was very high in both cases. The correlation coefficient was R = 0.833 (p < 0.001) for A-P1 and B-P1 as well as R = 0.784 (p < 0.001) for A-P2 and B-P2. A Bland-Altman plot was used to create graphic representations of the results obtained using the relevant software. In both cases the majority of the results fell within the Bland-Altman limits of agreement (Figures 2 and 3).
Table 1
Comparison of results and consistency of software A and B findings (in P1 and P2 layers) transformed by software X
Figure 2
Bland-Altman plot with limits of agreement between software A and B findings (P1 layer) transformed by software X
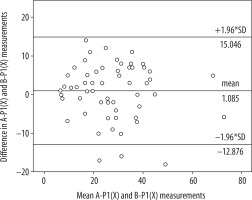
Figure 3
Bland-Altman plot with limits of agreement between findings from software A and B (P2 layer) transformed by software X
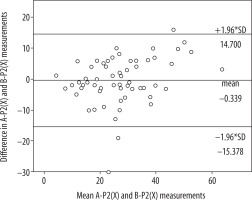
This shows strong correlation between the data obtained as a result of imaging data processing performed with two different programs, and then post-processed by one program differentiating the ischaemic region into penumbra and core.
The effect of varied software post-processing perfusion maps in the identification of the penumbra and core within the ischaemic region
The acquired imaging data were processed using the same program (software B-Neuro VPCT) in order to obtain perfusion maps with parameters as well as defined ischaemic regions. Subsequently, two programs (software X-Perfusion 0.43 and software B-Neuro VPCT) were applied to distinguish the penumbra and core within the ischaemic region. These findings were based on perfusion maps from two investigated levels. In this way it was possible to examine the effects of the programs post-processing the perfusion maps in the final assessment, determining which part of the ischaemic region comprises the penumbra and which part comprises the core (Figure 4).
Figure 4
A) Image of an ischaemic region generated by software X based on images of perfusion maps obtained using software B. Penumbral area is marked in green; infarct core is marked in red. B) Image of an ischaemic region generated by software B based on images of perfusion maps obtained using software B. Penumbral area is marked in yellow; infarct core is marked in red

Table 2 presents the mean value of the differences in the measurements generated by the relevant software, as well as the standard deviation. No statistically significant differences were found between average results created by software X and B in the P1 layer (X-P1, B-P1) (p = 0.284) or between average results created by software X and B in the P2 layer (X-P2 and B-P2) (p = 0.345). The correlation between the results obtained based on the respective software was low in both cases. The correlation coefficient was R = 0.342 (p = 0.008) for X-P1 and B-P1 as well as R = 0.522 (p < 0.001) for X-P2 and B-P2. The poor consistency of the findings is confirmed by Bland-Altman plots (Figures 5 and 6). The consistency in this part of the study is visibly lower than in the result shown in the previous analysis.
Table 2
Comparison of results and consistency of X-P1, B-P1 and X-P2 and B-P2 findings obtained based on images of perfusion maps from software B
Discussion
The present study was an attempt to compare data obtained through analysis of perfusion imaging performed using software packages representing convolution (maximum slope of the curve) and deconvolution methods. The above programs differed with cut-off points for penumbra and core.
The first part of the study shows a strong correlation (0.784-0.846) between the data obtained as a result of imaging data processing performed by two different programs and subsequently subjected to post-processing by a single program analysing the areas of penumbra and core.
The second part shows poor correlation (0.315-0.554) between the data obtained as a result of imaging data processing performed by one program but ultimately post-processed by two different programs analysing the areas of penumbra and core.
Criteria adopted for software X were the same as those proposed by Muir et al. [7], i.e. the infarct core is defined as an area in which rCBV is 65% lower than that in the other hemisphere, and TTP is equal or greater than 3 s, and in the penumbral region values of rCBV exceed 65%. For software B it was assumed that in the infarct core rCBV values are 40% lower than on the opposite side, which is equivalent to an absolute CBV value of 1.2 ml/100 ml, and in the penumbra rCBV values are greater than or equal 40%, and rCBF values are lower than or equal 64% compared to the opposite side, which corresponds to an absolute value of CBF at a level of 35 ml/100 ml/min.
The findings show disparities in cumulative maps generated by different software packages, specifically related to data obtained if imaging input processing was performed by two different programs and then post-processing by one program, as well as to data obtained when imaging input processing was executed by one program and then post-processing was performed by two different programs analysing the areas of penumbra and core. In all the cases differences were identified in the determined penumbra and core sizes, despite the fact that in the first analysis the results show strong correlation. The findings confirm the necessity to develop uniform perfusion data analysis, uniform protocols, and uniform mathematical algorithms to make sure PCT imaging can be a reliable tool to be used in stroke management in clinical practice.
Software currently available in the market, designed for perfusion CT studies, may generally be divided into two groups: convolutional and deconvolutional, depending on the use of varied mathematical algorithms. Therefore, even though parameters are given the same name in various software packages, there may be significant disparities between them if they are calculated using different algorithms, which was shown by Kudo et al. [8].
A review of the related literature showed no studies closely corresponding to the present analysis. Some researchers, however, compared software representing varied mathematical models.
The purpose of the study by Austein et al. [9] was to determine the accuracy of different commercial perfusion CT software packages (Philips [A], Siemens [B], and RAPID [C]) to predict the final infarct volume (FIV) after mechanical thrombectomy. CT perfusion data from 147 mechanically recanalised acute ischaemic stroke patients were postprocessed. The study demonstrates significant differences between the three CTP packages in the predictive accuracy of FIV after MT. The highest precision and good accuracy were found for the RAPID software, which was superior to the Philips and Siemens software. Of the three packages, the Philips software would imply a more restrictive patient selection. The Siemens software significantly overestimated the hypoperfusion volume compared with the others.
Chang et al. [3] evaluated computer-generated lesion maps from a single vendor for CTP in order to predict acute infarct as a sensitive diagnostic tool but were limited by a lack of specificity and positive predictive value. The study shows a significant positive correlation with large lesion sizes and infarct outcome. This corroborates the use of CTP as a tool for decision-making in treatment of infarcts with large ischaemic penumbras.
Fahmi et al. [10] assessed the variability of the area of infarct core and penumbra as presented in summary maps produced by two different software packages. Identical image datasets were analysed by using two different commercially available CTP analysis software packages, each representing widely used algorithms: delay-sensitive and delay-insensitive. The infarct core and penumbra area of CTP summary maps were significantly different, emphasising the need for standardisation of CTP analysis to make it viable for use in clinical practice.
Zussman et al. [11] conducted a similar study with the use of the following software: Brain Perfusion, Extended Brilliance, Workspace, version 3.5, Philips Healthcare; CT Perfusion, version 4.3, GE Healthcare; and Vitrea, version 2. In this case, it was also shown that the differences between the software applications were the basic cause for disparities in the final results. Based on the above findings, it was concluded that caution is needed while interpreting quantitative CT perfusion results, because the values may vary significantly depending on the software used at the stage of post-processing.
Kudo et al. [8,12] showed, based on a study of 10 patients, that there may be significant differences in perfusion maps generated from source data by five different commercially available software packages (Philips Healthcare, GE Healthcare, Toshiba, Siemens, and Hitachi). Taking into account the applied mathematical algorithms, the programs were divided into two groups: convolution model, comprising maximum slope (MS) method as well as deconvolution model, including a number of variants, i.e. SVD (singular value decomposition), sSVD (standard SVD), bSVD (block-circulant SVD), IF (inverse filter), and bMTF (box modulation transfer function). It was shown that processing with the above programs resulted in significant differences in the values of CBF and MTT but not in CBV. Based on that, the algorithms were classified into two groups, due to tracer-delay sensitivity or insensitivity [13].
On the other hand, Schaefer et al. showed that delay-sensitive algorithms seem to overestimate CBV values in patients with co-existing haemodynamic impairment associated with abnormal intracranial or extracranial circulation [14].
Sanelli et al. [15], in a study of perfusion measurements of three patients, showed that differences in various data defined by the user during map processing ultimately affect quantitative values of CBF, CBV and MTT. The measurements were processed using one program (GE Functool, version 1.9s). It was reported that differences in arterial ROI placement and arterial and venous ROI size did not significantly affect the mean values of CBF, CBV, and MTT within the infarct core. Conversely, even minor differences in the selection of venous ROI placement considerably altered the quantitative values for each of the CT perfusion maps.
In another study by Sanelli et al. [16] it was shown that the interaction of the observer with the software is an important component for correct identification of parameters by the user. In order to maintain good reproducibility, it is necessary to establish a uniform and standard post-processing technique.
On the other hand, Soares et al. [17] demonstrated that automated post-processing of perfusion maps improves agreement in measurements of CBV, CBF, and MTT, and in assessment of the volume of infarct core and penumbra.
It should also be pointed out that of key importance are not only the differences in CBV, CBF, MTT, and TTP perfusion maps generated at the stage of pre-processing, but also the cut-off values defining the areas of penumbra and core. In the software applied by the Philips company the infarct core is defined as a region in which relative values of rMTT are 50% larger compared to the other hemisphere, and values of CBV are lower than 2.0 ml/100 g. The penumbral zone is defined as a region that exceeds the upper threshold of the CBV value. The software of the Siemens company defines the infarct core as an area in which the CBF shows values below 27 ml/100 g/min when a deconvolution method is applied in calculations, and 35 ml/100 g/min with the maximum slope method (rCBF approximately 64%), and CBV values lower than 1.2 ml/100 g. The penumbral region is defined as an area in which CBV values exceed this threshold. What is more, there are differences in cut-off points not only between software applications of various companies, but also in programs of the same company, depending on their update versions. Because blood flow through vascular bed cannot be measured directly from perfusion data, it must be reflected using such dynamic parameters as MTT, which represents flow deficit because it equals the volume-to-flow ratio (CBV/CBF). However, different algorithms are used in various programs to calculate the two parameters; therefore, MTT values are naturally different. Given the above, it would be worthwhile considering the way in which standardisation of data could be achieved to enable proper assessment of infarct core and penumbra.
In summary, results of perfusion scan analysis depend on a number of factors. The research findings presented above show that the results may vary due to differences in protocol, data post-processing, and the diverse mathematical algorithms applied [15,18,19]. The human factor also significantly affects the reproducibility of perfusion measurements performed with the same software but based on altered parameters [20,21].
Nonetheless, the variability in the results defining the values of penumbra and core is mainly linked to the software applications of various companies, utilising different mathematical algorithms [11,22,23].
It is extremely difficult to assess the accuracy of perfusion measurements in identifying the areas of penumbra and core. For this purpose, studies were conducted to compare results of perfusion CT with the DWI option (commonly accepted in clinical assessment as a standard in determining the infarct core [24,25]), and to find out which of the perfusion CT parameters reflects the infarct core more accurately. A major limitation to this comparative method lies in the fact that it is impossible to perform these measurements simultaneously, due to technical reasons. During the break between CT and MR exams there may be an increase in the area of the infarct core, which leads to erroneous estimation of the results. A study by Kamalian et al. [26] showed that optimisation of threshold values of perfusion parameters to achieve agreement with DWI also depends on software, and in fact it is CBF rather than CBV that more closely correlates with DWI and should be taken into account as a standard criterion in determining infarct core.
The accuracy of perfusion measurement was also investigated by Wintermark et al. [27], who compared CTP results with control CT and MR studies. The analyses demonstrated that CTP measurements identify stroke more accurately than non-contrast CT. The study, however, did not examine the accuracy of measurements assessing the actual areas of the core and penumbra.
Conclusions
The results obtained from transformation of imaging data into perfusion maps using different programs but analysed by one program differentiating penumbra and core areas within ischemic region, show a strong correlation. The results obtained from transformation of imaging data into perfusion maps using one program but analysed by various programs differentiating penumbra and core areas, show a poor correlation.


