Introduction
Echinococcosis, a zoonotic disease caused by the larval form of the cestode Echinococcus, still constitutes a major health concern in sheep rearing areas of Asia, the Mediterranean, Australia, and New Zealand. Echinococcus can affect any human organ. The liver is the most commonly affected organ (75%) followed by the lungs (15%) [1,2]. Less commonly, spleen, kidney, bones, brain, muscle, etc. are involved [1]. Pulmonary hydatid disease can be asymptomatic or may present with cough, chest pain, breathlessness, or haemoptysis [2,3]. A large number of cysts are diagnosed incidentally on chest X-ray. Chest radiography is the preliminary investigation for the diagnosis of pulmonary hydatid cyst. Computed tomography (CT) is the main workhorse for the diagnosis of pulmonary hydatid disease. Magnetic resonance imaging (MRI) has made gradual inroads into the armamentarium for diagnosing pulmonary hydatid disease [3]. Most pulmonary hydatid cysts can be diagnosed on CT when cysts show typical appearances; however, sometimes the findings may be atypical or indeterminate, leading to diagnostic dilemma [2,3]. Complicated (ruptured or infected) hydatid cysts closely resemble other hypodense neoplastic and infective lesions on CT [4]. Neoplasms such as necrotic primary lung cancer, cystic lung metastasis, cystic schwannoma, lung abscess, congenital cysts (like cystic adenomatoid malformation or bronchogenic cyst), or a fluid-filled tubercular cavity can closely mimic pulmonary hydatid cyst on CT [4-6].
We present the cross-sectional imaging appearances of pulmonary echinococcosis with emphasis on utility of magnetic resonance imaging (MRI) in resolving the diagnostic dilemma in difficult cases with atypical or indeterminate CT findings.
Material and methods
This was a descriptive, prospective study conducted for a period of 3 years from December 2016 to November 2019. Institutional Ethical Committee (IEC) approval was obtained for the study, and informed consent was obtained from each patient.
Inclusion criteria
Patients suspected of having pulmonary echinococcosis on their clinical profile and preliminary chest radiography were included in the study. All the patients were examined with a chest CT. Patients with an unequivocal diagnosis of pulmonary hydatid cyst on CT proceeded for treatment. However, in cases with a diagnostic dilemma on CT, MRI was performed to overcome the diagnostic difficulty. The indications for MRI included the following: thick irregular cyst wall, imperceptible cyst wall, enhancing cyst wall, presence of internal septations within the cyst, solid appearance, presence of mediastinal or hilar lymphadenopathy, and presence of filling defect in pulmonary arteries. However, MRI was also performed in some purely cystic lesions with the aim of demonstrating the hypointense rim sign.
Exclusion criteria
Patients with hypersensitivity reaction to iodinated contrast and severely deranged renal function were excluded from the study.
Imaging protocol
Patients suspected of pulmonary echinococcosis (n = 110) were examined with a chest CT. CT scan was performed on a 64-multidetector row CT scanner (Somatom Sensation, Siemens, Erlangen, Germany). The scanning parameters used were tube current of 100-180 mAs, tube voltage of 100-130 kVp, beam pitch of 1.4, and slice thickness of 5 mm. Scans were performed in supine head-first position in a single breath-hold. Both the non-contrast and contrast-enhanced CT scans extended cranially from thoracic inlet to upper abdomen caudally. Non-contrast CT was performed followed by a contrast-enhanced scan after administration of non-ionic iodinated contrast agent (Iohexol, Omnipaque, GE Healthcare) 45-60 seconds after the start of contrast injection.
Among the total study cohort, 41 cases were additionally examined with MRI of the thorax. MRI was performed on a 1.5 T scanner (Magnetom Avanto, Seimens). The MRI protocol consisted of non-respiratory gated T2-weighted turbo spin echo (TSE) sequence with time to echo (TE) of 92 ms, time of repetition (TR) of 900 ms, and matrix of 320 × 240 in axial and coronal planes. However, a few cases with findings suspicious of neoplasm were further examined with T1-weighted sequence before and after contrast administration.
Image analysis
Two readers with 7 and 8 years of experience, respectively, in chest radiology, blinded to the final diagnosis, independently assessed the CT and MRI images. In cases of disagreement between the 2 readers, a third reader adjudicated the final decision. The CT images were viewed in lung window settings at a window width of 1200-1500 HU and centring of –500 to –600 HU, and mediastinal window using a window width of 300-400 HU and centring of 40 HU. The readers studied the imaging characteristics of pulmonary hydatid on both CT and MRI. The location, size, number, imaging appearance, post-contrast enhancement, and any additional features were recorded. Final diagnosis was based on surgery or histopathology. In 3 cases the final diagnosis was based on the temporal course of the patient.
Statistical analysis
Statistical analysis was performed using the Statistical Package for the Social Sciences (SPSS Inc. Chicago, IL, version 21.0) and Open Source Epidemiologic Statistics for Public Health (EPI; Dean AG, Sullivan KM, Soe MM, MIT). Continuous variables like age were expressed as means and standard deviations, whilst categorical variables were expressed as counts and percentages. The agreement between 2 interpreting radiologists for CT and MRI findings was evaluated with the Kappa method (according to Landis and Koch 0: poor agreement; 0.01-0.20: slight agreement; 0.21-0.40: fair agreement; 0.41-0.60: moderate agreement; 0.61-0.80: substantial agreement; 0.81-1.0: almost perfect agreement). Using descriptive statistics, the sensitivity, specificity, positive predictive value (PPV), negative predictive value (NPV), and diagnostic accuracy were calculated for MRI. The results of CT and MRI were compared by McNemar test using biopsy or surgery as the final diagnosis.
Results
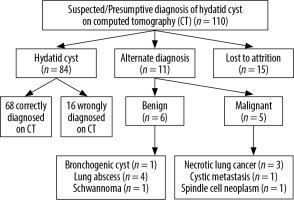
A total of 110 patients comprising 67 males and 43 females with age range of 8 to 76 years (mean ± SD; 34.2 ± 25.3 years) were included in the study. Final cohort consisted of 95 patients because 15 patients were lost to follow-up/attrition. Among the final cohort of 95 patients, 84 were found to have hydatid disease as the final diagnosis, which was confirmed by surgery and/or biopsy. Eleven patients were found to have alternate diagnoses, which included lung abscess (n = 4), intrapulmonary bronchogenic cyst (n = 1), malignant lung neoplasm (n = 3), schwannoma (n = 1), spindle cell neoplasm (n = 1), and metastasis (n = 1) (Figure 1).
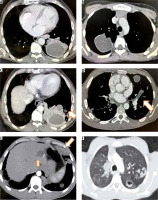
There was almost perfect agreement (Cohen’s k of 0.82) in reading CT and MRI images between the 2 radiologists. The commonest CT finding of surgery/histopathology-proven hydatid cysts (n = 84) was unilocular hypodense cyst with a well-defined perceptible wall with surrounding consolidation (29) (34.6%) or normal surrounding lung parenchyma (n = 18) (21.4%) (Figure 2). Hypodense cystic lesion with a thin imperceptible cyst wall was seen in 10 (11.9%) patients (Figure 3). Hypodense lesion with an intracystic folded membrane representing a detached endocyst was observed in 7 (8.3%) patients. Hypodense cystic lesion with intracystic gas producing air bubble sign or air crescent sign was seen in 10 and 4 patients, respectively. A solid appearing lesion resembling a lung mass was seen in 5 cases. Two patients had intravascular filling defect within pulmonary arteries representing an intravascular hydatid cyst (Figure 3). None of the cysts showed wall calcification.
Figure 2
Axial (A) and coronal (B) computed tomography images in a 22-year-old boy showing large well circumscribed cyst in left lower lobe with thick smooth wall and small pleural effusion. Intra-operative photograph (C) and excised specimen (D) showing large hydatid cyst
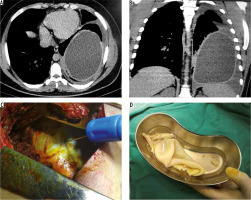
Figure 3
Computed tomography images of different patients showing varied appearances of pulmonary hydatid cyst. Thick walled cyst with surrounding consolidation (A), thin walled cyst with normal surrounding pulmonary parenchyma (B), thick walled cyst with a small satellite cyst and surrounding lung consolidation (C), hypo-dense filling defect in left upper branch pulmonary artery (arrow in D), bizarre lobulated solid appearing cysts in left lower lobe with accompanying cyst in liver (arrows in E) and cysts with irregular walls and intracystic air (F)
A correct diagnosis of hydatid cyst was made on CT in 68/84 (80.9%) cases. The remaining 16/84 (19.1%) patients received an erroneous alternate diagnosis on CT. Among them 6 were given a diagnosis of abscess, 5 received a diagnosis of necrotic lung cancer, 2 were labelled as cystic metastasis, 1 schwannoma, and 2 were labelled as intrapulmonary bronchogenic cyst.
One patient with multiple cysts in parenchyma of both lungs was also found to have intra-vascular hypodense material in right pulmonary artery and left upper lobar pulmonary artery suggestive of intravascular embolisation of hydatid cysts. This patient had right pulmonary artery occlusion with hypertrophied bronchial, intercostals, and right inferior phrenic artery (Figure 4). CT findings are given in detail in Table 1.
Figure 4
Intravascular pulmonary hydatid cyst in right main and left branch pulmonary artery. Axial (A) and coronal (B) computed tomography (CT) images reveal hypodense filling defects in right main pulmonary artery with extension into right upper lobar pulmonary artery with air foci inside (arrows in A and B). Coronal T2-W image (E) shows multiple cysts corresponding to right main and upper pulmonary lobar artery suggesting diagnosis of intravascular hydatid cysts. The patient showed hypertrophied intercostal (C), bronchial and inferior phrenic arteries. Axial CT image (D) in the same patient also shows left branch pulmonary artery hypodense filling defect which was hyperintense on T2-W image (F)
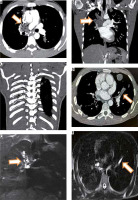
Table 1
Computed tomography (CT) findings in pulmonary hydatid cysts
Single cyst was seen in 69 (82.1%) patients, whereas 2 or more cysts were seen in 15 (17.9%) patients. Size of cysts varied from 1.1 cm (smallest) to 16 cm (largest). Right lung was affected in 48 (57.1%) and left lung was affected in 36 (42.8%) patients. Lower lobes were involved in 57 (67.8%), upper lobes in 22 (26.1%), and right middle lobe in 5 patients. Pleural effusion was seen in 13 (15.4%) patients.
Among the total study population 41 patients were evaluated with T2-weighted MRI of the thorax. T2-weighted MRI showed hyperintense cyst with hypointense rim in 11 cases (Figure 5) whereas 19 cases showed hyperintense cystic lesion with internal floating wavy hypointense membrane (Figure 6). Based on the classical findings of hyperintense pulmonary cystic lesion with T2-weighted hypointense rim or detached internal T2-weighted hypointense membrane, a correct diagnosis of hydatid cyst was possible in 30 patients (true positives) whereas a correct alternate diagnosis was made in 8 cases (true negatives). T2-weighted hyperintense cyst with presence of hypointense rim helped diagnose 11 patients whereas hyperintense cyst with presence of folded or floating wavy T2-weighted membrane aided the diagnosis in 19 ruptured cysts. These two findings together diagnosed 30 (90.9%) hydatid cysts correctly (true positives). However, 2 (6%) cysts were wrongly classified as hydatid cysts based on these findings (false positives). One was found to have fungal abscess and another proved to be schwannoma (Figure 7). One case with absence of T2-weighted hypointense rim was finally proven to have hydatid cyst (false positive) (Figure 8). Eight patients with presence of thick wall with absence of hypointense rim or floating wavy hypointense membranes or cyst with solid cystic composition were given an alternate diagnosis (true negatives), and biopsy was suggested. Details of patients who underwent additional MRI are given in Table 2. Among the true negatives, necrotic lung carcinoma was found in 3, cystic metastasis in 1, abscess in 3, and bronchogenic cyst in 1 patient. Two patients with intravascular filling defects in pulmonary arteries on CT were found to have intravascular T2-weighted hyperintense cysts (Figure 4E) or tubular hyperintense intravascular cyst (Figure 4F).
Figure 5
Axial (A) and coronal (B) T2-W magnetic resonance imaging shows two homogeneously hyperintense cysts with smooth peripheral hypointense rim in both lungs
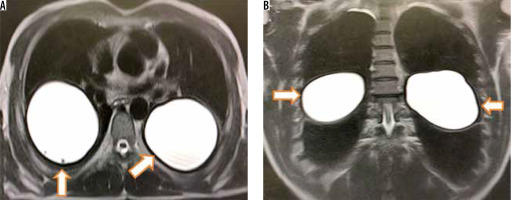
Figure 6
Frontal radiograph of chest (A) shows a homogenous round opacity in left lower lobe. Corresponding axial computed tomography image (B) shows round cystic lesion with slightly irregular wall and surrounding consolidation. Corresponding T2-W axial images (C and D) show hyperintense cyst with wavy floating hypointense membrane within the cyst
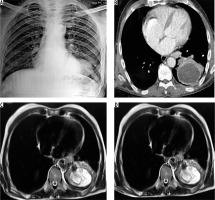
Figure 7
Axial computed tomography image (A) of a middle aged man showing round hypodense lesion in left lower lobe with pleural effusion. Corresponding T2-W magnetic resonance images (MRI) in axial (A) and coronal plane showing hypointense wall (arrow in B) with intralesional hypointense membranes or septations (arrow in C) suggesting hydatid cyst. Axial T1-W MRI (D) shows isointense to muscle lesion. Post-contrast T1-W coronal image (E) shows enhancement of wall and internal septations. USG was done which revealed round lesion with both solid and cystic components (F). Patient was operated and biopsy showed cystic schwannoma
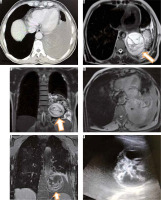
Table 2
Magnetic resonance imaging (MRI) characteristics of suspected hydatid cysts and their final diagnosis
Using descriptive statistics, T2-weighted MRI was found to have a sensitivity of 96.7%, specificity of 80%, positive predictive value (PPV) of 93.7%, and negative predictive value (NPV) of 88.8%, with overall diagnostic accuracy of 92.6% (Table 3).
Table 3
Calculation of statistical parameters for magnetic resonance imaging
The results of CT and MRI were compared in 41 cases in whom both CT and MRI were done using McNemar test against the final diagnosis obtained by surgery or biopsy. In these 41 cases CT made a correct diagnosis in 25 cases and an erroneous diagnosis in 16, whereas MRI was able to make a correct diagnosis in 38 cases with only 3 cases receiving an erroneous diagnosis on MRI. McNemar c2 statistic value was 5.44 with a corresponding p-value of 0.019, thus confirming that the results obtained by CT and MRI are significantly different and the diagnostic yield of MRI was superior to CT (Table 4).
Discussion
Echinococcosis, a zoonotic disease caused by the larval form of cestode Echinococcus, still constitutes a major health concern in sheep rearing areas of Asia, Mediterranean, Australia, and New Zealand. Among the four known species of Echinococcus, human infections are caused by two species namely Echinococcus granulosus and E. multilocularis. The adult worm of Echinococcus lives in the small bowel of dog or similar carnivorous animals, which are thus the definitive hosts. Hexacanth larva formed in the intestine of dog is excreted and ingested by the intermediate hosts (sheep and goat). Humans are the accidental hosts and are infected upon consuming raw vegetables, fruits or water contaminated with larva of Echinococcus. Upon ingestion the larva is released in the small intestine and is transported to the liver via portal circulation. Thus, the liver is the first organ of contact. Pulmonary circulation acts as the second filter for the larva and entrapment in pulmonary capillary network leads to pulmonary infestation. The wall of hydatid cyst is composed of 3 layers; endocyst, ectocyst, and pericyst (exocyst), from inner to outer, respectively. Pulmonary hydatid disease lends itself to varied clinical presentations. The majority of these infections are asymptomatic, some cause mild symptoms while some present with dramatic symptoms. Owing to the broad repertoire of clinical manifestations, imaging is the cornerstone for diagnosing hydatid disease. Typical and uncomplicated cases of pulmonary hydatid disease can be easily diagnosed; however, complicated and uncommon manifestations of this disease can be equally diagnostically challenging. Though mostly parenchymal, pulmonary hydatid disease can affect any thoracic structure including pleura, heart, and pulmonary vessels. Pulmonary vascular involvement by hydatid is extremely uncommon and is difficult to diagnose. Rupture and infection are the 2 main complications of pulmonary hydatid cysts. Rupture of endocyst also predisposes to secondary bacterial infection because endocyst is impervious to bacteria [7-9].
Pulmonary hydatid disease is more frequently encountered in children [10]. Right lung is involved more frequently than left lung [2,3]. With regards to location, lower lobes are affected more than upper lobes [2,3]. On CT hydatid cysts exhibit a variety of appearances. Unruptured cyst appears as a smooth hypodense cystic lesion with a well-defined perceptible wall [2,3]. Some cysts can have a thin imperceptible wall. However, when a cyst undergoes a complication like rupture or infection it assumes different appearances on CT. Thick-walled cyst with a wall thickness of greater than 10 mm can be seen in infected cysts [11]. When a growing cyst erodes an adjacent bronchus air tracks between ectocyst and exocyst and gives rise to an air crescent sign. If the air dissects between the ectocyst and exocyst for a large part of circumference of cyst the air seeps both inside the endocyst and between the endocyst and pericyst forming parallel air shadows, it is referred to as onion peel or cumbo sign [3,12]. When the endocyst becomes detached and floats within the cyst it produces water lily or Camelotte sign [3]. Sometimes the contents of a cyst may be emptied into the bronchus and coughed out by the patient, leaving behind an air-containing cyst, called empty (dry) cyst sign [2]. When these typical signs are seen on CT the diagnosis may be straightforward. However, a complicated cyst that has undergone rupture or infection does not always give rise to classical signs. On many occasions complicated cysts give rise to bizarre appearances [13]. A complicated cyst with air fluid level, thicker irregular wall, and surrounding consolidation can masquerade as lung abscess, necrotic lung cancer, cystic metastasis, necrotising pneumonia, or a schwannoma with cystic degeneration [14-16]. On CT we could correctly make a diagnosis of hydatid cyst in 68 (80.9%) patients, and 16 (19.1%) cases with atypical appearance on CT were wrongly given an alternate diagnosis. Involvement of the pulmonary arteries with hydatid cysts is a very rare occurrence and has been proposed to represent embolisation of daughter cysts from other organs like the liver [17-19]. We observed pulmonary artery involvement in 2 cases. One had complete occlusion of the right pulmonary artery and its upper lobar branch. The patient had also involvement of the left upper lobar pulmonary artery (Figure 4). With regards to multiplicity and location of lesions, our observations are in tune with previous reports in literature [3]. Owing to the compressibility of lung tissue hydatid, cysts can grow to large sizes (up to 20 cm). The largest cyst in our series was 16 cm. The term giant pulmonary hydatid cyst is loosely used for cysts that are more than 10 cm in size. None of the cysts in our study showed calcification or daughter cysts, although they have been reported previously [3]. In contrast to the extra-pulmonary cysts, pulmonary hydatid cysts seldom show calcifications or daughter cyst formation [20,21]. It is believed that a low concentration of carbon dioxide within the pulmonary parenchyma decreases the serum calcium level, which retards the precipitation of calcium in dead or degenerated tissue [4].
A large number of studies have previously been carried out to study the MRI appearances of hydatid cysts. Most of these studies have been performed for hydatid disease of other organs like liver [3]. Hydatid cysts are hypointense on T1-weighted sequence and hyperintense on T2-weighted sequence with low signal intensity capsule on T2-weighted sequence, which is referred to as hypointense rim sign [3]. No large study has been conducted to study the MRI features of pulmonary hydatid cysts. Our study had 41 cases of suspected hydatid cyst, which were evaluated with MRI. We could correctly diagnose 30 cases of hydatid cyst based on T2-weighted hypointense rim sign or the presence of floating wavy hypointense membrane. Mostly we acquired T2-weighted images. However, in a few instances where we suspected an alternate diagnosis we also performed additional sequences including non-contrast T1-weighted and post contrast T1-weighted sequences to further clarify the diagnosis. One patient showed a round hypodense lesion on CT with surrounding consolidation and pleural effusion. On T2W MRI it revealed irregular internal hypointense septations and peripheral hypointense wall. Upon contrast administration there was internal patchy enhancement suggesting an alternate diagnosis. This lesion was finally proven to be cystic schwannoma (false positive) (Figure 8). MRI correctly diagnosed 38 out of 41 examined patients (30 true positives and 8 true negatives). Two false positive cases and 1 false negative case were also encountered on MRI. T2-weighted MRI was found to have sensitivity of 96.7%, specificity of 80%, positive predictive value (PPV) of 93.7%, negative predictive value (NPV) of 88.9%, and overall diagnostic accuracy of 92.6% (Table 3). Tandur R et al. also reported high sensitivity, specificity, positive predictive value, and negative predictive value of MRI in diagnosis of hydatid cyst (93%, 91%, 93%, and 91%, respectively) [3]. Our observations are in line with the findings of the study conducted by Tandur et al. [3]. When a head-to-head comparison of MRI and CT was conducted using McNemar test against the final diagnosis obtained by surgery or biopsy, it was found that the diagnostic yield of MRI was superior to CT (p = 0.019).
Figure 8
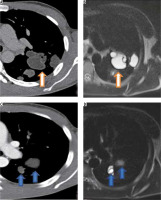
Magnified axial computed tomography (CT) image (A) reveals multiple thin walled cysts in left upper lobe. Corresponding T2-W image (B) shows thin hypointense rim (arrow) suggesting diagnosis of hydatid cysts. Magnified axial CT image (C) in a different patient shows thin walled cysts in left lung. Magnified axial T2-W magnetic resonance image (D) shows hyperintense cysts with no identifiable hypointense rim suggesting diagnosis of a non-hydatid cyst. However, this patient had two hydatid cysts in liver which were operated and albendazole was started for lung cysts which showed temporal regression in size
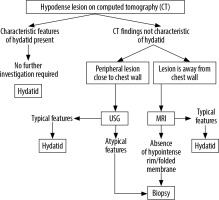
Thus, T2-weighted MRI, with its short acquisition times, lack of ionising radiation, and no need for contrast administration, can be a useful adjunct in making a correct diagnosis in difficult cases. The limitation of our study is that MRI was not performed in all the cases. However, it is feasible to follow a stepwise rational diagnostic pathway when a hypodense lung lesion is encountered on CT, which could be of immense benefit in systematic evaluation of a lesion and can aid in reaching a correct diagnosis (Figure 9). We observed a high diagnostic accuracy of T2-W MRI, but given the small number of patients, large sample studies are warranted to further study the role of MRI in pulmonary hydatid disease.
Conclusions
Although most pulmonary hydatid cysts can be diagnosed confidently on CT, some complicated cysts assume atypical appearances and closely mimic necrotic lung carcinoma, abscess, or schwannoma, making diagnosis difficult. In such difficult situations T2-weighted MRI can be employed to demonstrate hypointense rim or hypointense floating or folded wavy membrane to aid in obtaining a correct diagnosis.


