Introduction
Pulmonary embolism (PE) is the third most common cause of death in relation to cardiovascular disease [1]. Despite diagnostic and therapeutic advances throughout the years, PE remains a worrisome diagnosis, resulting in up to 40% mortality in all cases, and up to 65% in those suffering from massive PE. Because late diagnosis is associated with high mortality rates in acute PE, early diagnosis and risk assessment have become even more important [2].
Computed tomography pulmonary angiography (CTPA) can also reveal intraluminal thrombosis or other aetiologies explaining the patient’s symptoms. The prognostic value of CTPA parameters in mortality prediction has been documented in the literature, and various scoring systems involving CTPA parameters have been developed to estimate PE severity.
However, CTPA obstruction indices measure clot load, but the relationship of clot load to acute PE outcomes is inconsistent. Although single-image analysis of the right ventricle (RV)-left ventricle (LV) ratio has notable relevance compared to clot load measurement, studies assessing the RV/LV ratio from CTPA have presented conflicting results, with notable studies showing poor specificity compared to echocardiography [3]. Similarly, although abnormal interventricular septal positioning or right ventricular strain and increased pulmonary artery obstruction are markers of adverse prognosis [4], other studies demonstrate inconsistent results [5,6]. Other measures of RV function, such as contrast medium reflux into the inferior vena cava (IVC), size of the pulmonary arteries, or morphology of the right atrium (RA) and left atrium (LA), and coronary artery calcium (CAC) have not been adequately studied, as demonstrated by contradictory results [7,8].
In this study, we primarily aimed to evaluate the utility of CTPA measures in determining 30-day PE-related mortality. Secondarily, we sought to identify various echocardiographic, demographic, and clinical variables independently associated with short-term mortality in patients with acute PE.
Material and methods
Ethical approval and consent to participate
Ethical approval of the study was acquired from the Ethics Committee because of the study’s retrospective nature on deidentified data; informed consent was waived.
Human and animal rights
The study was designed respecting the expected ethical aspects and was performed according to the Declaration of Helsinki and its later amendments.
Design and setting
This retrospective study was carried out our institution from July 2019 to April 2023. During the study period, all data concerning patients, including age, sex, hospitalisation-related information, admission to the intensive care unit (ICU), and use of mechanical ventilation, mortality data within 30 days of admission, comorbidities, malignancy and treatment for malignancy, echocardiographic findings, laboratory findings, and CTPA images, were retrospectively obtained from the digital database. Patient charts were examined when required to confirm or clarify the digital records.
Participants
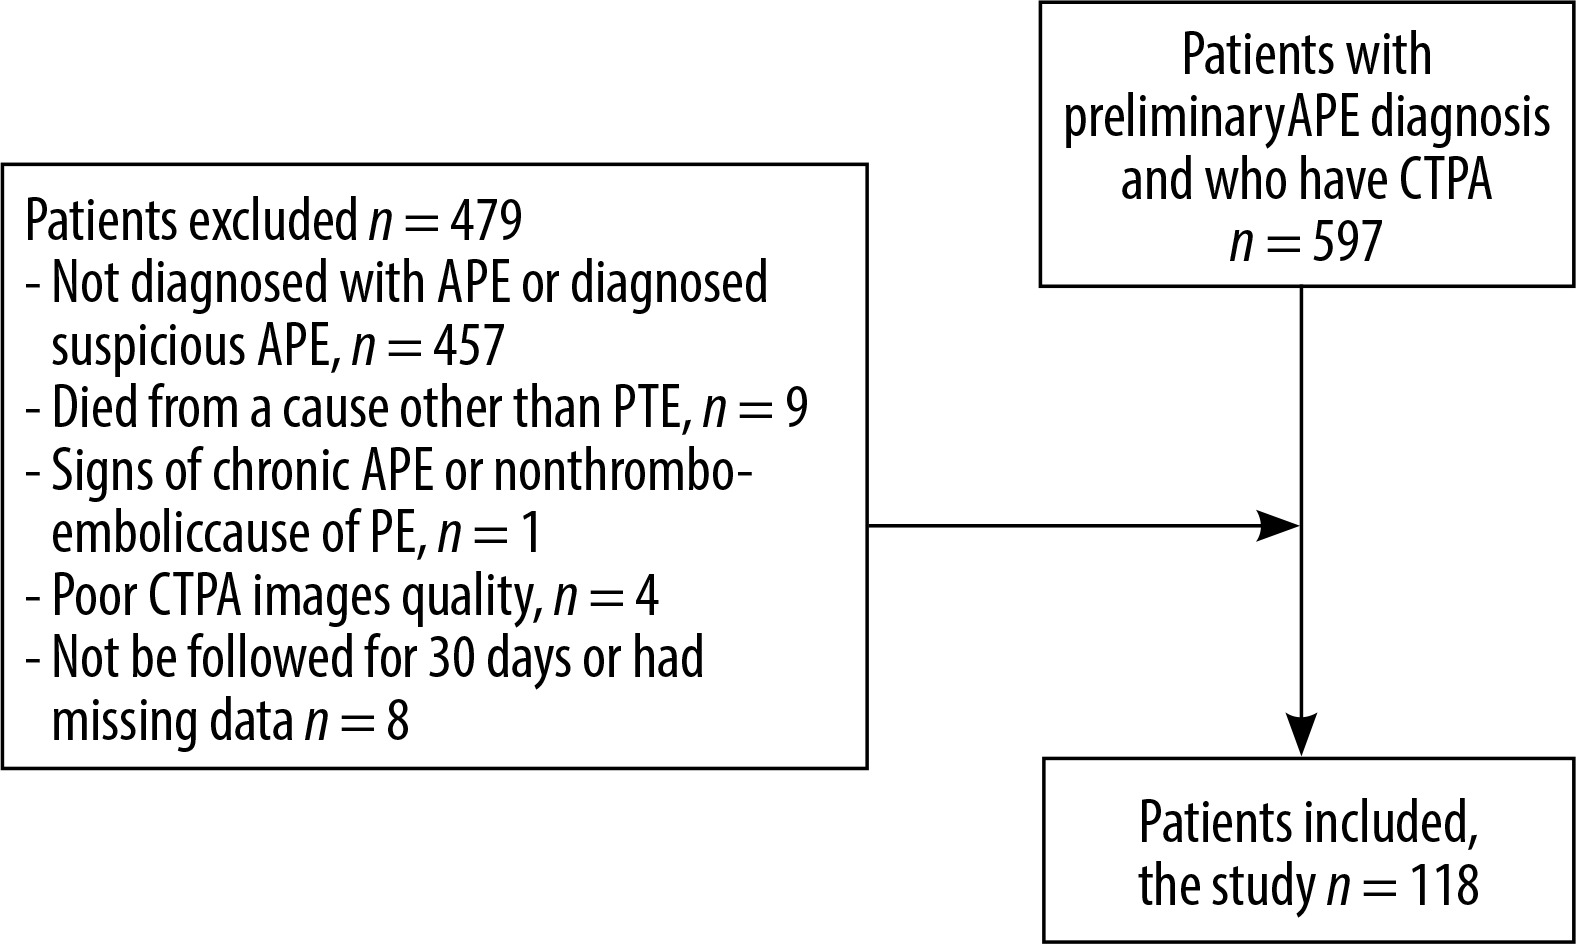
The data of a total of 597 patients who underwent CTPA with suspected acute PE were scanned. Those who were not diagnosed with acute PE or whose scans demonstrated minor/suspicious filling defects in only one sub-segmental branch (with normal opacification of the pulmonary trunk, main pulmonary arteries, and lobar branches), subjects who died from a cause other than acute PE within 30 days after admission, and patients with chronic PE or non-thromboembolic PE were excluded. Additionally, CTPA images with streak artifacts, venous phase imaging, or motion blur were not included. Finally, individuals who could not be followed for at least 30 days and who had missing data were excluded from the study. After initial screening and application of the aforementioned criteria, a total of 118 patients diagnosed with acute PE were included in the analyses (Figure 1).
Diagnosis and management
Acute PE diagnosis and management were performed in accordance with the current European Society of Cardiology guidelines [9]. All patients presenting with symptoms of PE such as shortness of breath, tachycardia (pulse > 110/min), stabbing chest pain, upper back pain, fainting attacks, and/or deep vein thrombosis, were subject to emergency CTPA examinations. Acute PE was defined as the presence of an endoluminal, low-attenuation filling defect with partial or complete occlusion of a pulmonary artery. Mortality was considered to be PE-related if the case was classified as “death secondary to PE” or “possibly secondary to PE” by at least 2 of the 3 physicians who independently evaluated each case of death.
Study groups
The patients were divided into 2 groups: those who died because of acute PE within 30 days (30-day mortality group; Deceased group) and those who did not die because of acute PE within 30 days (non-30-day mortality group; Survivor group).
CTPA protocol, assessment, and related tools
CTPA evaluations were done on a 64-section multidetector CT scanner (Toshiba Medical Systems, Irvine, California, USA), following the CT protocol of our hospital for PE without electrocardiography gating. Scan parameters were as follows: 0.5 mm collimation, 1.5 mm slice thickness, 1.4 mm increment, 100 kV, 135 mAs, a pitch of 0.9, and a gantry rotation time of 0.33 s. Images were acquired after automated (4-5 ml/s) administration of intravenous 100 cc nonionic contrast material (Iopromide, Ultravist, 300 mg/ml, Bayer Schering Pharma; Berlin, Germany). Total contrast agent injection dose was calculated according to weight (1 ml/kg). Scanning started 18-28 seconds after the contrast agent was injected and was obtained in the caudal-cranial direction. CT datasets were reconstructed using 0.5-mm slice thickness for axial CTPA examination. Multiplane sub-millimetre reformats were created in both the coronal and sagittal planes. Images were saved to picture archiving and communication systems (PACS).
Ascending aorta diameter (AAD), diameter of the main pulmonary artery (main PAD), right pulmonary artery diameter (PAD), left PAD, pulmonary artery angle, IVC diameter, azygos vein diameter, coronary sinus diameter, RA diameter (RAD), LA diameter (LAD), RV diameter (RVD), LV diameter (LVD), and RV thickness values were interpreted using coronal and sagittal multiplanar reformatted images by an independent radiologist blinded to all clinical data to minimise bias risks.
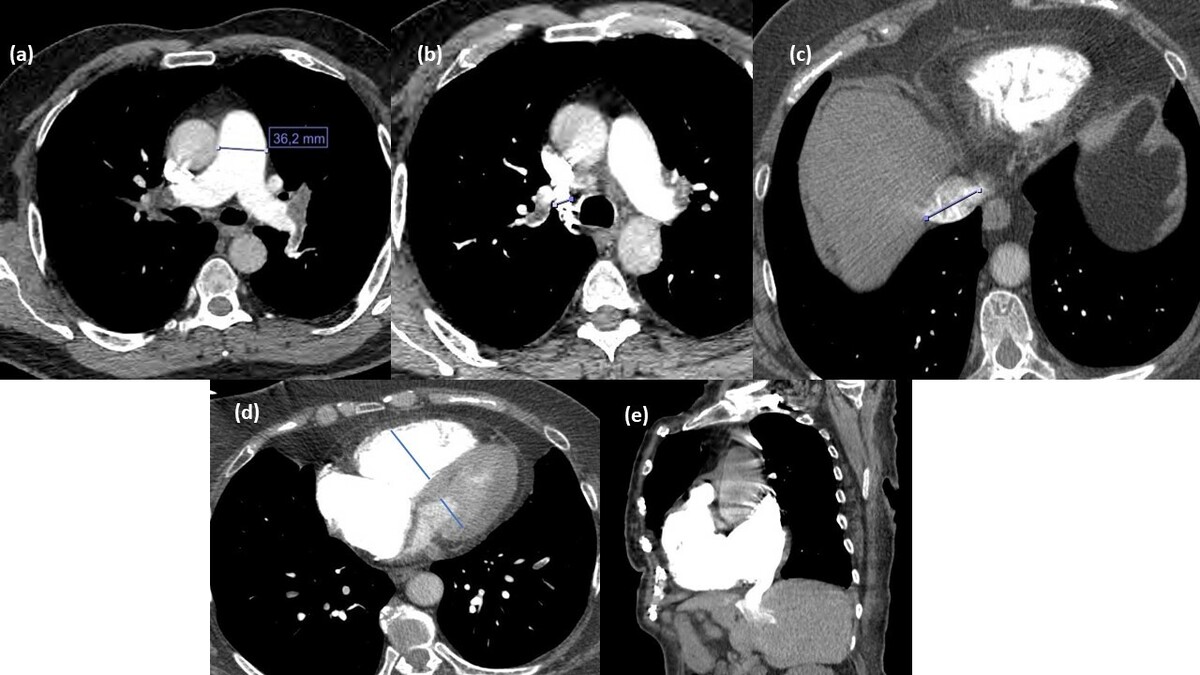
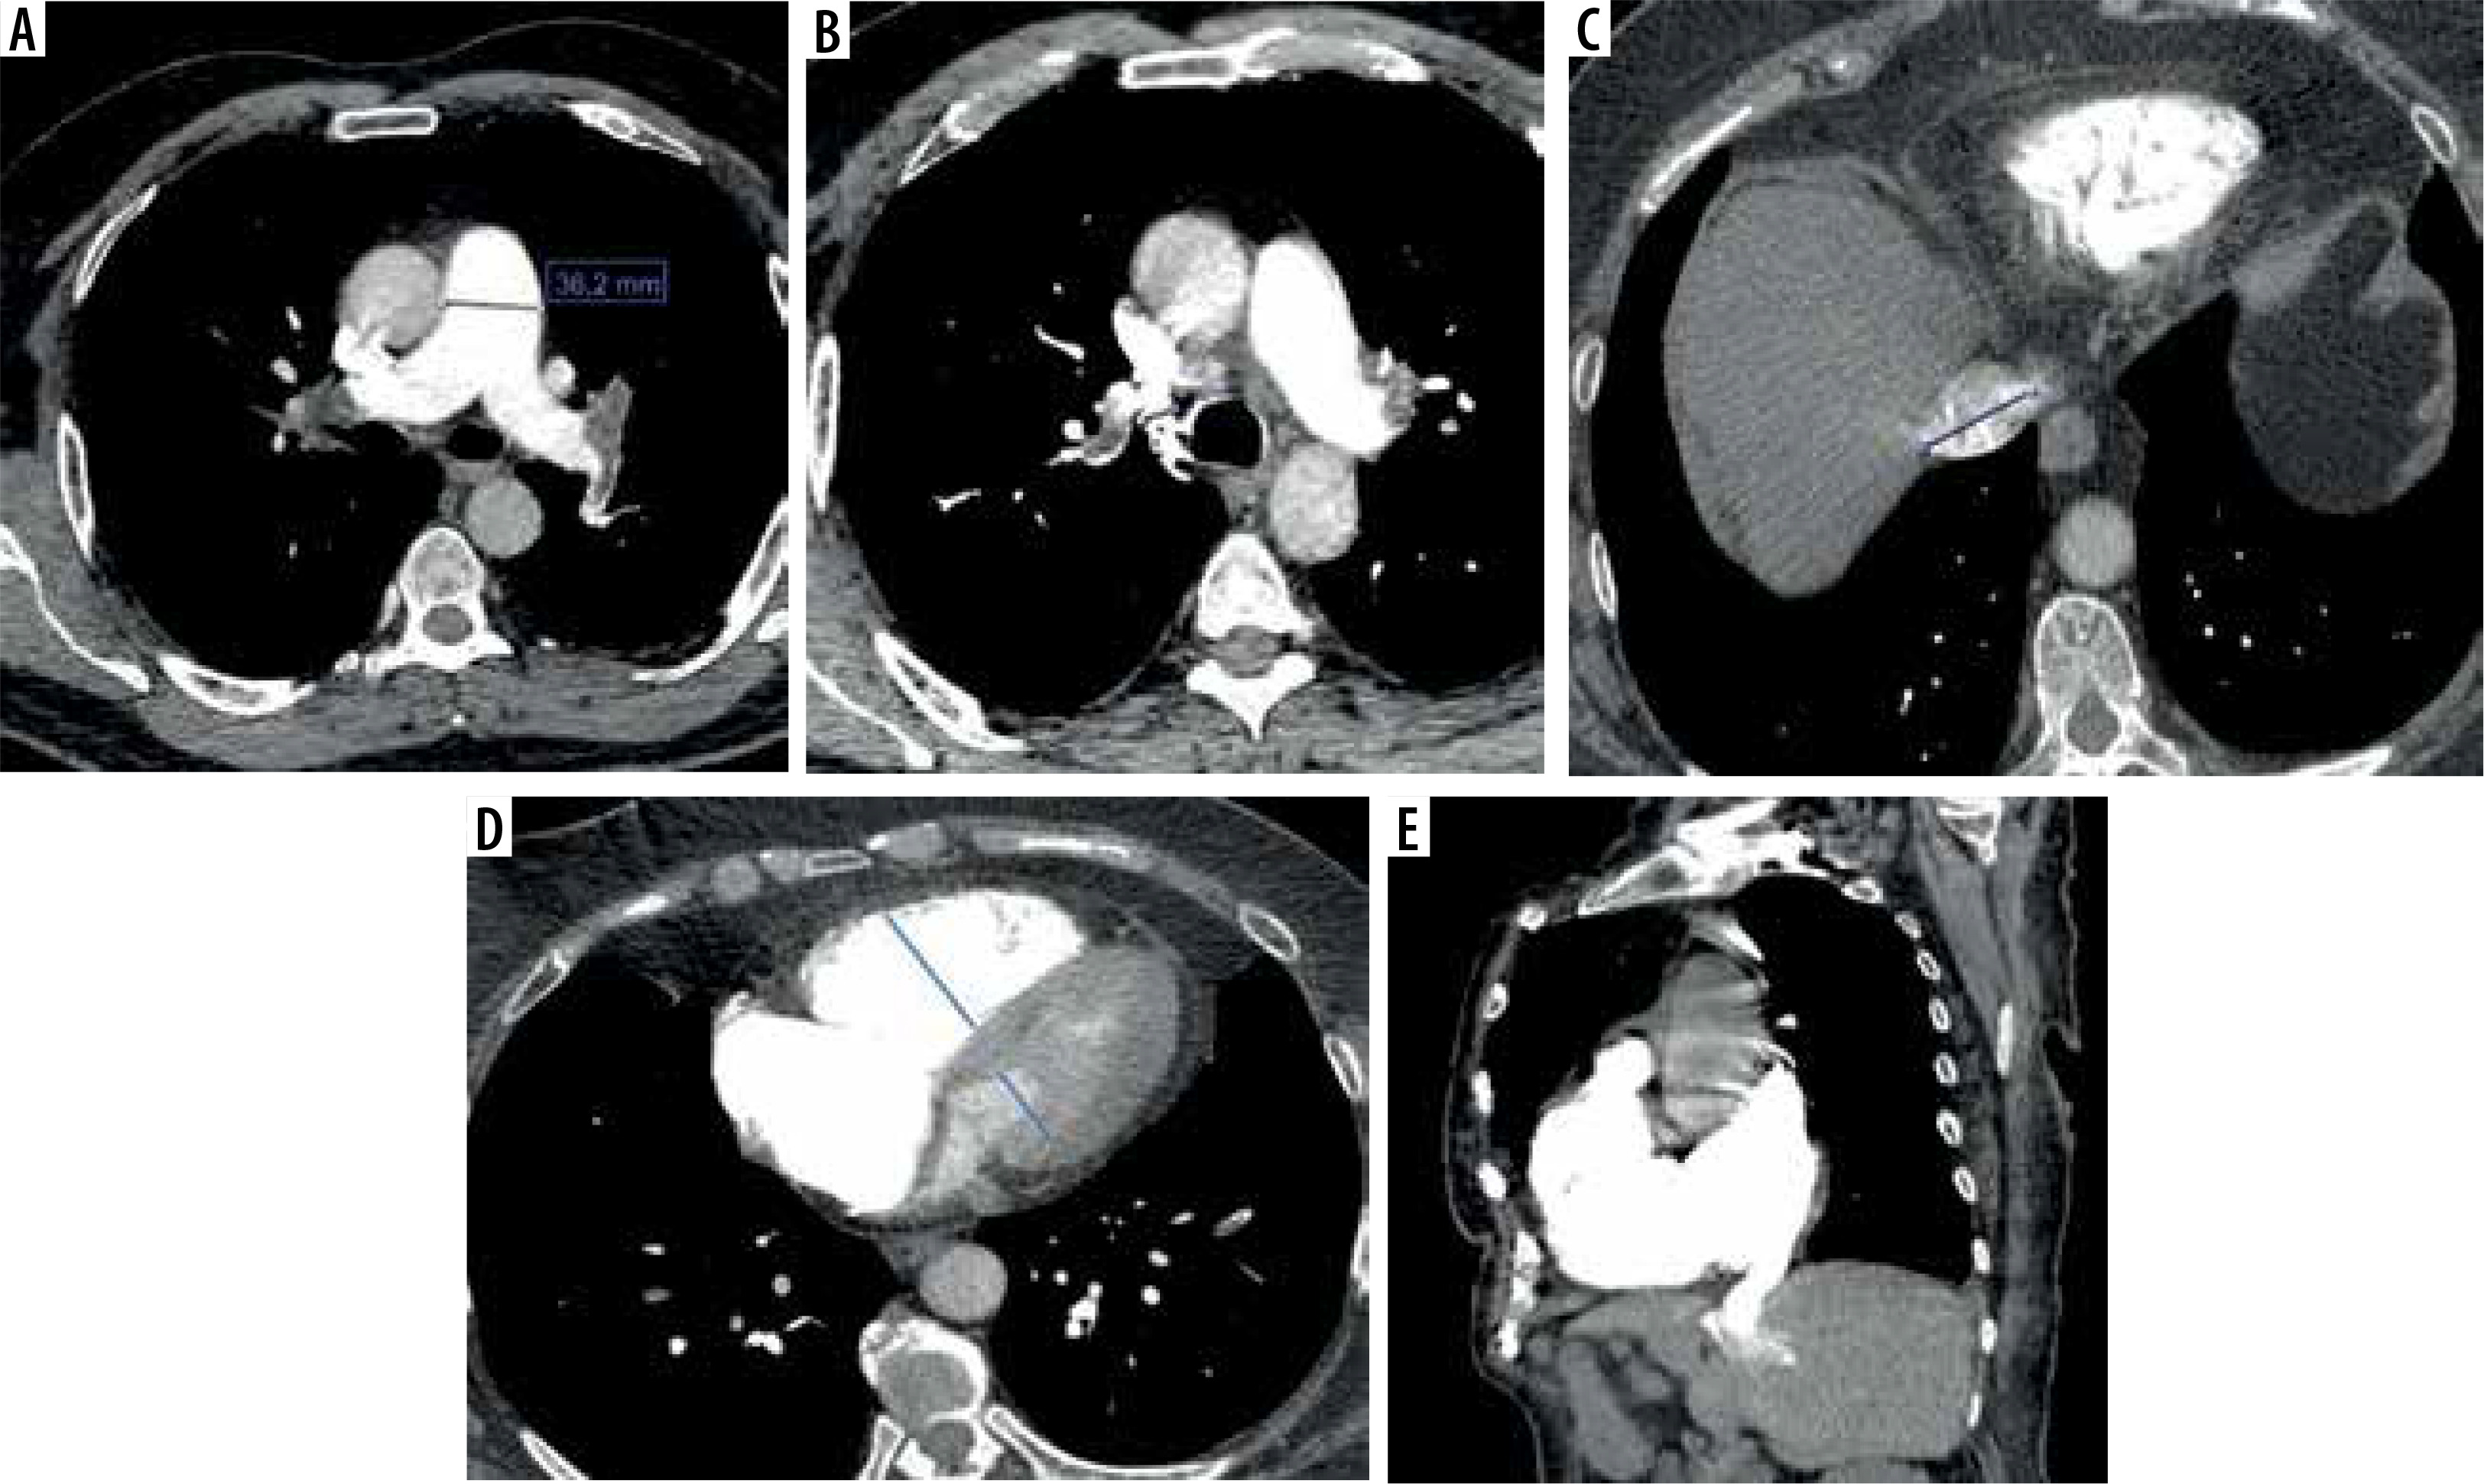
RVD and LVD were measured as the distance between the endocardium of the septum and the free wall of both ventricles. The measurement was recorded at the widest lumen size level just below the atrial-ventricular leaflets. In addition, the RVD-to-LVD ratio was calculated. RAD and LAD were measured at the widest lumen size level. Also, the RAD-to-LAD ratio was calculated. Interventricular septal bowing was assessed subjectively on transverse CT scans, and the presence and direction of the curvature were recorded as bowing to the RV, bowing to the LV, and flattened septum. Vascular diameter measurements were acquired on multiplanar reformatted images with a plane perpendicular to the long axis of the vessels. The pulmonary artery obstruction index (PAOI) was calculated based on the Qanadli score, defined by the number of occluded segmental arteries and corrected for the estimated degree of occlusion of each vessel. The thrombus grade for each artery was accepted as 1 in partial occlusion and 2 in complete occlusion as a correction factor. The result of the PAOI is between 0 and 100 and is expressed as a percentage [10] (Figure 2). In a single predefined transverse scan level, the main PAD and AAD were determined at the point where the right pulmonary artery was in continuity with the main pulmonary artery and crossed the midline. The main PAD-to-AAD ratio was then evaluated. The presence and grade of IVC contrast reflux were evaluated according to Groves’ 6-point scale. The trans-thoracic echocardiograms are used to measure systolic pulmonary arterial pressure (sPAP).
Figure 2
Computed tomography pulmonary angiography (CTPA) measurements in a 64-year-old female patient diagnosed with pulmonary thromboembolism. A) Main pulmonary trunk diameter. B) Diameter of the azygos vein. C) Diameter of the inferior vena cava. D) Right ventricle/left ventricle diameter ratio. E) Contrast medium reflux into the inferior vena cava
A semi-quantitative assessment of CAC was performed via an ordinal scale on thoracic axial images. CAC was evaluated in the left main, left anterior descending, left circumflex, and right coronary artery including arterial branches. Also, the ramus intermedius vessels were included in the left anterior descending artery assessment. Each vessel was scored 0 (absent), 1 (mild), 2 (moderate), or 3 (severe) according to CAC severity. Finally, a total CAC score (CACS) with a minimum of 0 and a maximum of 12 was obtained by summing the vessel CAC severity [11].
Mean Hounsfield unit (HU) values were acquired 3 cm from the bifurcation of the main pulmonary artery and in the LA at the level of the mitral valve. HU gradient was calculated by subtracting absolute values [12].
Laboratory analyses
Laboratory findings were obtained from blood samples drawn at admission. Blood tests included absolute platelet, neutrophil, and lymphocyte counts, mean platelet volume, platelet distribution width, D-dimer, and troponin levels. Also, the absolute neutrophil count to absolute lymphocyte count ratio and the absolute platelet count to absolute lymphocyte count ratio were calculated. All measurements were performed in the certified local clinical chemistry laboratories via the use of routine and calibrated devices according to the manufacturer’s recommendations.
Statistical analysis
Two-tailed p-values of less than 0.05 were defined to be statistically significant. All analyses were performed on SPSS version 25.0 (IBM, Armonk, NY, USA). Histogram and Q-Q plots were used to assess distribution characteristics. Data are given as mean ± standard deviation or median (first quartile to third quartile) for continuous variables according to normality of distribution, whereas frequency (n and percentage) are used for categorical variables. Between-group analysis of continuous variables was performed with Student’s t-test or the Mann-Whitney U test depending on the normality of distribution. Categorical variables were analysed with the χ2 test or Fisher’s exact test or the Fisher-Freeman-Halton test. The variables’ mortality prediction performance was assessed using receiver operating characteristic (ROC) curve analysis. Optimal cut-off points were determined by using the Youden index. Sensitivity, specificity, accuracy, and positive and negative predictive values were calculated for optimal cut-off points. Multivariable logistic regression analysis (forward conditional) was performed to determine significant factors independently associated with mortality. The multivariable model was created with the inclusion of variables that were significant according to univariate analyses.
Results
There were 17 patients in the Deceased group and 101 patients in the Survivor group. PE-related 30-day mortality was calculated as 14.41%. The mean age of the Deceased group (73.53 ± 14.17 days) was significantly higher than that of the Survivor group (60.23 ± 17.49 years) (p = 0.004). Sex distribution was similar in the 2 groups (female frequency was 53.47% in the Survivor group and 52.94% in the Deceased group). Compared to the Survivor group, the median length of hospital stay (p = 0.009) and the frequencies of ICU admission (p < 0.001), mechanical ventilation (p < 0.001), and radiotherapy treatment (p = 0.030) were significantly higher in the Deceased group. With respect to examined parameters, we found that the Deceased group had higher values for sPAP (p = 0.007), PAOI (p < 0.001), IVC reflux grade (p = 0.004), CACS (p < 0.001), HU gradient (p = 0.045), AAD (p = 0.003), right PAD (p = 0.015), left PAD (p < 0.001), and RVD (p = 0.013). The percentage of patients with left septal bowing (p < 0.001) was also higher in the Deceased group (Table 1).
Table 1
Summary of demographics, laboratory, and radiologic measurements with regard to mortality
[i] Data are given as mean ± standard deviation or median (first quartile to third quartile) for continuous variables according to normality of distribution, and as frequency (percentage) for categorical variables.
[ii] AA – ascending aorta, COVID-19 – coronavirus disease 2019, IVC – inferior vena cava, NLR – neutrophil-to-lymphocyte ratio, LAD – left atrium diameter, LVD – left ventricular diameter, MPV – mean platelet volume, PA – pulmonary artery, PLR – platelet-to-lymphocyte ratio, RAD – right atrium diameter, RDW – red cell distribution width, RVD – right ventricular diameter
According to ROC analysis, high (> 52.5) sPAP (62.50% sensitivity and 76.60% specificity), high (> 46.2) PAOI (94.12% sensitivity and 65.35% specificity), high (> 32.5) AAD (82.35% sensitivity and 61.39% specificity), high (> 26.0) right PAD (64.71% sensitivity and 78.22% specificity), high (> 23.9) left PAD (70.59% sensitivity and 73.27% specificity), high (> 2.5) IVC reflux grade (82.35% sensitivity and 50.50% specificity), high (> 41.0) RVD (76.47% sensitivity and 65.35% specificity), high (> 5.5) CACS (76.47% sensitivity and 73.27% specificity), high (> 156.5) HU gradient (64.71% sensitivity and 65.66% specificity), and left septal bowing (76.47% sensitivity and 79.80% specificity) were able to significantly predict 30-day mortality (Table 2, Figure 3).
Table 2
Performance of variables to predict mortality
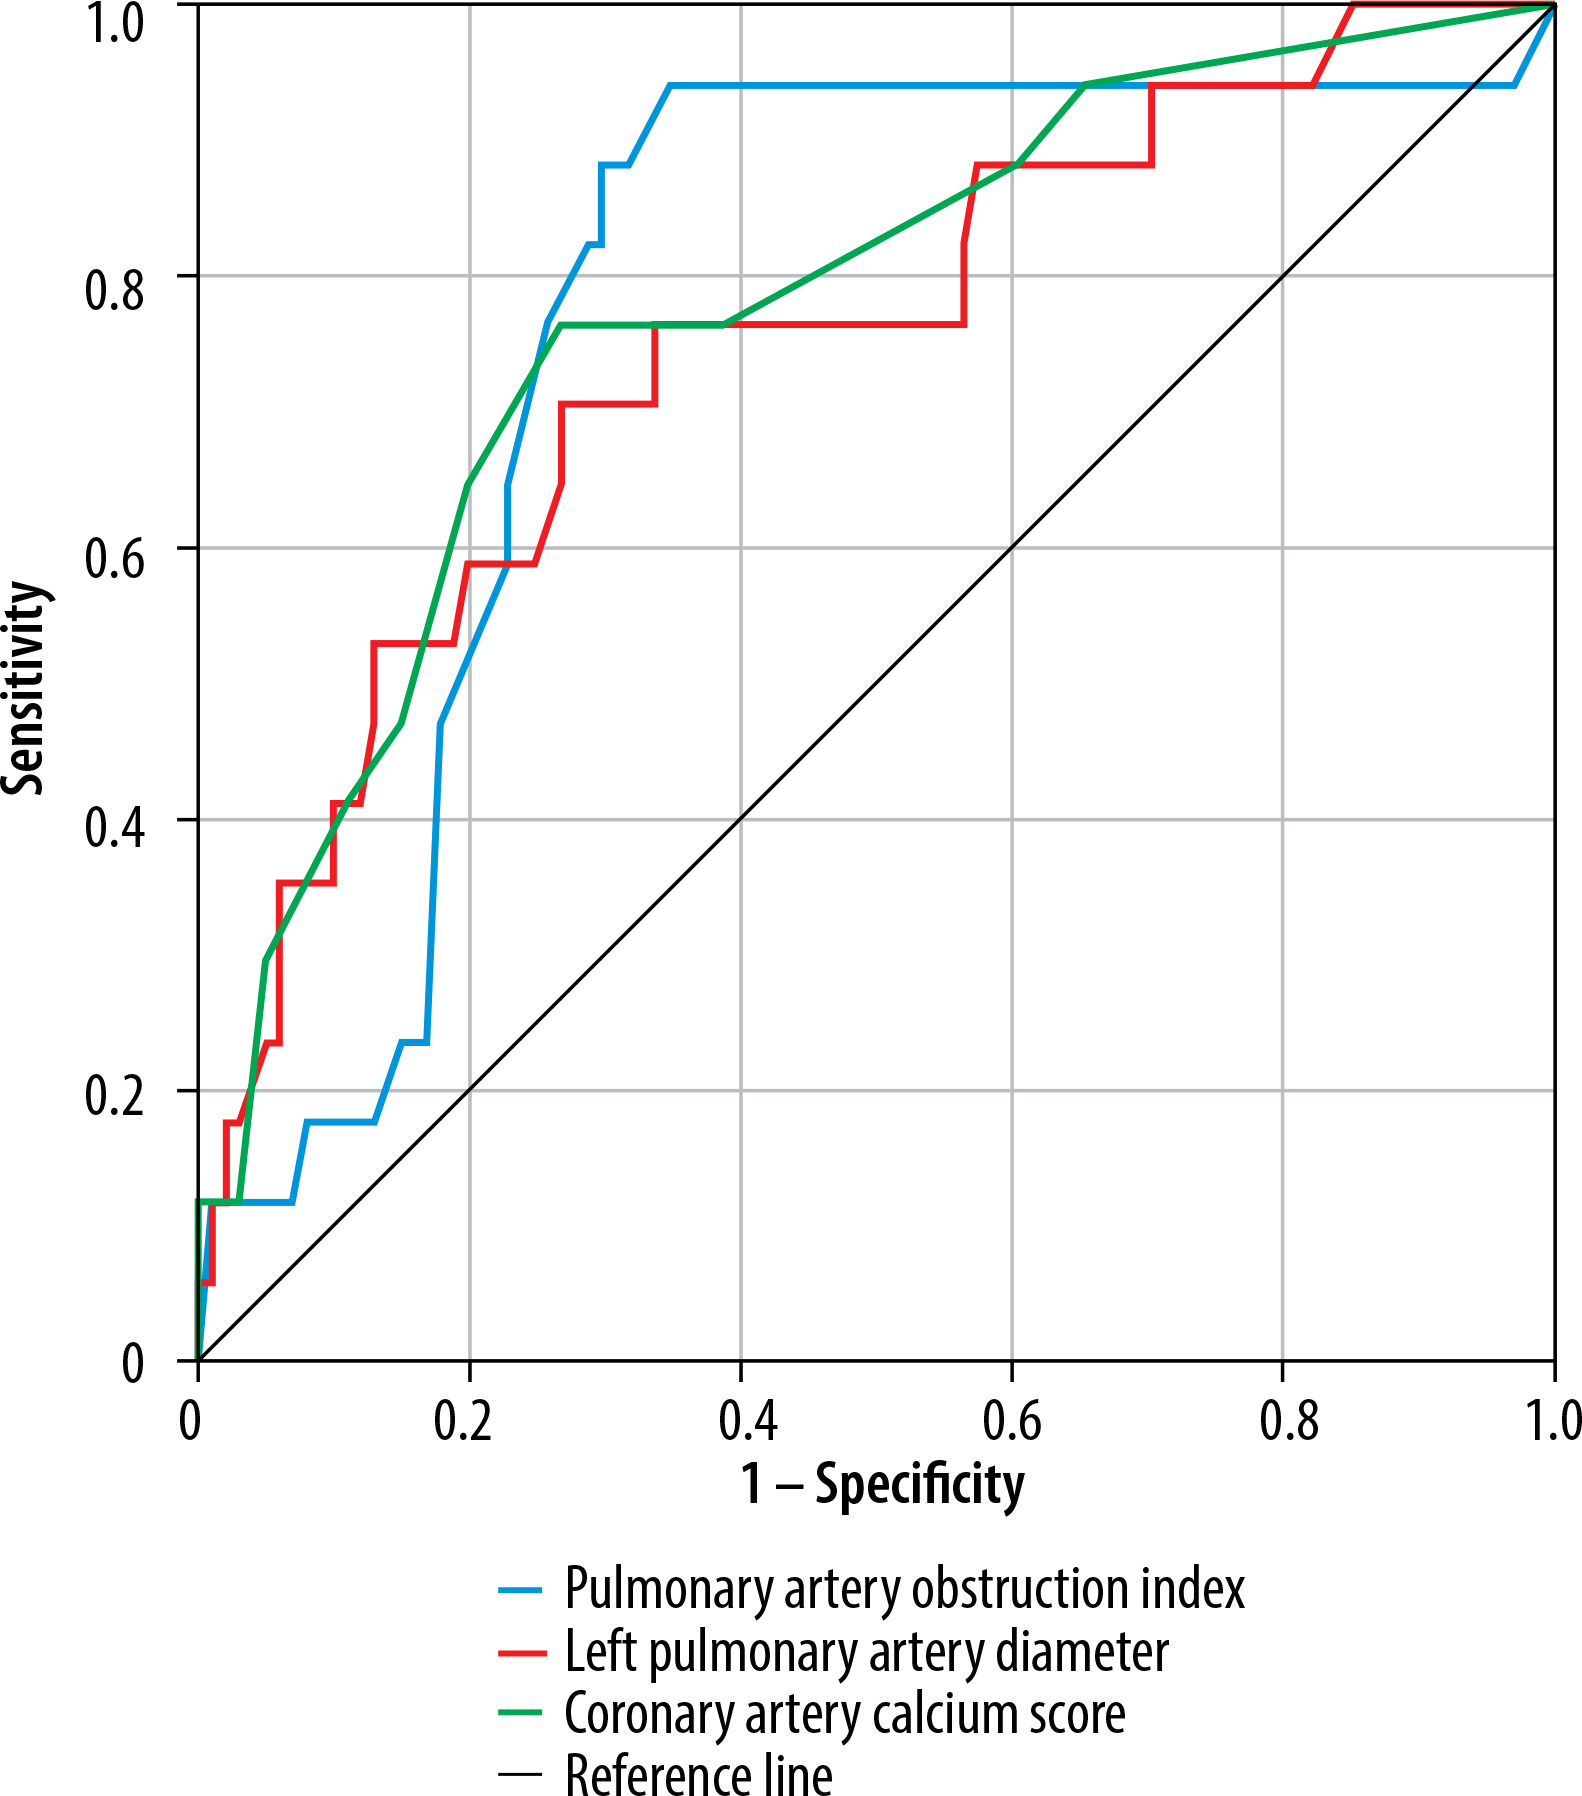
Figure 3
Receiver operating characteristics curve for diagnostic performance of PAOI, left pulmonary diameter, coronary artery calcium score for predicting 30-day mortality
Multivariable regression showed that having received radiotherapy for malignancy (p = 0.002), high PAOI (> 46.2; p = 0.004), high left PAD (> 23.9; p = 0.010) and high CACS (> 5.5; p = 0.030) were independently associated with mortality. Other variables included in the analysis, age (p = 0.071), sPAP (p = 0.502), AAD (p = 0.056), right PAD (p = 0.103), IVC reflux grade (p = 0.568), RVD (p = 0.468), HU gradient (p = 0.267), and septal bowing (p = 0.589) were found to be non-significant (Table 3).
Table 3
Significant factors independently associated with the mortality, multivariable logistic regression analysis
Discussion
In the management of acute PE, risk stratification is vital to identify patients at high risk of adverse events (mortality, circulatory collapse, haemodynamic decompensation) and to make appropriate management decisions [1]. The current retrospective cohort revealed that PE-related 30-day mortality was 14.41%. In ROC analysis, high sPAP, PAOI, AAD, right and left PAD, IVC reflux grade, RVD, CACS, HU gradient, and left septal bowing could significantly predict 30-day mortality. However, factors that independently increased the likelihood of mortality were found to be as follows: having received radiotherapy, high PAOI, high left PAD, and high CACS.
Modern CT technologies enable accurate visualisation of the main pulmonary artery and its branches with high resolution. A clear visualisation of the pulmonary artery allows for direct detection of the relationships between the entire pulmonary vasculature and the embolic space. In addition to being able to accurately detect acute PE, CTPA also enables the measurement of PAOI and evaluation of cardiovascular structure, which allows quantitative assessment of PE severity and right heart function [13]. PAOI is utilised by the Mastora embolism index [14] and the Qanadli embolism index [10]. Subsequent studies have confirmed that PAOI is associated with the severity of acute PE [15]. However, there are insufficient literature data on the utility of PAOI in risk stratification. In the present study, PAOI was identified as an independent predictor of 30-day PE-related mortality. In the present study, PAOI was able to predict 30-day PE-related mortality with 94.12% sensitivity and 65.35% specificity (cut-off > 46.2%). PAOI had the third highest area under ROC curve among the variables included in the study. In a study by Guo et al. [16], PAOI was found to be significantly higher in high-risk acute PE patients compared to low-risk ones. In the ROC analysis, the 52.5% cut-off value of the PAOI had 100% sensitivity, 81.0% specificity, 69.2% negative predictive value, and 100% positive predictive value to distinguish high-risk acute PE patients from low-risk patients. In addition, PAOI was positively correlated with some cardiovascular parameters including the main PAD/AAD, RVD, and RVD/LVD, and the highest correlation was between RVD/LVD and PAOI. Notably, LVD was found to correlate negatively with PAOI. PAOI has also been shown to have strong correlations with sPAP, RV systolic pressure, and RV wall thickness on long-term follow-up echocardiography. Higher rates of RV dysfunction and RV dilatation were found in patients with higher PAOI, with a PAOI value of ≥ 46% demonstrating considerable value as a predictor for RV dysfunction [6]. Nural et al. [17] demonstrated that with a cut-off value of 48%, PAOI could distinguish acute PE patients with haemodynamic instability from acute PE patients without haemodynamic instability (sensitivity of 95% and a specificity of 76%), which is a valuable result despite the high cut-off. Another study showed that an increase in PAOI was a risk factor for death in patients with acute PE. It was also revealed that a < 40% cut-off for PAOI had 100% negative predictive value for death [18], indicating that this threshold could be valuable as a screening tool. This is supported by the study by Zhao et al. [19], which showed that patients with critical acute PE had a significantly higher PAOI than those with non-critical clinical findings. In a retrospective study, a CT-detected PAOI of > 70% was found to be associated with increased 30-day mortality among patients with acute PE [20]. On the other hand, in a retrospective study, the Qanadli score was found to be correlated with troponin I levels, but no significant correlation was found between PE-related death or all-cause death at 30 days [5]. Similarly, another conflicting study showed that PAOI did not predict 30-day mortality but was correlated with troponin I level [21]. Although many studies claim that high PAOI plays a role in predicting poor acute PE prognosis, the existence of studies claiming the opposite creates doubt as to its reliability in clinical decision-making. It is also noteworthy that the cut-off values of PAOI in predicting poor prognosis and mortality show significant differences between studies. These may be because the severity of an acute PE depends not only on the size and distribution of thrombi, but also on the patient’s underlying cardiopulmonary status [5]. Nonetheless, PAOI appears to be an accurate evaluation method that can be widely used in clinical practice, can be measured simply and with readily available CTPA images, and does not require special software [16]. Therefore, determining the definitive usability of PAOI in the management of acute PE and the most appropriate cut-off value that can predict mortality with comprehensive randomised controlled studies may contribute to improved risk assessment in PE, and therefore improved outcomes.
Pulmonary artery trunk enlargement is an indicator that may reflect pulmonary hypertension, intrapulmonary inflammation, cardiac and vascular injury, and abnormal blood coagulation, as well as acute central PE and heart failure [22]. Acute PE causes release of pulmonary vasoconstrictors in addition to mechanical obstruction of the pulmonary artery. Obstruction and increased vasoconstriction in the PA cause increased pulmonary vascular resistance and blood accumulation in the pulmonary arteries, leading to PA distension (PAD). However, studies investigating PA enlargement in acute PE patients present conflicting results, and the optimal cut-off values associated with 30-day mortality have not been established. In the current study, high left PAD (> 23.9 mm) was independently associated with 30-day PE-related death. In one study, pulmonary hypertension, RV systolic hypertension, RV dilatation, RV dysfunction, and RV hypertrophy were significantly more common in patients with higher PAD and RV strain [6]. In a secondary analysis of data from a prospective observational cohort study, main PAD was associated with 5-day adverse outcomes, but not right PAD or left PAD. This study emphasised that the clinical benefit of PAD may be limited due to various factors, including the fact that main PAD in patients with adverse outcomes has a wide interquartile range [23]. Bach et al. [24] found that the diameter of the pulmonary trunk of patients who died within 30 days was significantly higher than that of survivors. While the left PAD was not measured in this study, the right PAD did not differ between the groups. The findings of this study showed that the diameter of the pulmonary trunk is more relevant than RVD/LVD in predicting the prognosis of acute PE. In a retrospective study, main PAD was significantly correlated with troponin I levels and all-cause/PE-related death at 30 days [5]. On the other hand, several studies have claimed that PAD is a poor predictor of PE outcome. In a previous study, PA enlargement was not found to be sensitive or specific for right ventricular hypokinesis, an important predictor of mortality associated with acute PE [25]. In the present study, unlike most prior literature, only high left PAD was identified as an independent risk factor for PE-related 30-day mortality. Although high (> 26.0 mm) right PAD could predict mortality, its sensitivity and area under ROC curve values were quite low. There appears to be insufficient evidence regarding the potential utility of PAD in the prediction of PE-related death.
One of the suggested causes of RV dysfunction in PE is RV ischaemia, which causes myocardial damage. Although it is thought that there is an overlap between cardiovascular diseases and PE, this relationship is not fully clarified. Although some studies argue that patients with PE are at risk of future cardiovascular events and vice-versa, these claims are not supported in some other studies. CAC is a marker thought to be associated with mortality. CTPA images allow for calcification assessment in cases where motion artifacts and contrast material preclude conventional CACS methods. The presence of CAC has been associated with mortality even when it is incidentally detected on non-gated CT among patients with chronic obstructive pulmonary disease, lung cancer, and other respiratory conditions [26]. However, the clinical significance of CAC in patients with PE is poorly understood. A CACS of > 5.5 was another independent risk factor for 30-day PE-related mortality, and it demonstrated the second-highest area under ROC curve value in this study. Williams et al. [27] hypothesised that CAC could be a marker of long-term mortality irrespective of PE severity. In their study, patients with CAC were found to be 3 times more likely to die than patients without CAC, and patients with severe CAC were at the highest risk of death. In multivariate analysis, CACS was found to be an independent predictor of 3-year all-cause mortality. In another study, overall and PE-related 30-day mortality was significantly higher in the presence of CAC in patients with PE [28]. Furthermore, a CACS of ≥ 6 has been associated with higher 28-day and 6-month mortality, and CACS ≥ 6 remained independently associated with death at 6 months. In the study of Vakil et al. [29], the presence of CAC was a significant predictor of adverse outcomes during admission (ICU admission, prolonged hospitalisation, or death) and after 6 months, particularly when patients with malignancies were excluded. Similarly, in the study by Albay et al. [8], there was a significant relationship between increased CACS and increased mortality. The association between CAC and early mortality is consistent with the hypothesis that myocardial ischaemia can lead to RV dysfunction in PE [28]. However, since the severity of CAC was associated with peak troponin T and NT-proBNP levels but not with increasing RV dysfunction, there might be additional mechanisms related to mortality which may be associated with CAC and left ventricular dysfunction. Another possible explanation could be that patients with severe CAC and RV strain are more likely to die before reaching the hospital [28]. The coexistence of PE and CAC may increase the risk of right heart strain [11]. However, in the present study, CAC was associated with 30-day mortality, but most right heart strain markers were not, indicating the need for further studies to elucidate other potential mechanisms concerning CAC that lead to higher mortality in patients with PE.
As a general comment, the 30-day mortality rate associated with PE in the study population was close to the rates reported in the literature [4, 30]. Although sPAP and some CTPA variables were able to significantly predict 30-day mortality in this study, the sensitivity, specificity, and other performance measures did not reach the levels that would be desired of predictive tools. In addition, although a significant correlation was found between multiple variables and 30-day mortality in univariate analysis, multivariable analysis identified only radiotherapy, PAOI, left PAD, and CACS as independent risk factors. Cut-off values for CTPA measurements were not determined in most of the previous studies, and in studies where these were reported, major inconsistencies are observed. PAOI, PAD, and CACS are variables that can be easily obtained by CTPA measurements. Optimal cut-off values determined for these parameters can provide predictability and enable more effective management. We hope that our study will provide a holistic view to all CTPA parameters and make important contributions to the literature in this context, and will encourage the investigation of the pathophysiological mechanisms between these 3 parameters and PE.
Limitations and perspectives
Despite the examination of a large set of parameters and detailed assessment with respect to relevant literature, there are important limitations that should be mentioned. First of all, analyses were performed on a select set of patients, because the exclusion criteria were critical for reliable analysis of the targeted population. Although this facilitated better characterisation of the study group and more reliable results in terms of each parameter, it is evident that the smaller cohort leads to limited external validity. Because it was a retrospective study, treatment details, long-term follow-up results, additional echocardiography parameters, and cardiac biomarkers were not included. Although regression analyses were performed with all relevant parameters included in the model, there is still a possibility that patient comorbidities would have effected outcomes and the findings obtained from CTPA images, for instance, PAD results [24]. Due to the scope of the study, we did not assess inter-relationships between CTPA parameters, echocardiography findings, laboratory parameters, and other adverse outcomes, because these analyses would be better suited for prospectively designed studies.
Conclusions
In addition to demonstrating diagnostic/predictive results for various CTPA parameters and others, the present study reports that radiotherapy history, high (> 46.5%) PAOI, high (> 23.9 mm) left PAD, and high (> 5.5) CACS were independent risk factors for PE-related 30-day mortality in patients with acute PE. These parameters obtained in spiral CTPA are potentially useful and readily available tools for predicting poor prognosis in patients with acute PE. Thus, the measurement of these values can assist acute PE management by enabling the identification of critical events. Despite promising results in predicting short-term mortality in acute PE, further prospective cohort studies are needed to assess external validity.